A New Variant of Game Theory Based Decision
Making (GTDM) Algorithm Routing Protocols to
Improve Energy Efficiency on Vehicular Delay
Tolerant Network (VDTN)
Muhammad Biben Triadi
1, Doan Perdana
2, Rendy Munadi
3and Li Wenzao
41,2,3School of Electrical Engineering, Telkom University, Indonesia 4College of Communication Engineering, Chengdu University, China
Abstract: These days, the application of Delay Tolerant Networks (DTN) have been expanded into various scenarios of communications field. Vehicular Ad hoc Networks (VANETs) as a communication scenario which treat its subject to disruption and disconnection with frequent partitioning and high latency. Therefore, Vehicular Delay Tolerant Network (VDTN) is introduced as a new research paradigm due to several characteristics match according to specific prerequisites. DTNs is proposed in Vehicular Network because its mechanisms which is using store-carry-forward, can be implemented to deliver the packets, without end-to-end connection, to the destination. One of challenging research of DTN in routing protocol is to meet prerequisites of many applications, especially in vehicular network (VDTN). This paper presents a new variant of Game Theory based on Decision Making (GTDM) that can deliver packet to static node due to improve the energy efficiency of DTNs in city environments. Hence, its destination node (Receiver Node) needs to go to the static node to take their packet under Working Day Movement (WDM), because relay node will be passing by the static node with continuously move to its track to deliver packet. In this paper author will analyze the new variant of GTDM (NVGTDM) which can be more useful than original GTDM for application in city environment with using transportation movement. We conclude that modification of GTDM routing algorithm (NVGTDM) improves energy efficiency as much as 10.38% than the original GTDM. Hence, it can be ensured to compare either to Epidemic or PRoPHET routing algorithm with 55.44% and 68.75% in rates of energy efficiency respectively.
Keywords: VDTN, Energy Efficiency, WDM, NVGTDM, GTDM, Epidemic, PRoPHET.
1.
Introduction
In recent years, the use of DTNs in metropolitan areas has attracted increasing attention [1–3]. In the future, “smart” cities may be created by essential public services using cutting-edge computing technologies [4], which are mainly realized on DTN platform. Unlike the use in other environments, such as battlefields, space, and oceans [5–7], there are more opportunities with the rapid development of portable smart devices. DTN routing problems are discussed based on the different requirements for various deployment environments and applications.
A DTN protocol should be cautious in how it saves the limited network resources [8]. Hence, a packet is transmitted to improper relay node, which can cause the decreasing of network performance. Focusing on the energy efficiency, we try to contribute a further research to solve energy consumption, which node in the network storage and rational
use of energy is considered in the whole process, to try to prolong the survival time of the transfer nodes [9]. Several works have proposed to improve delivery ratio and mitigate average delay, but it gains the wasting amount of energy [8]. Based on the considerations, Wenzao Li et al. [10] has proposed a non-cooperative routing protocol algorithm called GTDM which can maintain the waste amount of energy and also without neglect several DTN parameters such as Packet Delivery Ratio (PDR), Average Latency, and Overhead Ratio compare to Epidemic and ProPHET protocols.
Figure 1. DTN Layers and VDTN Layers [11] VDTN is a blend between DTN technology and VANET technology. The difference between VDTN and DTN we can see from layer arrangement. On VDTN bundle layer there are two part, which is shown in Fig. 1, the first part is bundle signaling control, and the second is bundle aggregation and de-aggregation. The function of bundle signaling control is to control signaling on vehicle. The function of bundle aggregation and de-aggregation is to store and forward message.
In this paper, we propose a modification of GTDM routing protocol which can improve the efficiency of energy consumption than GTDM routing protocol itself and have better network performance than Epidemic, Prophet. We describe the distributed fixed sink stations for data collection and the mobile node as the role of data source or relay node in a city environment. Then, a neighborhood node selection method is introduced.
presents the basic theory which are used in this paper, which contains the calculation of GTDM routing protocols. In addition, written with the mean to achieve the purpose of improving energy efficiency. Section 4 presents the simulation settings and the results, and the paper is concluded in Section 5.
2.
Related Works
The limited network resources such as energy, extra messages, and buffer size are the things that have to be considered when a new DTN protocol is proposed. The new DTN routing protocol can be assessed as a good protocol when it can save the limited network resources as much as possible. When the network performance is decreased, caused by an improper relay node which waste the network resources, this node should be banned from the network. Game Theory (GT) can be used to determine a node sends a packet to another node due to solve such problem. [12-13]. Generally, there are two kinds of GT: cooperative game theory which pays more attention to the maximal profits of the group through cooperative efforts and noncooperative game theory which focuses on each node’s individual utility, and less attention is given to the utility of the whole DTNs. In cooperative GT, a node will act selfishly by minimizing their individual utility in a distributed decision-making environment, the relay nodes which uses cooperative GT method should agree on the premediated strategies and participants have global knowledge [14-15]. Meanwhile, noncooperative does not require nodes to have global knowledge. A large amount of communication maintenance costs for global knowledge is required by the relay nodes which use cooperative approach; hence, non-cooperative game approach should be implemented in DTNs, because DTNs with complete global knowledge are not realistic in reality.
El-Azouzi et al. [16] have proposed a noncooperative game approach due to the same considerations, where source and destination nodes were enclosed in two partly overlapping regions. The Epidemic routing algorithm is used for a high number of nodes to maximizes the probability of successful data delivery. However, the existence of relationships between two people in a city environment will be ignored when Epidemic routing is used. For an instance, two persons will spend all day working, which causes the mobile nodes to have repeated contact [17]. In addition, S Bharathi et al. [18] and Li Wenzao et al. [10] tells that in city environments there are active objects and inactive objects, which we also agree. Based on S Bharathi research, the high encounter opportunity will belong to the former objects than inactive objects, and the active sensor carrier is fit as a relay node in the network [18]. In that case, mobile nodes have movement regularity, which can be obtained by history, and cyclical contact in city environments. The common DTN routing algorithms are not working at their highest efficiency proposed to fit in these conditions (in city environment). Prophet is a probabilistic routing protocol, which focuses on the forwarding decision problem of routing patterns, is one of the most commonly used routing algorithms in DTNs that uses aging methods and past-encounter history for forwarding decision. Clearly, the Prophet routing algorithm and Epidemic routing algorithm do not fulfill prerequisites in
city environment, where all the characteristics of social relationships and the routines of pedestrians are not considered in Prophet routing algorithm and the ability under the limited resource scenario cannot be released by Epidemic routing algorithm.
A more practical and effective GTDM-based routing algorithm has proposed by Li Wenzao et al. [10]. GTDM-based has proved as a more flexible and scalable DTN routing algorithm for city environments and also can prolong the network lifetime than Epidemic and Prophet, because it considers various aspects of city environments. The public transportations such as Taxis and Buses are included in their research. In the real city environments, the arrival time of public transportation (such as bus and tram) is indeterminate whereas its route is determinate, and the lack of implementation of routing performance has been gained by the mechanism of routing protocol which does not consider that uncertainty [19]. Furthermore, the impacts of that case require the multi-objective meta-heuristics for the energy consumption [20].
From the researches mentioned above, we proposed a modification of GTDM routing protocols due to solve a further problem, included meta-heuristics, which have gained by the uncertainty movement of relay nodes in VDTN. The emphasis of this research is comparing to GTDM itself. The city environment of Helsinki (Finland) and vehicular relay nodes are the scope of problem in this research. As the contribution, this paper can prove that this on-going research about VDTN routing protocol can shape to be a better performance, especially in energy efficiency.
3.
Research Methods
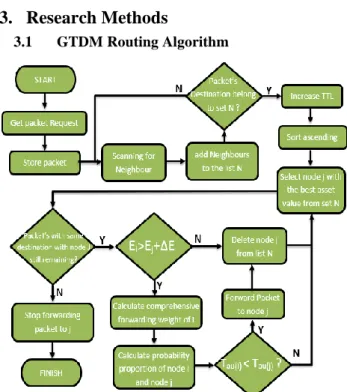
3.1 GTDM Routing Algorithm
mechanisms. Moreover, any transmission behavior should be cautious; the meaningless forwarding also consumed the nodes’ energy. Obviously, the energy hole will decrease the performance of DTN; thus, the energy balance should be necessary to be considered in GTDM. The flowchart of GTDM routing protocols is shown in Figure 2.
Every relay node has a messages or packets to be transmitted, the relay node will move regularly according to its characteristics. The steps of the original GTDM routing protocol can be seen in Figure 2, but basically GTDM routing protocols has 5 steps.
1. Node i will be scanning for the other nodes which are covered in its coverage, and then input those other nodes in the list 𝑁. Here, 𝑁 = {𝑁 1,2, . . . , 𝑁𝑖, . . . , 𝑁𝑛} is a finite set of 𝑛 mobile nodes, which currently have effective connections. is one of the other three tuples which are used in the normal form game of DTNs, there are e 𝐺 = ⟨𝑁,𝑆,𝐹⟩. 𝑆 or 𝑆𝑖 represents strategy selection of the node 𝑖. The strategy combination is 𝑆 = {𝑠𝑖, 𝑠𝚤}, where strategy 𝑠𝑖 represents the choice of node 𝑖 and 𝑠𝚤 is the choice of the other 𝑛 − 1 mobile nodes. The payoff function of the mobile node is represented by 𝐹 = {𝐹 1, 𝐹2, . . . , 𝐹𝑖, . . . , 𝐹𝑛}, while 𝐹 is defined {𝜂,𝜂𝑖∗}. Here, 𝜂 is the award function and 𝜂∗ is the punish function.
2.
• 𝜔 = the successful delivery of nodes,
which is calculated as follow [10]:
(1)
where 𝜔iφ(t) represents the accumulated packet delivery
statistics at time t, φ is the destination address set, and ε
is the event counting function.
• 𝐶𝑖𝑟 = coins count
• V = asset value
• 𝐿𝑟 = the remaining buffer size
• 𝐸𝑟 = the energy level, which is calculated as follow [10]:
(2)
where is the initial energy of node 𝑖. The energy consumption function is described by .
3. If the Node i doesn’t find the expected neighbourhood nodes, node i will sort its packets by increasing TTL, then select node j which has the best asset value on the list, then select the message which has the lowest TTL in buffer. Meanwhile, node 𝑖 selects a neighbor as a relay node from set 𝑁𝑖 to transmit the remaining packets. Node selection of the competition in the GTDM depends on asset V of the node in game theory. It satisfies the corresponding payoff function 𝑓(𝑠𝑖, 𝑠𝚤) ≥ 𝑓𝑖(𝑠𝑖∗, 𝑠𝚤) for 𝑠𝑖∗ ∈ 𝑆𝑖. the asset V in GTDM is described below [10]:
(3)
4. Node i will compare several parametrics of the neighbourhood node. Those are Energy Level, Probability to deliver packet, Coin, and asset value. By first comparing the energy level of 𝐸𝑟, node 𝑖 will stop delivering packets if
the condition > + Δ𝐸 is satisfied. If this condition is not satisfied, then each pending packet of node 𝑖 is calculated with node 𝑗 for comprehensive forwarding weight 𝜏. Here, 𝜏𝑖 of node 𝑖 is calculated in the following [10]:
(4)
where 𝛼, 𝛽 are weight factors. The destination address of the packet is represented by 𝜎 and the probability of delivering proportion is described by 𝜎 ∈ 𝜑. . It represents which of the two nodes is more liable to successfully deliver packet and it is calculated in the formula below [10]:
(5)
( represents the free buffer ratio function and can be derived from following formula [10]:
(6) where represents the buffer size of node 𝑖. A higher value indicates a higher carrying capacity.
5. At each stop in this second traversal, GTDM determines whether node 𝑖 transmits or not transmit the current packet based on its comprehensive forwarding weight 𝜏. Node i will transfer the packets if the condition 𝜏𝑖 < 𝜏𝑗 are satisfied. Node 𝑖 will get punishment by the function 𝜂∗(𝑐𝑖) when node 𝑖 transmits a packet to the proxy node 𝑗, in the other word’s node 𝑖 get failure in the game. Conversely node 𝑗 wins in the game and will get reward by the function (𝑐𝑖). 𝜂(𝑐𝑖) and 𝜂∗(𝑐𝑖) are calculated as follows [10]:
(7) After this delivery decision, the asset value V of each node is changed by function (4). There are two constraints for neighborhood selection and packets selection in GTDM.
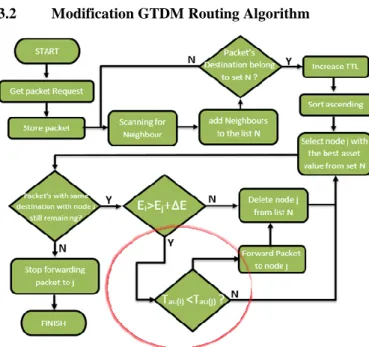
3.2 Modification GTDM Routing Algorithm
We modified GTDM routing protocols to reduce 2 process, because the more processes are run, the more energy will be consumed. It is a means to reduce energy consumption in this paper. NVGTDM routing protocol will be reducing 2 scanning process, scanning by authority and scanning by probability. The modification can be seen at the red circle part in Figure:
By reducing those scanning processes, so the process of calculate comprehensive forwarding weight of i and calculate probability proportion of node i will not be processed. We propose to reduce those scanning processes, because those processes consume a large amount of energy. We also consider the reducing process which are not really affecting to PDR, Average Latency, and Overhead Ratio compare to Epidemic and Prophet routing protocols.
4.
Simulation Parameters and Results
This simulation was made by comparing four routing algorithms there are Epidemic, Prophet, GTDM and new variant GTDM(NVGTDM). With 2 pieces of scenario that is the difference in node velocity and node density.
Table 1. Key Simulations Parameters
Parameter name Value
Word size 10000 ∗ 8000
Simulation time 12 Hours
City map Helsinki
Buffer size 5M
Message size 500 k–1M
Message creation interval 10–15 seconds
Message TTL 1433 seconds
Transmission range for
pedestrian 10m
Transmission range for the others (taxi, station, and bus)
nodes
100m
Movement model for pedestrian WDM
Movement model for taxi, bus Shortest path of map based,
bus movement model
Table 2. Key Parameters set to GTDM and NVGTDM
Parameter symbol
Value
𝐸
𝑖ini 400KmAh𝐸
𝑠,
𝐸
sr 1mAh/s𝐸
tr2mAh/s
Δ
𝐸
0.1
𝛼
,
𝛽
0.5
𝛾
0.98
V0
0.5The VDTN performance can be influenced by many factors such as the node density, node velocity, packet size, and buffer size. Generally speaking, the more nodes and faster nodes lead us to encounter more opportunities, and then the game times in the high node density and fast node velocity are more than the ones in the low node density and slow node velocity. So, we observe the GTDM performance under different density and different velocity.
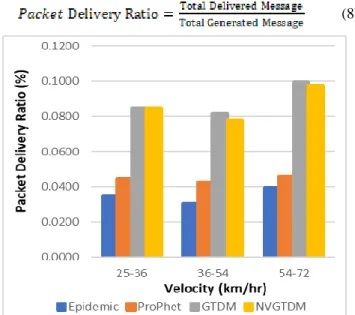
4.1 Packet Delivery Ratio (PDR)
At the first measurement to analyze the packet delivery ratio (PDR) is using three different range of velocity for the first scenario and three different number of nodes for the second scenario. The network has good performance if high the delivery probability. It means more messages are received in destination node. We calculate PDR following the formula below [21] :
(8)
Figure 4. PDR value due to Node Velocity
Figure 4 shows that NVGTDM and GTDM routing protocols have trade-off condition in all range of velocity. The NVGTDM routing protocols has the highest rates at the range of velocity 54-72 km/hr, but it is not better than GTDM. GTDM leads with the number 0,0993, while NVGTDM has 0,0974. In the range 36-54 km/hr, GTDM has also better performance than NVGTDM. At that range GTDM has 0,0815 for its number, while 0,0778 for NVGTDM. Conversely, the NVGTDM has better performance than GTDM at the range velocity 25-36 km/hr, with number 0,0845 for NVGTDM and 0,0843 for GTDM. Figure 5shows that NVGTDM and GTDM routing protocols have also trade-off condition in all different number of nodes. The NVGTDM routing protocols has the highest rates at the amount of 140 with number 0,0845. It is better than GTDM which only has 0,0843 in number. Conversely, the NVGTDM has worse performance than GTDM at the amount of node 118, with numbers 0,0533 for GTDM and 0,0511 for NVGTDM. When 167 nodes are involved in the network, the PDR number of NVGTDM and GTDM have the same rates with number 0,0742 each.
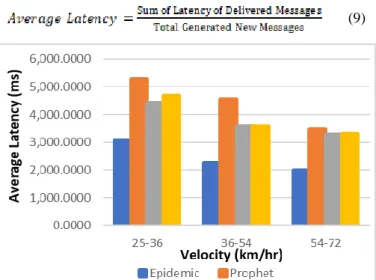
4.2 Average Latency
At the second measurement to analyse the average latency is using three different range of velocity for the first scenario and three different number of nodes for the second scenario. Opportunistic network has high latency average due to nature of its network. Network called good performance if less average latency. We calculate Average Latency following the formula below [21]:
(9)
Figure 6. Average Latency due to Node Velocity Figure 6shows that NVGTDM and GTDM routing protocols have trade-off condition in all range of velocity. The NVGTDM routing protocols has slightly differences in rates than GTDM at the range of velocity 36-54 km/hr and 54-72 km/hr. NVGTDM has better performance when the nodes move in speed of range 36-54 km/hr, because its number less than GTDM number. NVGTDM has 3.565,88 for its number and 3.576,33 for GTDM in this case.
Figure 7. Average Latency due to Node Density Figure 7 shows that NVGTDM and GTDM routing protocols have also trade-off condition in all different number of nodes. The NVGTDM routing protocols has slightly differences in rates than GTDM at the number of nodes 167. When the number of nodes are 140 and 167, NVGTDM has worse performance than GTDM. Conversely, NVGTDM has better performance than GTDM when 118 nodes are involved in the network. In that case, NVGTDM has 2.737,09 for its number, while GTDM has 2.851,72.
4.3 Overhead Ratio
At the third measurement to analyze the overhead ratio is also using three different range of velocity for the first scenario and three different number of nodes for the second
scenario. We calculate Overhead Ratio following the formula below [10]:
(10) Table 3. Overhead Ratio due to Node Velocity
Protocol
Node Velocity (km/hr)
TOTAL Average
25-36 36-54 54-72
Epidemic 242.2240 383.6697 354.8511 980.7448 326.9149
ProPhet 258.2390 321.7516 337.8970 917.8876 305.9625
GTDM 2.8841 2.2842 2.1685 7.3368 2.4456
NVGTDM 1.3696 1.1756 0.9427 3.4879 1.1626
Overhead ratio is metric used for estimating the extra messages are needed to know the actual messages are received. In other word, this metric shows how many redundant of messages are forwarded to deliver one message [21]. The good performance of the network if have less overhead ratio.
Table 3 shows that NVGTDM and GTDM routing protocols have low ratio than Epidemic and Prophet. Even NVGTDM and GTDM have very low ratio than Epidemic and prophet, but NVGTDM and GTDM have slightly differences. NVGTDM has lower ratio than GTDM in all range of velocity. It can be seen from its average value which NVGTDM has 1.1626, while GTDM has higher value with 2.4456 in numbers of ratio.
Table 4. Overhead Ratio due to Node Density
Protocol
Node Density
TOTAL Average
118 140 167
Epidemic 82.9801 242.2240 680.8633 1,006.0674 335.3558
ProPhet 58.2603 284.9487 651.8989 995.1079 331.7026
GTDM 1.7801 2.8841 3.3985 8.0627 2.6876
NVGTDM 1.8743 1.3696 1.4887 4.7326 1.5775
Table 4 shows that NVGTDM and GTDM routing protocols have lower ratio than Epidemic and Prophet. Even NVGTDM and GTDM have very low ratio than Epidemic and prophet, but NVGTDM and GTDM have slightly differences, moreover when either 140 nodes or 167 nodes are involved in the network. NVGTDM has lower ratio than GTDM in all number of nodes. It can be seen from its average value which NVGTDM has 1.5775, while GTDM has higher value with 2.6876 in numbers of ratio.
4.4 Energy Consumption
At the fourth measurement to analyze the energy consumption is using relay node group o which is represented for bus in our observation. The reason why we choose relay node group o to be presented in this paper is, relay node o has the most significant energy efficiency for NVGTDM than GTDM routing protocols.
Figure 8. Energy Consumption relay node O
GTDM is in the second position, followed by Epidemic at the third position, and Prophet at in the least position. It means that the network which uses NVGTDM routing protocols for its transmission packet mechanism is the best and suitable to be implemented. The value of energy consumption will present in Table 5
Table 5shows that the declining of the energy remaining of NVGTDM routing protocols has 3669 mAh or it is about 0,92% in every hour. Meanwhile, GTDM routing protocols has 3703 mAh or it is about 0,93% , Prophet has 3889 mAh or it is around 0,97%, and Epidemic 3829 mAh or it is about 0,96% in every hour.
Table 5. Energy Consumption Relay Node O Relay Node
o
Hours
1 2 3 4 5 6
Epidemic 396045,5 392174,3 388424,8 384735,8 381037,3 377256,5 ProPhet 396210,5 392267,8 388527,3 384771,8 381076,3 377246,5 GTDM 396312,5 392628,8 388974,3 385332,8 381690,8 378033 NVGTDM 396312,5 392628,8 388974,3 385335,3 381696,3 378052
7 8 9 10 11 12
Epidemic 373570,3 369828 365883,5 361914,3 357910,3 353917,8 ProPhet 373539,3 369814 365724,5 361672,3 357590,8 353429,3
GTDM 374376,8 370719 366950 363059,3 359294,3 355570,8
NVGTDM 374395,8 370738 366996 363298,3 359608,8 355951,8
From that comparison, it can be seen that energy consumption of NVGTDM routing protocol are the most efficient than GTDM, Epidemic, and Prophet routing protocols. It can be proved that NVGTDM routing protocol has 355951,8 mAh for its energy remaining after 12 hours simulation, while GTDM has 355570,8 mAh, Epidemic has 353917,8 mAh, and Prophet has 353917,8 mAh after 12 hours simulation.
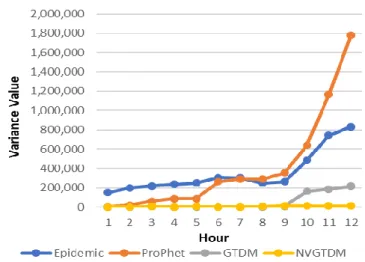
The energy consumption of using NVGTDM routing algorithm is not just more efficient, but it is also more stable than GTDM, Epidemic, and Prophet. It can be proved by calculating the variance of energy consumption itself. In order to verify the energy balance by GTDM, the energy sample variance with time lapse is calculated by [10]:
(11) Where (𝑥) represents the sample mean and 𝑥𝑖 is the energy sample value. A higher 𝑆2 value indicates higher energy gap in nodes, which could cause premature death of some nodes. Figure 9 shows that NVGTDM algorithm works well than GTDM in balancing energy consumption of mobile nodes by decreasing the quantity of failed nodes and prolonging the network lifetime. The variance of energy consumption will present in table 6.
Table 6 shows that the variance of energy sample NVGTDM is less than GTDM, Epidemic, and Prophet along the time simulation. There is no differences in the first 3 hours between NVGTDM and GTDM routing protocols, it means that both protocols consumed the same number of energy.
The differences will be felt in the next 4 hours until the end of simulation. From the fourth hour until the ninth hour, the energy sample variance of NVGTDM are higher than GTDM, it means that GTDM is more stable than NVGTDM. NVGTDM routing protocols will be more stable and balance in the next 10 hours of simulation until the end.
Table 6. Variance Energy Consumption Relay Node O Relay
Node o
Hours
1 2 3 4 5 6
Epidemic 150.876 200.153 217.692 235.948 250.292 303.343
ProPhet 2.032 20.545 62.206 86.447 88.506 260.338
GTDM 70 1.175 3.356 2.662 2.688 2.045
NVGTDM 70 1.175 3.356 3.029 3.531 3.083
7 8 9 10 11 12
Epidemic 300.491 249.177 260.807 484.414 743.668 831.204 ProPhet 291.982 287.329 353.450 637.949 1.165.782 1.782.236
GTDM 2.085 2.537 7.783 163.902 187.506 214.892
NVGTDM 3.187 3.575 13.813 12.297 12.650 12.064
5.
Conclusions
It can be proved that NVGTDM routing protocols are more efficient than GTDM routing protocols in energy consumption. It is caused by reducing two scanning process, scanning by authority and scanning by probability. By reducing those scanning process, so the process of calculate comprehensive forwarding weight of i and calculate probability proportion of node i will not be processed. NVGTDM routing protocol has better performance than GTDM in energy consumption as much as 10,38%, but fluctuated in overhead ratio which has average value as much as 2,57 for GTDM and 1,37 for NVGTDM in both scenarios, average latency has average value as much as 3709,12 for GTDM and 3778,69 for NVGTDM in both scenarios, and PDR has average value as much as 0,08 for GTDM and NVGTDM in both scenarios. Increasing Node Velocity is proportional with PDR, but it is inversely proportional with Average Latency and Overhead Ratio. Those conditions are happening among all routing protocols. Meanwhile, Increasing Node Density improves PDR and Overhead Ratio. The energy efficiency of NVGTDM routing protocol will be felt after three hours of simulation. It is caused the NVGTDM and the GTDM mechanism are involving several parametric which are affecting to the way how the nodes interact with other nodes in the network.
References
[1] C. Jing, L. Ren, and D. Gu, “Geographical routing for
WSN of street lighting monitoring and control system,” in Proceedings of the International Conference on Computer Design and Applications (ICCDA ’10), pp. V3235–V3238, IEEE, Qinhuangdao, China, June 2010.
[2] G. Cardone, P. Bellavista, A. Corradi, and L. Foschini, “Effective collaborative monitoring in smart cities: converging MANET andWSN for fast data collection,” in Proceedings of the 4th ITU KaleidoscopeAcademic Conference:The FullyNetworkedHuman Innovations for Future Networks and Services (K ’11), pp. 1–8, December 2011.
[3] T. Watteyne and K. S. J. Pister, “Smarter cities through standards-based wireless sensor networks,” IBMJournal of Research and Development, vol. 55, pp. 7:1–7:10, 2011.
[4] H. Chourabi, T. Nam, S. Walker et al., “Understanding smart cities: an integrative framework,” in Proceedings of the 45th Hawaii International Conference on SystemSciences (HICSS ’12), pp. 2289–2297, January 2012.
[5] Z. Lu and J. Fan, “Delay/disruption tolerant network
and its application in military communications,” in Proceedings of the International Conference on Computer Design and Applications (ICCDA ’10), pp. V5-231–V5-234, Qinhuangdao, China, June 2010.
[6] D. Wang, F. Hong, B. Yang, Y. Zhang, and Z. Guo, “Analysis on communication capability of vessel-based ocean monitoring delay tolerant networks,” in Proceedings of the IEEE Wireless Communications and Networking Conference Workshops (WCNCW ’13), pp. 200–204, IEEE, April 2013.
[7] J.Wyatt, S. Burleigh, R. Jones, L. Torgerson, and S.Wissler, “Disruption tolerant networking flight validation experiment on NASA’s EPOXI mission,” in Proceedings of the 1st International Conference on Advances in Satellite and Space Communications (SPACOMM ’09), pp. 187–196, IEEE, July 2009.
[8] Liu Hui. A Novel QoS Routing Algorithm in Wireless Mesh Networks. TELKOMNIKA Indonesian Journal of Electrical Engineering. 2013; 11(3): 1652-1664.
[9] Wang En, Yang YongJian, Chen Xi, Wu FangMing. DTN Routing Algorithm based on Perceptions of Node Mobile Information. TELKOMNIKA Indonesian Journal of Electrical Engineering. 2013; 11(8): 4491-4497.
[10] Li. Wenzao, Lin. Feng, Zhou. Jiliu, Wang. Yan, 2015, “GTDM : A DTN Routing on Noncooperative Game Theory in a City Environment”, Hindawi Publishing Corporation, March 2015.
[11] Rodrigues, J.J.P.C.,2015, Woodhead Publishing Series in Electronic and Optical Materials: Number 67 A dvances in Delay-tolerant Networks (DTNs) Architecture and Enhanced
[12] L. Sundararaj and P. Vellaiyan, “Delay tolerant
networking routing as a game theory problem—an overview,” International Journal of Computer Networks, vol. 2, no. 3, pp. 152–172, 2010.
[14] R. Machado and S. A. Tekinay, “A survey of
game-theoretic approaches in wireless sensor networks,” Computer Networks, vol. 52, no. 16, pp. 3047–3061, 2008.
[15] H.-Y. Shi, W.-L. Wang, N.-M. Kwok, and S.-Y. Chen, “Game theory for wireless sensor networks: a survey,” Sensors, vol. 12, no. 7, pp. 9055–9097, 2012.
[16] R. El-Azouzi, H. B. Sidi, J. Rojas-Mora, and A. P. Azad, “Delay tolerant networks in partially overlapped networks: a noncooperative game approach,” in Bioinspired Models of Network, Information, and Computing Systems, vol. 39 of Lecture Notes of the Institute for Computer Sciences, Social Informatics and Telecommunications Engineering, pp. 195–202, Springer, Berlin, Germany, 2010.
[17] M. R. Schurgot, C. Comaniciu, and K. Jaffr`es-Runser, “Beyond traditional DTN routing: social networks for opportunistic communication,” IEEE Communications Magazine, vol. 50, no. 7, pp. 155– 162, 2012.
[18] S. Bharathi, D. Kempe, and M. Salek, “Competitive
influence maximization in social networks,” in Internet and Network Economics, vol. 4858 of Lecture Notes in Computer Science, pp. 306–311, Springer, Berlin, Germany, 2007.
[19] W Haiquan , M Weijian, S Hengkun, X Chunhe. An Interval Algebra-based Modeling and Routing Method in Bus Delay Tolerant Network. . KSII Transactions on Internet and Information Systems (TIIS). 2015; 9(4): 1976-7277.
[20] O Kaiwartya, S Prakash, A H Abdullah, A N Hassan. Minimizing Energy Consumption in Scheduling of Dependent Tasks using Genetic Algorithm in Computational Grid. KSII Transactions on Internet and Information Systems (TIIS). 2015; 9(8): 1976-7277.
![Figure 1. DTN Layers and VDTN Layers [11]](https://thumb-us.123doks.com/thumbv2/123dok_us/8122511.2154370/1.892.467.836.559.763/figure-dtn-layers-and-vdtn-layers.webp)