Analysis of the Latin American west coast rainfall predictability using an
ENSO index
LUIS CID-SERRANO
Departamento de Estadística, Universidad del Bío-Bío, Concepción, Chile Corresponding autor: [email protected]
SANDRA M. RAMÍREZ
versidad Javeriana Seccional Cali, Cali, Colombia
ERIC J. ALFARO
Center for Geophysical Research, School of Physics and Center for Research in Marine Sciences and Limnology, University of Costa Rica, San José, Costa Rica
DAVID B. ENFIELD
Cooperative Institute for Atmospheric and Marine Studies, University of Miami, Miami, FL, USA
Received November 12, 2013; accepted June 12, 2014
RESUMEN
El objetivo de este estudio es determinar la probabilidad de ocurrencia de estaciones lluviosas o secas a lo
asociación entre el fenómeno El Niño-Oscilación del Sur (ENOS) y la precipitación a lo largo de la región indicada. El análisis se realizó mediante modelos de regresión lineal multinomial y de regresión logística -torial (SST) y el Índice de Oscilación del Sur (SOI) para la presión atmosférica a nivel del mar. Las anomalías de lluvia corresponden a series de tiempo sobre una retícula de 2.5 × 2.5º grados, a lo largo de la costa oeste de América Central y América del Sur desde 25ºN hasta 45º
ENOS que se usó como predictor y la lluvia como respuesta. Los datos se agruparon en trimestres y luego se categorizaron en terciles para construir tablas de contingencia no simétricas de 3 × 3. Como resultado, se
las distintas fases de ENOS.
ABSTRACT
The objective of this study was to determine the probability of occurrence of wet or dry season events, by -fall along the west coast of Central and South America. The analysis was performed using multinomial linear
surface temperature (SST), the Niño 3.4 index, a sea level pressure index (SOI) and rainfall anomalies over a 2.5 × 2.5º grid along the west coast of Central and South America, for latitudes starting at 25ºN through 45º
was grouped into seasons and then categorized into terciles to construct 3 × 3 non-symmetrical three way
for the west coast of Central and South America, using the ENSO phases as predictor.
Keywords: El Niño, logit regression, rainfall, ENSO.
© 2015 Universidad Nacional Autónoma de México, Centro de Ciencias de la Atmósfera.
1. Introduction
Interest in useful climate predictions for various regions of the Americas has developed substantial-ly over the past two decades given its recognized impacts in socioeconomic and geological issues, as well as in ecosystems (Katz and Murphy, 2000; Viles and Goudie, 2003). Over recent decades, efforts have increased toward improving forecast techniques for seasonal climate (Goddard et al., 2001).
In dealing with the ocean/atmosphere interactions of El Niño-Southern Oscillation (ENSO), most statis-tical forecasting studies focus on time series modeling
and/or spatial fields for predicting the time of arrival
and strength of an event. Time series modeling is
done by fitting univariate or multivariate auto regres -sive moving average models (ARMA) to the target variable data (Box et al., 1994; Alfaro and Cid, 1999; Alfaro and Soley, 2001) in the time domain, Fouri-er-derived methods for the frequency domain, and neural networks (Goddard et al., 2001). The spatial
fields approach is done by using multivariate tech -niques such as principal components or derivations thereof (Zwiers and von Storch, 2004; Maldonado et al., 2013). However, common practice has shown that in many cases the primary interest is not to measure the exact magnitude of an ENSO associated event, but simply to assess the “chances of occurrence” of events such as El Niño or La Niña. In that case, the main interest is to determine if a given year will or will not be an El Niño or La Niña year instead of predicting its strength or timing. Consequently, one could be interested in knowing if, given an El Niño
or La Niña event, a specific season (winter, spring,
etc.) will be dry or wet.
At present we have some deterministic prediction
ability, although the spring barrier effect (significant
prediction failures between lead times of six to 12 months) limits the predictability of warm/cool
anom-alous temperatures in the equatorial Pacific (Latif
et al., 1998). We know from statistical analysis that ENSO is related to these “warm/cool events” and that they are also associated with climate anomalies around the globe (e.g., Ropelewski and Halpert, 1987, 1989), allowing us to make qualitative statements about expected climate effects given a warming (or cooling) event. But this is not nearly good enough.
The economic and social sectors (agriculture, fish -eries, health, etc.) need more concrete information
(Katz and Murphy, 1997). A farmer needs specifically
to know if a given year will be “dry” or “wet” to plan
his crops and fishermen need to know if a warm or cool event will affect the fisheries. However, the
occurrence of an ENSO event is no guarantee of a given impact because these “teleconnected” conse-quences—good or bad—do not always materialize. The deleterious effect of a false positive, normally called false alarm, which results when the expected teleconnection does not occur, may be worse than the direct effects when it does occur and was not expect-ed. Because observations and models usually warn us when an ENSO event is imminent or beginning, one strategy is to assume the El Niño or La Niña event as given, and to project probabilities for
far-field climatic and societal impacts around the globe
based on the observed history (“hits” or “misses”) of such impacts. When an educated public or economic sector is informed of the relative likelihood of a con-sequence, contingency plans can be made for either possibility (García and Ramírez, 2012).
1.1 The ocean-atmosphere interaction perspective Many studies have been conducted over the last two decades linking climatic variability and ENSO,
fo-cusing on the tropical Pacific and its interactions with the atmosphere (e.g, Philander, 1990; McCreary and
Anderson, 1991; Weisberg and Wang, 1997; Goddard et al., 2001; Lee et al., 2010, 2013). According to Rassmusson (1985) these large-scale interactions between ocean and atmosphere over the tropical
Pacific can greatly influence the weather patterns
around the world.
Many of these investigations have been undertak-en through the study of ocean-atmosphere indices, such as the Southern Oscillation Index (SOI), the difference in atmospheric pressure between Tahiti and Darwin, or the El Niño indexes based on sea surface
temperature (SST) (Enfield 1989; Enfield and Mayer,
1997). The statistical modeling of ocean-atmosphere interaction from a perspective of discrete possibilities implies a completely different approach vis-à-vis the traditional models based on a time domain approach, in which only continuous time series are modeled according to their auto-correlative structure, in the simpler case, or using cross-covariance arrays in the case of multivariate analyses.
Mason and Mimmack (2002) compared different statistical techniques, including logit models, for predicting ENSO, but did not investigate the strength of the method for associating ENSO events and their worldwide climatic impact. Akin to the idea of the present paper and therefore its
precur-sors, Enfield et al. (1999) used contingency tables to establish the relationships between extreme dipole
configurations of the tropical Atlantic SST, using the
north and south areas (NA and SA, respectively) of the intertropical convergence zone (ITCZ) for a 136-year period, recording the occurrence frequencies for which these indexes fall into their respective quartile ranges, and then comparing them against the frequencies expected by chance. This analysis
concluded that such dipole configurations are due
only to chance, the NA and SA classes being sto-chastically independent.
The main purpose of this study is to introduce the analysis of contingency tables into the study of the relationships between the variables most commonly used to evaluate ocean-atmosphere interaction, such as the Southern Oscillation Index (SOI) or equato-rial SST-related time series indices (e.g., Niño 3 or Niño 3.4) and the distribution of rainfall along the west coast of South America, using rainfall data for latitudes between 22.5ºN and 45ºS. We expect to establish the usefulness and practical need of this analytic tool, which will provide a simple quantitative measure of rainfall modulation by ENSO within the framework of the terciles categorization. Finally, an advantage of this method is that it gives the results in terms of probabilities for the different terciles, which is the most common output of the actual Regional Climate Outlook Forums in Latin America (e.g., IRI, 2001; García and Ramírez, 2012).
2. Data and methods
Monthly sea surface temperature (SST), sea level
pressure (SLP) anomalies (SOI) and rain data for dif
-ferent latitudes were classified into three categories. This classification was then converted into
three-way non-symmetric contingency tables, including a predictor and a response variable (Lauro and Balbi, 1999). Using predictive generalized linear models (Agresti, 2002) we estimated the odds of classifying a
single event in each of the three predefined categories,
based on the marginal probability distribution of a number of the “predictive” processes.
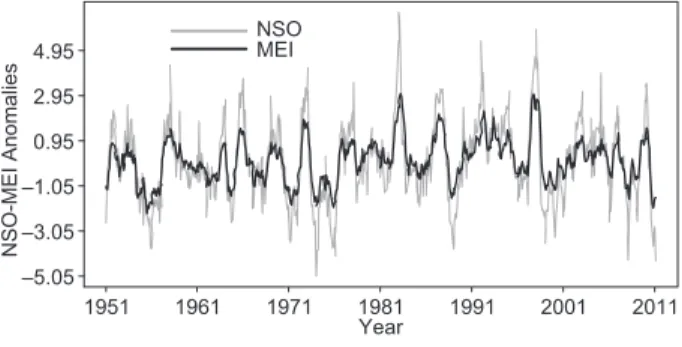
To construct contingency tables for evaluating the relationship between rainfall and the warm/neutral/ cool events, we considered monthly time series from 1951 through 2011 for the Southern Oscillation Index (SOI) and for equatorial SST represented by the series Niño 3.4 (N34, monthly SST averaged over 5º N-5º S and 150-160º W). We summarized both into an index that we call Niño Southern Oscillation or hereafter NSO (to distinguish it from the conventional ENSO acronyms), which considers both the atmospheric and oceanic contributions of the coupled phenomena. NSO
is defined as the difference N34-SOI of standardized
contemporaneous monthly values. The purpose of this index is to focus the analysis on the events in which there is a coupling between the atmosphere and the ocean. The relationships between ENSO events and the NSO index are clear, since during the warm (cool) phase of ENSO, SST has positive (negative) anomalies and SOI has negative (positive) anomalies, so that the NSO has its maximum (minima) for El Niño (La Niña) events. As such, the NSO index has the advantage of summarizing in a more simple and straightforward manner the information given by both indices. When NSO is compared, for example, with Wolter’s MEI index (Wolter, 1987; Wolter and Timlin, 1993) a good correspondence is found (Fig. 1). The NSO index emphasizes extreme events, which helps in the differentiation of terciles for this analysis.
The NSO time series was then summarized into seasons, taking the standard average of three months (DJF, MAM, JJA or SON) as a way to reduce the noise and the autocorrelation of contiguous obser-vations, and associated with boreal (austral) winter (summer), spring (autumn), summer (winter), and autumn (spring). All the analyses were performed independently for each season.
1951 1961 1971 1981 1991 2001 2011
–5.05 –3.05 –1.05 0.95 2.95 4.95
Year
NSO-MEI Anomalie
s
NSO MEI
Monthly rainfall (R) data were obtained from
the National Centers for Environmental Prediction (NCEP) of the National Oceanic and Atmospheric
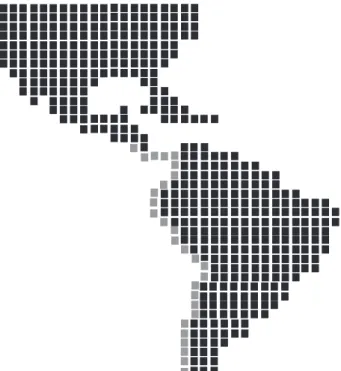
Administration (NOAA), corresponding to the anomalies of worldwide rainfall measures over a 2.5 × 2.5º latitude-longitude grid from 1951 to 2011 (Chen et al., 2002). From the database we selected 28 grid points located along the west coast of South America from 25º N through 45º S (Fig. 2). Chen et al. (2002) describe that their global analyses are
defined by interpolation of gauge observations over
land. Their analyses are derived from gauge obser-vations from over 17 000 stations collected in the Global Historical Climatology Network (GHCN), v. 2, and the Climate Anomaly Monitoring System (CAMS) datasets. To determine the most suitable objective analysis procedure for gridding, the anal-yses generated by four published objective analysis techniques (those of Cressman, Barnes, and Shep-ard, and the optimal interpolation [OI] method of Gandin) were compared. Based on their results, the OI technique was used to create monthly gridded analyses of precipitation over the global land areas. In addition, the mean distribution and annual cycle of precipitation observed in their data set showed good agreement with those in several published
gauge-based datasets, and the anomaly patterns associated with ENSO resemble those found in previous studies (Chen et al., 2002).
Rainfall data were also summarized into seasons as indicated above, so we obtained 61 data points for each season along the 28 different grid point latitudes for the west coast of South America. However, due to the scarce rainfall over the Atacama Desert in Chile, the corresponding two grid points were not included in the analysis.
2.1 Contingency tables
Consider two categorical variables X and Y, with I and J categories, respectively, where Y is the dependent variable and X the predictive variable. These variables generate a two-way contingency table of order I × J.
For the purpose of this study, we define a two-way
(R × NSO) contingency table of order 3 × 3. The column and row of the table are divided into three
classes, each of them defined by the corresponding
tercile of their distribution. Data in the upper tercile of R correspond to wet periods and those in the
first tercile to dry periods. For NSO, the first tercile defines the cool events for SST (La Niña) and the third defines the warm events (El Niño). The cell (i,j) corresponds to the i-th tercile of the NSO and the j-th tercile of the response R. Normally the categories in the second tercile are called neutral.
For the statistical analysis of the contingency tables we used generalized linear models, which is a common statistical methodology to study how the cell counts are related to the levels of the categorical variables (Agresti, 2002), analyzing the association and interaction patterns between the variables, and the response is multinomial for variables categorized
into ordinal classes. We also fit multinomial response
logit regression models when the predictors were used in their original continuous expression.
2.2 Interpretation of response probabilities
Table I shows the probabilities Pij associated with
each cell, to be estimated through the logit model.
In this table, the probability Pij corresponds to the
probability of any given trimester to be classified into
the (i,j) cell of the contingency table, in the absence of any expectation for ENSO.
Pij probabilities can be interpreted as follows:
P11 is the probability that the first tercile of NSO
induces rainfall in the first tercile of the rainfall
distribution, so it measures the association of cool events and dry years.
P13 is the probability that the first tercile of NSO induces rainfall in the third tercile of the rainfall distribution, so it measures the association of cool events and wet years.
P31 is the probability that the third tercile of NSO
induces rainfall in the first tercile of the rainfall
distribution, so it measures the association of warm events and dry years.
P33 is the probability that the third tercile of NSO induces rainfall in the third tercile of the rainfall distribution, so it measures the association of warm events and wet years. We expect this probability as
well as P11 , to be higher than 1/3.
P21, P22, P23, P12 and P32 are the probabilities for the central terciles that are supposed to be determined by the climatology, i.e. they will be always close to 1/3.
Logit models were fit to estimate the expected
values for the cells of the contingency tables, when
one of the classifications is used as causal and the
other as dependent. In this study, we used the NSO index as causal and rainfall as the response variable. According to Wilks (2011), systems for producing probability forecasts are developed in a regression
setting by first transforming the predictand to a bi -nary (or dummy) variable, taking on the values zero and one. In a sense, zero and one can be viewed as probabilities of the dichotomous event not occurring or occurring, respectively, after it has been observed.
3. Results and discussion
Although most of our results are very consistent with the physical models for rain patterns in the region, it is likely that some of the results present some local discrepancies. This is probably due to
the fact that, given the size of the cells (2.5 × 2.5º), in some regions located from the coast to the Andes mountains—which present different climates—the enclosed area comprises heterogeneous rain patterns. We also include areas with very scarce rainfall—just a few millimeters/year—such as the Atacama Desert in Chile. In those cases, a small amount of rainfall could result in large deviations from de mean, with large variances.
3.1 Contingency tables
Below, we will analyze the results of the response to logit models, which will associate an event (cool, neutral, warm) to a rainfall situation (dry, neutral, wet). The association between warm and cool events and dry and wet phases will be emphasized, unlike the association between or with neutral phases, which is less pertinent. Therefore, we will mostly investigate the direct relationships, dry,
cool-wet, warm-dry, and warm-wet (the P11, P13, P31 and
P33 probabilities, respectively), i.e. the corners of the contingence tables.
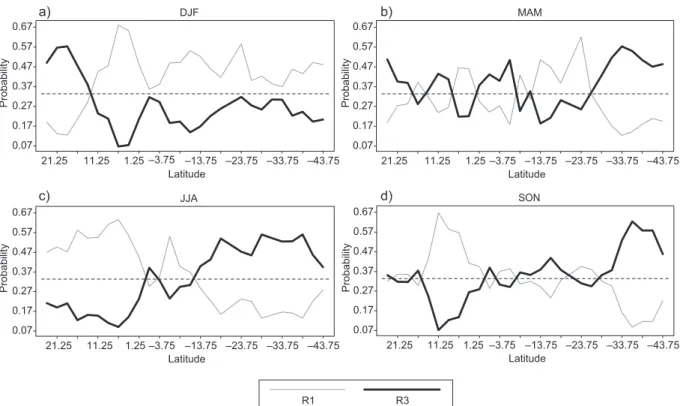
Analyses by season are shown in Figs. 3 and 4. We consider that events with probabilities along the 0.333 line are not predictable, events associated with values below the 0.333 line are less probable, and values well above this line represent the most likely events.
For the boreal winter (austral summer), Figure 3a shows that from 22.5 to 13 ºN, the most likely associ-ation during La Niña is R1|NSO1, which corresponds to cool-dry associations, while from Costa Rica through south Chile, it corresponds to a cool-wet
condition, which is particularly true for Panama and
Colombia. For most latitudes, El Niño is R3|NSO3, which corresponds to warm-wet associations (Fig. 4a) except for the coast of Mexico, Guatemala and El Salvador, dominated by warm-dry conditions.
The results of Figures 3a and 4a are consistent with the following previous studies. During the warm (cool) phases of ENSO, an increase in the occurrence of cold outbreaks or cold fronts is observed in the
north Pacific coast of Mexico, associated with more
(less) precipitation in that region (Magaña et al., 1999a). Gershunov and Barnett (1998) observed and added that typical El Niño patterns (e.g., low pressure
over the northeastern Pacific, dry northwest, and wet
southwest, etc., in North America) are strong and consistent only during the high phase of the North
Pacific Oscillation (NPO), which is associated with
Table I. 3 × 3 contingency table for the rainfall (R) as response and the NSO index as predictor. Rows and
columns correspond to the terciles of the series, Pij is the
probability that a given observation, being classified in
the row i of the predictor, is classified into the column j
of the response.
Rainfall terciles
NSO Terciles R1 R2 R3
NSO1 P11 P12 P13
NSO2 P21 P22 P23
21.25 11.25 1.25 –8.75 –18.75 –28.75 –38.75 0.07
0.17 0.27 0.37 0.47 0.57 0.67
a) b)
c) d)
DJF
Latitude
Probabilit
y
21.25 11.25 1.25 –8.75 –18.75 –28.75 –38.75 0.07
0.17 0.27 0.37 0.47 0.57 0.67
MAM
Latitude
Probabilit
y
21.25 11.25 1.25 –8.75 –18.75 –28.75 –38.75 0.07
0.17 0.27 0.37 0.47 0.57 0.67
R1 R3
JJA
Latitude
Probabilit
y
21.25 11.25 1.25 –8.75 –18.75 –28.75 –38.75 0.07
0.17 0.27 0.37 0.47 0.57 0.67
SON
Latitude
Probabilit
y
Fig. 3. Latitudinal profiles of conditional probabilities for each tercile of rain, given the first tercile of NSO (cool
phase of ENSO-NSO1).
21.25 11.25 1.25 –3.75 –13.75 –23.75 –33.75 –43.75 0.07
0.17 0.27 0.37 0.47 0.57 0.67
Latitude
Probabilit
y
DJF
a) b)
c) d)
21.25 11.25 1.25 –3.75 –13.75 –23.75 –33.75 –43.75 0.07
0.17 0.27 0.37 0.47 0.57 0.67
Latitude
Probabilit
y
MAM
21.25 11.25 1.25 –3.75 –13.75 –23.75 –33.75 –43.75 0.07
0.17 0.27 0.37 0.47 0.57 0.67
Latitude
Probabilit
y
JJA
21.25 11.25 1.25 –3.75 –13.75 –23.75 –33.75 –43.75 0.07
0.17 0.27 0.37 0.47 0.57 0.67
Latitude
Probabilit
y
SON
R1 R3
Fig. 4. Latitudinal profiles of conditional probabilities for each tercile of rain, given the third tercile of NSO (warm
an anomalously cold northwestern Pacific. The SLP
and precipitation patterns during La Niña winters
are consistent only during the low NPO phase. They
also explain that a deeper Aleutian low shifts the storm track southward while El Niño provides an
enhanced eastern tropical Pacific moisture source
for the storms. Alternatively, a weaker Aleutian low
during the low phase of the NPO paired with La
Niña steers cyclonic storms farther north, increasing precipitation in the northwest while the less frequent storms passing over the southwestern United States tend to be drier than normal because less moisture
is available from the eastern tropical Pacific. This
paradigm is also observed with precipitation anom-alies in the western United States. Over Central America, results of Figures 3a and 4a are consistent with Amador (2008), who found that the Caribbean low level jet (CLLJ) core is weaker (stronger) than normal during warm (cold) ENSO phases in winter. It means that zonal easterlies decrease (increase) over the isthmus, increasing (decreasing) the precipitation
over the Pacific slope by two mechanisms, decreasing
(increasing) the Foehn effect (Oliver, 2005) and en-hancing (reducing) the mesoscale system formation
over that slope. Drier summers over most of Peru and
Chile have been associated over most of the last 60 years with cool situations in the ENSO index, and abnormal wetter summers in central Chile have been associated with warm situations in the ENSO index.
For the austral autumn (boreal spring), figures 3b
and 4b show the predicted probabilities for rain ter-ciles given the cool and warm phases of ENSO. Note that for this season, the patterns are irregular, and only few regions show a noticeable association, except for central-south Chile, which shows a strong wet-cool and wet-warm association. For the north coast of Mexico, this season could replicate the same expla-nations given by Gershunov and Barnett (1998) and Magaña et al. (1999a), meaning that during the warm (cool) phases of ENSO, an increase in the occurrences of cold outbreaks or cold fronts is observed in that region, associated with more (less) precipitation. For Central America, this is the season associated with the
beginning and first peak of the rainy season (Taylor
and Alfaro, 2005). Rainfall in this region is mainly dominated by deep cumulonimbus formations and the northward migration of the intertropical convergence
zone (ITCZ). Philander (1990) describes that this
migration is delayed (favored) during warm (cool)
ENSO phases. This situation could inhibit (potenti-ate) the deep convection, resulting in drier (wetter)
conditions in the Central American Pacific slope.
From this it can be inferred that during the MAM trimester, we cannot clearly discriminate the effect of the warm and cool phases of ENSO over rainfall, except in the zones above described. In addition, it
could reflect the influence of other climate variability
sources that obscure or potentiate the ENSO signal.
For example, Enfield and Alfaro (1999), Giannini et al. (2000), Taylor et al. (2002) and Gouirand et al. (2013) observed that during this season the Caribbean
and Central America are highly influenced by the
tropical North Atlantic variability.
For the austral winter (boreal summer), Figures 3c and 4c show the predicted probabilities for rain terciles given the cool and warm phases of ENSO. For this season, except for 2º N-14º S, there exists a very clear pattern of association. Figure 3c shows that in the region from 22.5 to 5º N, there is a clear wet-cool association, while from 15 through 45º S, there is a dry-cool association. The opposite associ-ation—i.e., dry-warm and wet-warm—is evident for the same regions, respectively, as shown in Figure 4c. The result for 22.5-5º N agrees with the work of Magaña et al. (1999b), who showed drier (wetter)
conditions along the Pacific coast of Mexico and
Central America during warm (cool) ENSO phases. Such a relationship is very important because the midsummer drought (Magaña et al., 1999b; Kar-nauskas et al., 2013) is observed in Mesoamerica during July-August as a reduction in rains in the
eastern tropical Pacific. As for the MAM season,
Magaña et al. (1999a) explained that this could be due to a southern (northern) position of the ITCZ during the warm (cool) ENSO phases. In addition, Amador (2008) explained that in contrast to winter conditions, the CLLJ core is stronger (weaker) than normal during warm (cold) ENSO phases in summer, meaning that zonal easterlies increase (decrease) over Mesoamerica, decreasing (increasing) the
precipita-tion over the Pacific slope by the two mechanisms
already mentioned for winter.
the ENSO index increases with latitude, particularly in central Chile, where it reaches its highest value at roughly 38º S. For most of central Chile, wetter than normal conditions are associated with warm situations. The opposite can be concluded for some latitudes in the Northern Hemisphere (Figs. 3c and 4c), where wetter situations are found for the cool phase of El Niño.
Since drier conditions are associated with cool events (more than 1/3), there are high probabilities of a dry situation occurring in most of central Chile in presence of a cool event. The analysis performed here does not preclude a warm-dry association at
specific latitudes. Elsewhere, from Ecuador to most of Peru (1-10º S), wetter-drier than normal winters are associated particularly to cool-warm events.
In-stead, for most of southern Peru and northern Chile
the warm-wet and cool-dry association dominates, although less strong than for central Chile.
Predicted probabilities for rain terciles given
the cool and warm phases of ENSO for the austral spring (boreal autumn) are shown in Figures 3d and 4d, where we can observe the same patterns than for the JJA term, except for narrower regions. In fact, Figures 3d and 4d show two regions, one for 22.5 to 10 ºN, plus a wider region, 5º N to 30 ºS), with no clear predominance of an association between NSO and rainfall, while for Ecuador there is a clear wet-cool association and for central-south Chile the association is wet-cool (Fig. 3d). Figure 4d shows strong dry-warm and wet-warm conditions for the same regions, respectively.
The analysis of austral spring on Figures 3d and 4d shows the latitudes for which the probabilities of cool-dry and wet-dry association reach their maxi-mum (i.e., Costa Rica through Colombia) and those for which the cool-wet and warm-wet associations are maximum (central-south Chile).
During this season, which correspond to boreal
autumn, the Pacific slope of Central America presents
the second peak of the rainy season, when most of the extreme events are observed, especially during September-October. Results of Figures 3d and 4d show that in Central America, when equatorial
east-ern Pacific SST anomalies tend to be warmer (cooler),
the precipitation response over land tends to be
asso-ciated with drier (wetter) anomalies over the Pacific slope, consistent with the results of Enfield and Alfaro
(1999) and with the results for rainfall anomalies and
extreme events of Maldonado et al. (2013). Enfield
and Alfaro (1999) noticed that the end of the rainy season in lower Central America tends to be delayed
when the eastern equatorial Pacific is cool at the end
of autumn. This means that zonal easterlies increase (decrease) over the isthmus, reducing (enhancing) the mesoscale system formation over that slope. During this trimester, the Atlantic Ocean shows also its peak in tropical cyclone occurrences near Central
America, which are the main cause of floods asso -ciated with the so-called “indirect effect” of a low pressure system located either in the Caribbean Sea
or in the Central America Pacific slope (Peña and
Douglas, 2002). However, warm (cool) ENSO phases reduce (increase) the occurrence of cyclones in the Caribbean Sea increasing (reducing) the wind shear over the basin (Gray, 1984), which is also consistent with Figures 3d and 4d.
Amador (2008) describes that near the South American coasts (north of the equator) the southerly trade wind regime becomes westerly, except during February, due to a change of sign of the Coriolis force and to the land-sea temperature gradient, among other factors. In western Colombia near 5º N these winds form a low-level westerly jet, the Chocó jet (CJ) (October–November). At lower levels, warm air and moisture convergence associated with the CJ, low surface pressure, and topographically induced vertical motion on the western Andes contribute to deep convective activity organized as mesoscale con-vective complexes. Amador (2008) adds that during cold (warm) ENSO phases, the boreal autumn CJ shows stronger (weaker) than normal wind speeds, enhancing (diminishing) precipitation in that region, which is consistent with Figures 3d and 4d.
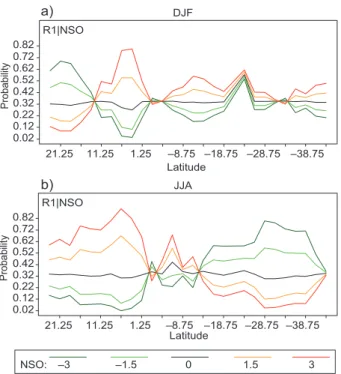
Similar results were found when applying re-gression models with multinomial response, and using the NSO index as independent variable in its
continuous form. We used five different values of
NSO, namely –3, –1.5, 0. 1.5 and 3.0. Some of the
results, which confirm the results of the contingency
table analysis, are shown in Figure 5. Figure 5a shows
the latitudinal probability of dry season profiles for the austral summer season, given five different val -ues of the NSO index, and the results for extreme values of NSO (NSO1 and NSO3). Figure 5b shows
the latitudinal probability of dry season profiles for the austral spring season given five different values
Interestingly, the highest correlation found be-tween the ENSO index and rainfall in central Chile is related to the spring season roughly between 35 and 40º S (Fig. 5b). There, the seasonal warm-wet and cool-dry association is particularly clear and meaningful. Therefore, if a warm-cool ENSO relat-ed variability takes place, most probably during the following autumn, rainfall must experience a wet-ter-drier than normal situation. Ecuador experiences
also the same situation, whereas central Peru appears
to be slightly dominated by a cool-wet association.
Elsewhere, from southern Peru to most of northern
Chile the association is irregular, which is probably
meaningful for local or other remote influences.
Figure 5a shows that for DJF, which correspond to
austral summer, the highest probabilities are for P11 andP33 for the region of Arica through Valdivia, in Chile, indicating a strong association between the warm-cool events and rainfall in the region.
Considering the probabilities of association be-tween warm-cool events in an ENSO index as given by a logit model and dry and wet situations as given by monthly rainfall data over most of the western side of South America (from southern Ecuador to
southern Chile), categorized into seasonal values, we can conclude based in the analysis of the last 60 years that there are high probabilities that warm and cool events within the ENSO variability may give rise to drier and wetter than normal situations in Chile, particularly along the central region. Interestingly, the best probabilities of association (in central Chile) are given equally for both cause-effect relationships in the autumn season. The spring season appears to be dominated by a cool-dry situation and the winter season by a warm-wet situation, even if in both cases the other direct association (respectively warm-wet and cool-dry) is also meaningful though less intense. It is of particular interest for agriculture that there are much higher probabilities of a cool event in ENSO being followed or accompanied by a dry season than by a neutral or wet season. Summer presents interest-ing differences with the other three seasons, which are of particular interest for the tourism sector (and for any person interested in sunny summers), wetter than normal summer seasons will be most probably associated to cool events in ENSO. Instead, drier than normal summer seasons are associated to warm
events along the tropical Pacific.
The relationships along northern Chile and the desert are most probably contaminated by noise due to scarce pluviometry therein, although a warm-wet association in winter is illustrative of the rare rain-fall occurrences after a very strong El Niño event. However, results for latitudes associated with desert regions need to be more carefully analyzed. In fact, since there are only a few rain episodes and the amount of precipitation is very small, anomalies could be rather large, i.e. the distribution could be highly skewed and rainfall accumulation over the
period may not differ significantly from the common
observed values.
The probabilities of association found for
Ecua-dor and Peru are also very interesting. For EcuaEcua-dor,
represented here only by two grid points, the yearly average association interestingly resembles that observed along central Chile. Warm conditions in ENSO will be most probably associated with wetter than normal rainfall and cool conditions with drier ones. It appears that all seasons show the same pattern favoring the strong cool-dry and warm-wet association, but excluding the winter season, when
no association is favored. For central Peru the
cool-wet and warm-dry relationship appears to dominate Fig. 5. Latitudinal profiles of conditional probabilities
for DJF and JJA, given five different values of NSO from
the cool to dry phase of ENSO for austral spring (boreal autumn), estimated through a multinomial response re-gression model.
21.25 11.25 1.25 –8.75 –18.75 –28.75 –38.75 0.02
0.12 0.22 0.32 0.42 0.52 0.62 0.72 0.82
Latitude
Probability
R1|NSO
DJF
21.25 11.25 1.25 –8.75 –18.75 –28.75 –38.75 0.02
0.12 0.22 0.32 0.42 0.52 0.62 0.72 0.82
Latitude
Probabilit
y
R1|NSO
JJA
b) a)
the yearly average association. The cool-wet as-sociation is supported in all seasons, particularly during winter and spring, whereas the warm-dry
situation in central Peru is confirmed mostly for
summer and winter.
From the analysis presented here it can be in-ferred that warm and cool phases of ENSO in the above-described zones are clearly discriminated in the austral spring. In contrast, over much of northern
Chile and part of southern Peru (16-30º S) a nonlinear association is shown. Therefore, for most latitudes analyzed here (from Mexico to Chile), drier and wetter than normal spring seasons were associated with cooler and warmer situations in the ENSO
variability. In central Peru, spring situations wetter
than normal were associated with cooler conditions related to ENSO.
Although our results are very coherent with the meteorological background, we decided to cross-check them using a different data base. For this
purpose, we used data from the Global Precipitation Climatology Project (GPCP) (Adler et al., 2003), v. 2.2, provided by the Earth System Research Labora-tory of NOAA (http://www.esrl.noaa.gov/psd/). Adler et al. (2003) explain that these data are combinations of satellite and rain-gauge sources, available from January 1979 to December 2014. Using this new data set, although much shorter, we consistently found al-most the same results as with Chen et al. (2002) data.
4. Conclusions
Precedent studies, beginning with Pittock (1980),
established the relationship between Southern Os-cillation variability and drier and wetter climate for western South America, particularly for Chile. Numerous studies have followed. We cite here those by Rutllant and Fuenzalida (1991) and Montecinos et al. (2000), which include an appropriate and complete review of literature as well as a deeper insight into the causes, time delay and particular cases of relationship. The research described here was intended to be methodological rather than the-oretical, and aims to provide a tool for analyzing cause-effect relationships by way of generalized linear logit models, providing the reader with the probability of occurrence of a wetter or drier than normal season given the phase of an ENSO event.
Our studies confirm, though differently and with a
dissimilar insight, precedent studies on the region
(e.g., Ruttlant and Fuenzalida, 1991; Enfield and
Alfaro, 1999; Montecinos et al., 2000).
Although criticism for this type of analysis focuses in the fact that there is an obvious loss of information, since a continuous variable is allocated into a few categories, it needs to be noticed that this loss of information allows to focus the analysis on the occurrence of events. In a way, this highlights
the specific categories of the event in which we are interested. In a first stage, this means that our main
interest is not the strength of an upcoming event but whether it will occur or not. Such information is instead emphasized using the categorization procedure. Only in the second stage of the study we will focus on the intensity of the event and on determining how strong (or weak) it will be if it eventually occurs.
Although the probabilities in the corners of the
contingency table, P11, P13, P31, P33 (dry, cool-wet, warm-dry and warm-cool-wet, respectively), seem to be more interesting and have a more straightforward interpretation, the center row and column are also interesting, since they show that there is no basis to expect any extreme condition (warm or cool events), which therefore corresponds to a probability close to 1/3. However, the results herein presented are viewed as a preliminary study on cause-effect relationships based on the introduction of logit models. We did not, for example, discriminate associations between strong, moderate and weak events to rainfall statis-tics, neither did we study a particular event impact as, e.g., Curtis et al. (2001) for the 1997-1998 event. It will be necessary to extend this research to high-er density estimations for rainfall along the Latin American west coast. For example, the analysis of high density Ecuadorian rainfall data (more than 210 rain gauges) by Rossel et al. (1998) revealed that al-though coastal rainfall is highly associated to ENSO events, this association in near-Andean regions like
Puyo or Cuenca is weaker. Therefore, our analysis,
based in 2.5 × 2.5º latitude-longitude grids (roughly over 250 kilometers), does not discriminate between coastal and near-Andean regions, therefore mixing or
most probably mitigating the ENSO influence. Also,
our investigation constructed an ocean-atmosphere ENSO index through the mixing of Niño 3 and SOI indices, which is practical, but it did not take into
ac-count the reality of the tropical Pacific SST evolution
Most probably, other indices such as Niño 1.2 SST could have been more meaningful for regions from Ecuador to northern Chile. In this regard, Coelho et al. (2002) analyzed the correlation between the South America rainfall variability (poorly gridded)
and six regions along the tropical Pacific, and showed
the need for a better specification of variability sources (i.e., Niño1, 2, 3 and 4 regions may be not enough). It is worth noting that using logit models
with regional specifications for tropical variability
and higher resolution precipitation grids may prob-ably yield very useful results.
We must, as well, focus this research on some par-ticular time scales. For example, in this study we did not discriminate between different modes of ENSO, i.e., interannual from decadal time scales (Zhou and Lau, 2001); neither did we differentiate ENSO from
non-ENSO variabilities (Mestas and Enfield, 2001).
These ENSO modes, which could be focused on the types of relationships found in this paper, need a different study, particularly for the effects of decadal time scales or even lower frequencies, like the global warming effect on rainfall. Finally, we might also extend our results to rainfall prediction based on the precedent season variability (see Montecinos et al., 2000). The following years will be fruitful in this
regard, given the practical benefits of this kind of
models on agriculture, epidemiology and at large in all economic activities associated with climate. As mentioned earlier, an advantage of this method is that it gives the results in terms of probabilities for different terciles, which is the most common output of current Regional Climate Outlook Forums in Latin America (e.g., IRI, 2001; García and Ramírez, 2012), and it could be extended to other variables considered in these forums like extreme events, number of rainy days or the midsummer drought (e.g. Maldonado et al., 2013; Alfaro, 2014).
Acknowledgments
This research was funded by grants from the Uni-versidad del Bío Bío, Chile (DIUBB 120808 2/R),
the Pontificia Universidad Javeriana seccional Cali, Colombia (research group EMAP, project “Aspectos
metodológicos del análisis categórico en la predictib-ilidad de la precipitación en la costa oeste de Centro y Sudamérica a partir de ENSO-020100256”), the
Panamerican Institute of Geography and History
(GEOF.02.2013). E. A. also received funds through
the following grants: IAI-CRN2-050, UCR-VI-805-A7002, B4227, B3413, B3600, A9532 and B0065.
References
Adler R. F., G. J. Huffman, A. Chang, R. Ferraro, P. Xie,
J. Janowiak, B. Rudolf, U. Schneider, S. Curtis, D.
Bolvin, A. Gruber, J. Susskind and P. Arkin, 2003. The version 2 Global Precipitation Climatology Project (GPCP) monthly precipitation analysis (1979-present). J. Hydrometeorol.4, 1147-1167.
Agresti A., 2002. Categorical data analysis. John Wiley and Sons, 710 pp.
Alfaro E. and L. Cid, 1999. Ajuste de un modelo VARMA para los campos de anomalías de precipitación en
Centroamérica y los índices de los océanos Pacífico y
Atlántico Tropical. Atmósfera12, 205-222.
Alfaro E. and F. Soley, 2001. Ajuste de un modelo VAR como predictor de los campos de anomalías de pre-cipitación en Centroamérica. Revista de Matemática: Teoría y Aplicaciones8, 99-116.
Alfaro E., 2014. Caracterización del “veranillo” en dos
cuencas de la vertiente del Pacífico de Costa Rica,
América Central. Int. J. Trop. Biol. 62, 1-15.
Amador J., 2008. The intra-Americas seas low-level jet (IALLJ): Overview and future research. Ann. N. Y. Acad. Sci.1146, 153-188.
Box G. E. P., G. M. Jenkins and G. C. Reinsel, 1994. Time series analysis: Forecasting and control. Prentice-Hall,
598 pp. (Holden-Day series in time series analysis and digital processing).
Chen M., P. Xie, J.E. Janowiak, and P.A. Arkin, 2002.
Global land precipitation: A 50-yr monthly analysis based on gauge observations. J. Hydrometeor3, 249-266, doi: http://dx.doi.org/10.1175/1525-7541(2002)
003<0249:GLPAYM>2.0.CO;2.
Coelho C. A. S., C. B. Uvo and T. Ambrizzi, 2002.
Ex-ploring the impact of the tropical Pacific SST on the
precipitation patterns over South America during ENSO periods. Theor. Appl. Climatol.71, 185-197. Curtis S., R. Adler, R. G. Huffman, E. Nelkin and D.
Bolvin, 2001. Evolution of tropical and extratropical precipitation anomalies during the 1997-1999 ENSO cycle. Int. J. Climatol. 21, 961-972.
Enfield D., 1989. El Niño, past and present. Rev. of Geo-phys. 2, 159-187.
Enfield D. and D. Mayer, 1997. Tropical Atlantic SST
Enfield D. and E. Alfaro, 1999. The dependence of Carib -bean rainfall on the interaction of the tropical Atlantic
and Pacific oceans. J. Climate 12, 2093-2103.
Enfield D. B, A. M. Mestas_Nuñez, D. A. Mayer and
L. Cid-Serrano, 1999. How ubiquitous is the dipole relationship in the tropical Atlantic sea surface tem-perature? J. Geophys. Res.104, 7841-7848.
García-Solera I. and P. Ramírez, 2012. Central America’s
seasonal climate outlook forum. Climate Services
Partnership, 8 pp. Available at: http://www.climate-ser
-vices.org/sites/default/files/CRRH_Case_Study.pdf.
Gershunov A. and T. Barnett, 1998. Inter-decadal modu-lation of ENSO teleconnections. Bull. Am. Meteorol. Soc.79, 2715-2725.
Giannini A., Y. Kushnir and M. A. Cane, 2000. Interan -nual variability of Caribbean rainfall, ENSO and the Atlantic ocean. J. Climate13, 297-311.
Goddard L., S. J. Mason, S. E. Zebiak, C. F. Ropelewski, R. Basher and M.A. Cane, 2001. Current approaches to seasonal to interannual climate predictions. Int. J. Climatol.21, 1111-1152.
Gouirand I., V. Moron, H. Zeng-Zhen and B. Jha, 2013.
Influence of the warm pool and cold tongue El Niño
on the following Caribbean rainy season rainfall. Clim. Dynam. 42, 919-929, doi:10.1007/s00382-013-1753-5. Gray W., 1984. Atlantic seasonal hurricane frequency.
Part I: El Niño and 30 mb quasi-biennial oscillation influences. Mon. Weather Rev.112, 1649-1668. IRI, 2001. Latin America regional report. In: Coping with
the climate: A way forward. IRI-CW/01/1.
Internation-al Research Institute for Climate Prediction, PInternation-alisades, N.Y, pp. 136-138.
Karnauskas K. B., A. Giannini, R. Seager and A. J. Busa-lacchi, 2013. A simple mechanism for the
climatolog-ical midsummer drought along the Pacific coast of
Central America. Atmósfera26, 261-281.
Katz R. W. and A. H. Murphy, 2000. Economic value of weather and climate forecasts. Climatic Change45, 601-606.
Latif M., D. Anderson, T. Barnett, M. Cane, R. Kleeman, A. Leetmaa, J. O’Brien, A. Rosati and E. Schneider, 1998. A review of the predictability and prediction of ENSO. J. Geophys. Res.103, 14375-l4393.
Lauro C. and S. Balbi, 1999. The analysis of structured qualitative data. Appl. Stoch. Mod. D. A.15, 1-27.
Lee S.-K., C. Wang and D. B. Enfield, 2010. On the impact of central Pacific warming events on Atlantic
tropical storm activity. Geophys. Res. Lett.37, L17702, doi:10.1029/2010GL044459.
Lee S.-K., R. Atlas, D. B. Enfield, C. Wang and H. Liu,
2013. Is there an optimal ENSO pattern that en-hances large-scale atmospheric processes conducive to major tornado outbreaks in the U.S.? J. Climate
26, 1626-1642, doi:http://dx.doi.org/10.1175/JC-LI-D-12-00128.1.
Magaña V., J. Pérez, J. Vázquez, E. Carrisoza and J. Pérez,
1999a. El Niño y el clima. In: Los impactos de El Niño en México (V. Magaña, Ed.). Centro de Ciencias de la Atmósfera, UNAM, Mexico, pp. 34-41.
Magaña V., J. A. Amador and S. Medina, 1999b. The mid-summer drought over Mexico and Central America. J. Climate12, 1577-1588.
Maldonado T., E. Alfaro, B. Fallas and L. Alvarado, 2013. Seasonal prediction of extreme precipitation events and frequency of rainy days over Costa Rica, Central America, using canonical correlation analysis. Advanc-es in GeosciencAdvanc-es33, 41-52.
Mason S. J., and G. M. Mimmack, 2002. Comparison of some statistical methods of probabilistic forecasting of ENSO. J. Climate15, 8-29.
McCreary J. P. and D. L. T. Anderson, 1991. An overview
of coupled ocean-atmosphere models of El Niño and the Southern Oscillation. J. Geophys. Res.96, 3125-3150.
Mestas-Núñez A. M. and D. B. Enfield, 2001. Eastern equatorial Pacific SST variability: ENSO and Non-EN -SO components and their climatic associations. J. Climate14, 391-402.
Montecinos A., A. Diaz and P. Aceituno, 2000. Seasonal
diagnostic and predictability of rainfall in subtropical
South America based on tropical Pacific SST. J. Cli-mate13, 746-758.
Oliver J. E., 2005. Local winds. In: The encyclopedia of world climatology (J. E. Oliver, Ed.). Springer, Neth-erlands, pp. 467-475.
Pittock A. B., 1980. Pattern of climate variability in Argen
-tina and Chile-I: Precipitation, 1931-60. Mon. Weather Rev.108, 1347-1361.
Peña M. and M. W. Douglas, 2002. Characteristics of Wet and Dry Spells over the Pacific Side of Central
America during the Rainy Season. Mon. Weather Rev.
130, 3054-3073.
Philander G., 1990. El Niño, La Niña and the Southern Oscillation. Academic Press, 289 pp.
Rasmusson E., 1985. El Niño and variations in climate.
Am. Sci.73, 168-177.
the El Nino/Southern Oscillation. Mon. Weather Rev.
115, 1606-1626.
Ropelewski C. F. and M. S. Halpert, 1989. Precipitation
patterns Associated with the high index phase of the Southern Oscillation. J. Climate2, 268-284.
Rossel F., R. Mejía, G. Ontaneda, R. Pomboza, J. Roura, P.
Le-Goulven, E. Cadier and R. Calvez, 1998.
Regional-isation de l’influence du El Niño sur les precipitations
de l’Equateur. Bulletin de l’Institut Français d’Études Andines27, 643-654.
Rutllant J. and H. Fuenzalida, 1991. Synoptic aspects of the central Chile rainfall variability y associated with the Southern Oscillation. Int. J. Climatol.11, 63-76.
Taylor M. A., D. B. Enfield and A. Chen, 2002. Influence of the tropical Atlantic versus the tropical Pacific on
Caribbean rainfall. J. Geophys. Res.-Oceans 107, doi:10.1029/2001JC001097.
Taylor M. A. and E. J. Alfaro, 2005. Climate of Central America and the Caribbean. In: The encyclopedia of world climatology (J. E. Oliver, Ed.). Springer, Neth-erlands, pp. 183-189.
Viles H. and A. Goudie, 2003. Interannual, decadal and multidecadal scale climatic variability and geomor-phology. Earth-Sci. Rev.61, 105-131.
Weisberg R. H. and C.Wang, 1997. A western Pacific os -cillator paradigm for the El Niño-Southern Oscillation.
Geophys. Res. Lett.24, 779-782.
Wilks D. S., 2011. Statistical methods in the atmospheric sciences, 3rd ed. Elsevier, 676 pp.
Wolter K. and M. S. Timlin, 1993. Monitoring ENSO in COADS with a seasonally adjusted principal compo-nent index. In: Proceedings of the Seventeenth Annual Climate Diagnostics Workshop, Held at the University of Oklahoma, Norman, Oklahoma. National Oceanic and Atmospheric Administration, pp. 52-57.
Wolter K., 1987. The Southern Oscillation in surface circulation and climate over the tropical Atlantic,
Eastern Pacific, and Indian Oceans as captured by
cluster analysis. J. Climate Appl. Meteor.26, 540-558.
Zhou J. and K. M. Lau, 2001. Principal modes of interan -nual and decadal variability of summer rainfall over southern America. Int. J. Climatol.21, 1623-1644. Zwiers F. W. and H. von Storch, 2004. On the role of