VOLUME 17 ISSUE 2 (2019), Page 280
–
289
EMPOWERING COMMUNITY MOVEMENT: EMPRICAL EVIDENCE
Aisyah Abu Bakar
1, Mariana Mohamed Osman
2& Muhammad Faris Abdullah
31,2
Kulliyyah of Architecture and Environmental Design,
INTERNATIONAL ISLAMIC UNIVERSITY MALAYSIA
Abstract
The living environment in which humans dwell in and are surrounded by, and
thus include the immediate built environment, is fertile ground for personal
development leading to community advancement.
Issue:
Ample amount of
studies have been carried out on the influence of personal empowerment (PE) on
community movement (CM). Little attention was given to the empirical evidence
of the impact of PE on CM.
Purpose:
This paper sets out to confirm the statistical
predictability of CM based on PE.
Approach:
Multiple Correlation and Multiple
Linear Regression were executed to assess linear associations and parameters of
linear equations to predict CM components based on PE items.
Findings:
Majority of PE items were significant predictors of CM components and ‘
setting
goals and striving to meet goals
’ was the stron
gest predictor of CM.
INTRODUCTION
Interdependency between human and other humans (HIH) is a significant causal
agent of subjective sustainable well-being (SSWB). Understanding HIH helps
architects plan and design houses, cities and other kinds of human habitations to
enhance individual empowerment resulting to improved community
development. Awareness deficits on HIH and SSWB can lead to users’
dissatisfaction, alienation and eventually weak community interaction. Personal
empowerment (PE) and community movement (CM) are dimensions of HIH.
Many authors have theoretically recognised the positive impact of PE on CM.
This paper measures the statistical predictability of CM based on PE.
LITERATURE REVIEW
Case studies based on articles from selected Asian Journals from the year 2011
onwards highlight conditional factors and potential determinants of Community
Movement (CM). Table 1 summarises these findings.
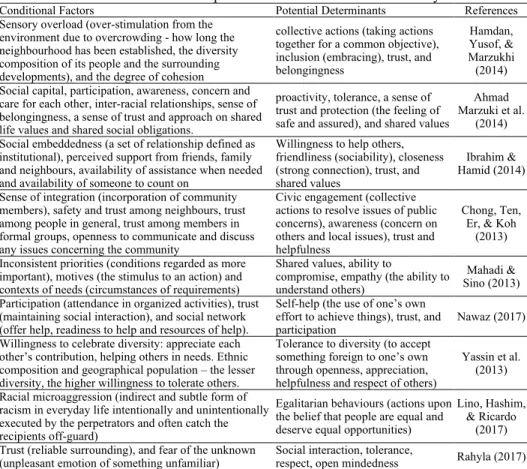
Table 1
Conditional factors and potential determinants for community movement
Conditional Factors Potential Determinants References Sensory overload (over-stimulation from the
environment due to overcrowding - how long the neighbourhood has been established, the diversity composition of its people and the surrounding developments), and the degree of cohesion
collective actions (taking actions together for a common objective), inclusion (embracing), trust, and belongingness
Hamdan, Yusof, & Marzukhi (2014) Social capital, participation, awareness, concern and
care for each other, inter-racial relationships, sense of belongingness, a sense of trust and approach on shared life values and shared social obligations.
proactivity, tolerance, a sense of trust and protection (the feeling of safe and assured), and shared values
Ahmad Marzuki et al.
(2014) Social embeddedness (a set of relationship defined as
institutional), perceived support from friends, family and neighbours, availability of assistance when needed and availability of someone to count on
Willingness to help others, friendliness (sociability), closeness (strong connection), trust, and shared values
Ibrahim & Hamid (2014)
Sense of integration (incorporation of community members), safety and trust among neighbours, trust among people in general, trust among members in formal groups, openness to communicate and discuss any issues concerning the community
Civic engagement (collective actions to resolve issues of public concerns), awareness (concern on others and local issues), trust and helpfulness
Chong, Ten, Er, & Koh
(2013)
Inconsistent priorities (conditions regarded as more important), motives (the stimulus to an action) and contexts of needs (circumstances of requirements)
Shared values, ability to
compromise, empathy (the ability to understand others)
Mahadi & Sino (2013) Participation (attendance in organized activities), trust
(maintaining social interaction), and social network (offer help, readiness to help and resources of help).
Self-help (the use of one’s own effort to achieve things), trust, and
participation Nawaz (2017) Willingness to celebrate diversity: appreciate each
other’s contribution, helping others in needs. Ethnic composition and geographical population – the lesser diversity, the higher willingness to tolerate others.
Tolerance to diversity (to accept something foreign to one’s own through openness, appreciation, helpfulness and respect of others)
Yassin et al. (2013)
Racial microaggression (indirect and subtle form of racism in everyday life intentionally and unintentionally executed by the perpetrators and often catch the recipients off-guard)
Egalitarian behaviours (actions upon the belief that people are equal and deserve equal opportunities)
Lino, Hashim, & Ricardo
(2017) Trust (reliable surrounding), and fear of the unknown
Meaningful activities (activities that have important
purposes, useful qualities, and consequential) Volunteering (freely offering to undertake tasks),
Tunku, Rahman, &
Campus (2017) Attitudinal factors (instrumental values, desirability of
volunteering, attitude and satisfaction from volunteering) and motivational factors (altruism, egoism, religiosity, social obligation, political interest)
Volunteer commitment (keenness to offer assistance), and solidarity (mutual support within a group)
Thomas, Selvadurai, Er, Lyndon, &
Moorthy (2011) Gender – female score higher in Islamic religiosity
(striving, universality, integrity, respect, surrendering, trust, humility, and practical spiritual consciousness).
Tolerance, moderation (restraining
self from something extreme) Krauss (2013) Ortega &
The findings from the case studies generate three significant components
of CM: (i) Proactive Participation (CMa), (ii) Affability and Respect for Diversity
(CMb) and (iii) Belongingness (CMc).
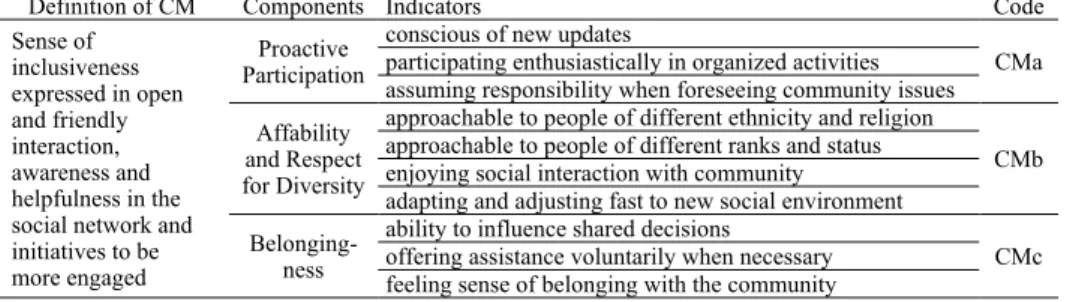
Table 2
Components and determinants of community movement
Definition of CM Components Indicators Code
Sense of inclusiveness expressed in open and friendly interaction, awareness and helpfulness in the social network and initiatives to be more engaged
Proactive Participation
conscious of new updates
CMa participating enthusiastically in organized activities
assuming responsibility when foreseeing community issues Affability
and Respect for Diversity
approachable to people of different ethnicity and religion
CMb approachable to people of different ranks and status
enjoying social interaction with community adapting and adjusting fast to new social environment
Belonging-ness
ability to influence shared decisions
CMc offering assistance voluntarily when necessary
feeling sense of belonging with the community
Personal Empowerment (PE) manifests in the opportunity to exercise
control, voice and choice with regards to social surroundings. Qualities adhere to
PE include (i) self-motivation with regards to goal orientation, autonomy and
self-regulation (Chin, Khoo, & Low, 2012; Kok, 2016), (ii) social acceptance and
coherence with others (Nesbit, Jepsen, Demirian, & Ho, 2012; Kadir, Omar,
Desa, & Yusooff, 2013; Zamani, Khairudin, Sulaiman, Halim, & Nasir, 2013),
and (iii) composure, stability and resilience (Sulaiman et al., 2013; Sipon, Nasrah,
Nazli, Abdullah, & Othman, 2014).
Table 3
Determinants of personal empowerment
Definition of PE Indicators Code
Self-esteem in taking control over life along with sense of composure to progress in the social
environment
Based on theoretical underpinnings, this research hypothesises that CM
components are predictable by PE. The following sections provide empirical
evidence to the predictability of CMa, CMb and CMc based on PE items.
METHOD
A sample of 4,315 was gathered after the data screening process. The Malaysian
respondents were given an 11-point Likert scale to respond to questionnaire items
which include the components of CM and the ten (10) PE items. Pearson
correlation analyses were conducted to observe if there were linear associations
between the CM components and PE items. Ensuing correlation analyses,
multiple linear regression analyses were conducted to estimate parameters of the
linear equations used to predict values of CMa, CMb and CMc from PE items.
RESULTS AND
DISCUSSION
At 95% confidence level, there were statistically significant positive correlations
between (i) CMa and each of PE items, (ii) CMb and each of PE items, and (iii)
CMc and each of PE items. The null hypotheses claiming there are no statistically
significant correlations between (i) CMa and respective PE items, (ii) CMb and
respective PE items, and (iii) CMc and respective PE items were all rejected.
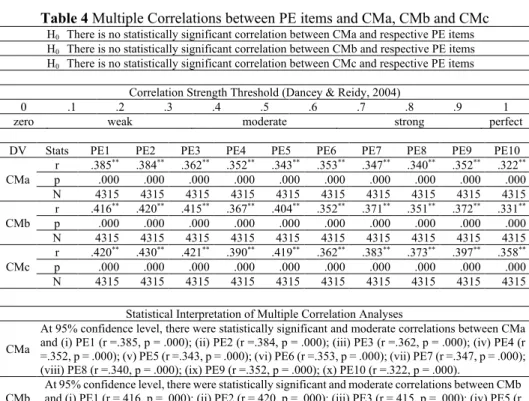
Table 4
Multiple Correlations between PE items and CMa, CMb and CMc
H0 There is no statistically significant correlation between CMa and respective PE items H0 There is no statistically significant correlation between CMb and respective PE items H0 There is no statistically significant correlation between CMc and respective PE items
Correlation Strength Threshold (Dancey & Reidy, 2004)
0 .1 .2 .3 .4 .5 .6 .7 .8 .9 1
zero weak moderate strong perfect
DV Stats PE1 PE2 PE3 PE4 PE5 PE6 PE7 PE8 PE9 PE10
CMa
r .385** .384** .362** .352** .343** .353** .347** .340** .352** .322** p .000 .000 .000 .000 .000 .000 .000 .000 .000 .000 N 4315 4315 4315 4315 4315 4315 4315 4315 4315 4315
CMb
r .416** .420** .415** .367** .404** .352** .371** .351** .372** .331** p .000 .000 .000 .000 .000 .000 .000 .000 .000 .000 N 4315 4315 4315 4315 4315 4315 4315 4315 4315 4315
CMc
r .420** .430** .421** .390** .419** .362** .383** .373** .397** .358** p .000 .000 .000 .000 .000 .000 .000 .000 .000 .000 N 4315 4315 4315 4315 4315 4315 4315 4315 4315 4315
Statistical Interpretation of Multiple Correlation Analyses
CMa
At 95% confidence level, there were statistically significant and moderate correlations between CMa and (i) PE1 (r =.385, p = .000); (ii) PE2 (r =.384, p = .000); (iii) PE3 (r =.362, p = .000); (iv) PE4 (r =.352, p = .000); (v) PE5 (r =.343, p = .000); (vi) PE6 (r =.353, p = .000); (vii) PE7 (r =.347, p = .000); (viii) PE8 (r =.340, p = .000); (ix) PE9 (r =.352, p = .000); (x) PE10 (r =.322, p = .000).
CMb
CMb and (v) PE4 (r =.367, p = .000); (vi) PE6 (r =.352, p = .000); (vii) PE7 (r =.371, p = .000); (viii) PE8 (r =.351, p = .000); (ix) PE9 (r =.372, p = .000); (x) PE10 (r =.331, p = .000).
CMc
At 95% confidence level, there were statistically significant and moderate correlations between CMc and (i) PE1 (r =.420, p = .000); (ii) PE2 (r =.430, p = .000); (iii) PE3 (r =.421, p = .000); (iv) PE5 (r =.419, p = .000). Additionally, there were statistically significant and weak correlations between CMc and (v) PE4 (r =.390, p = .000); (vi) PE6 (r =.362, p = .000); (vii) PE7 (r =.383, p = .000); (viii) PE8 (r =.373, p = .000); (ix) PE9 (r =.397, p = .000); (x) PE10 (r =.358, p = .000).
Three (3) multiple regression analyses were carried out to predict the
values of each of dependent variables (i) CMa, (ii) CMb and (iii) CMc given the
set of PE explanatory variables (PE1, PE2, PE3, PE4, PE5, PE6, PE7, PE8, PE9,
and PE10).
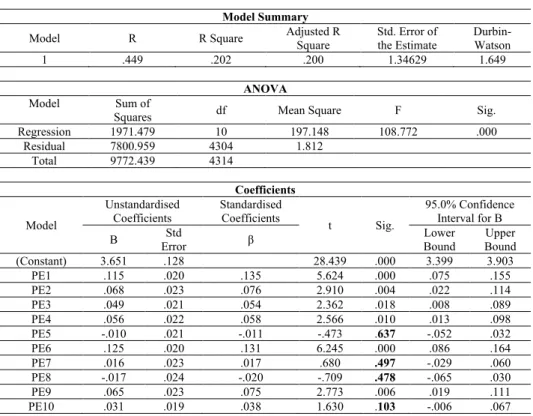
Table 5
Multiple Linear Regression
–
PE predicting CMa
H0
There will be no significant prediction of CMa by PE1, PE2, PE3, PE4, PE5, PE6, PE7, PE8, PE9 and PE10
Model Summary
Model R R Square Adjusted R Square Std. Error of the Estimate Durbin-Watson
1 .449 .202 .200 1.34629 1.649
ANOVA
Model Sum of
Squares df Mean Square F Sig.
Regression 1971.479 10 197.148 108.772 .000
Residual 7800.959 4304 1.812 Total 9772.439 4314
Coefficients
Model
Unstandardised Coefficients
Standardised
Coefficients t Sig.
95.0% Confidence Interval for B
B Error Std β Lower Bound Bound Upper
(Constant) 3.651 .128 28.439 .000 3.399 3.903
PE1 .115 .020 .135 5.624 .000 .075 .155
PE2 .068 .023 .076 2.910 .004 .022 .114
PE3 .049 .021 .054 2.362 .018 .008 .089
PE4 .056 .022 .058 2.566 .010 .013 .098
PE5 -.010 .021 -.011 -.473 .637 -.052 .032
PE6 .125 .020 .131 6.245 .000 .086 .164
PE7 .016 .023 .017 .680 .497 -.029 .060
PE8 -.017 .024 -.020 -.709 .478 -.065 .030
PE9 .065 .023 .075 2.773 .006 .019 .111
PE10 .031 .019 .038 1.630 .103 -.006 .067
= 108.772, p = .000, with an R
2of .202; indicating that the proportion of variance
in CMa that can be explained by PE items was 20.2%.
At 95% confidence level, PE1 (B = .115, t = 5.624, p = .000), PE2 (B =
.068, t = 2.910, p =.004), PE3 (B = .049, t = 2.362, p =.018), PE4 (B = .056, t =
2.566, p =.010), PE6 (B = .125, t = 6.245, p =.000) and PE9 (B = .065, t = 2.773,
p =.006) were significant predictors of CMa. On the contrary, it was found that
PE5 (B = -.010, t = -.473, p = .637), PE7 (B = .016, t = .680, p = .497), PE8 (B =
-.017, t = .680, p = .497) and PE10 (B = .031, t = 1.630, p =.103) were not
significant predictors of CMa.
Personal Empowerment (PE) items account for 20.2% of Proactive
Participation (CMa). Seven (7) of PE items were significant predictors of CMa.
Table 6
Multiple Linear Regression
–
PE predicting CMb
H0
There will be no significant prediction of CMb by PE1, PE2, PE3, PE4, PE5, PE6, PE7, PE8, PE9 and PE10
Model Summary
Model R R Square Adjusted R Square Std. Error of the Estimate Durbin-Watson
1 .485 .235 .233 1.35845 1.692
ANOVA
Model Sum of
Squares df Mean Square F Sig.
Regression 2442.280 10 244.228 132.345 .000
Residual 7942.545 4304 1.845 Total 10384.825 4314
Coefficients
Model
Unstandardised Coefficients
Standardised
Coefficients t Sig.
95.0% Confidence Interval for B
B Std Error β Lower Bound Bound Upper
(Constant) 3.675 .130 28.369 .000 3.421 3.929
PE1 .113 .021 .129 5.478 .000 .072 .153
PE2 .072 .024 .078 3.073 .002 .026 .119
PE3 .098 .021 .106 4.724 .000 .057 .139
PE4 .000 .022 .000 -.009 .993 -.043 .043
PE5 .104 .021 .112 4.848 .000 .062 .146
PE6 .062 .020 .063 3.069 .002 .022 .101
PE7 .040 .023 .044 1.755 .079 -.005 .086
PE8 -.035 .024 -.039 -1.443 .149 -.083 .013
PE9 .063 .024 .071 2.659 .008 .017 .109
PE10 .021 .019 .026 1.127 .260 -.016 .058
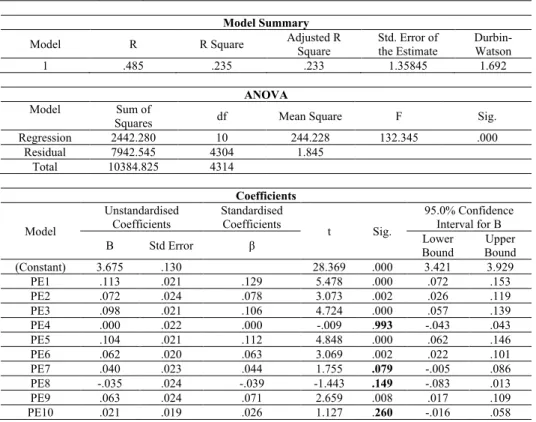
= 132.345, p = .000, with an R
2of .235; indicating that the proportion of variance
in CMb that can be explained by PE items was 23.5%.
At 95% confidence level, PE1 (B = .113, t = 5.478, p = .000), PE2 (B =
.072, t = 3.073, p =.002);, PE3 (B = .098, t = 4.724, p =.000), PE5 (B = .104, t =
4.848, p = .000), PE6 (B =.062 , t = 3.069, p =.002) and PE9 (B = .063, t = 2.659,
p =.008) were significant predictors of CMb. On the contrary, it was found that
PE4 (B = .000, t = -.009, p =.993), PE7 (B = .040, t = 1.755, p = .075), PE8 (B =
-.035, t = -1.443, p = .149) and PE10 (B = .021, t = 1.127, p =.260) were not
significant predictors of CMb.
Personal Empowerment (PE) items account for 23.5% of Affability and
Respect for Diversity (CMb). Six (6) of PE items were significant predictors of
CMb.
Table 7
Multiple Linear Regression
–
PE predicting CMc
H0
There will be no significant prediction of CMc by PE1, PE2, PE3, PE4, PE5, PE6, PE7, PE8, PE9 and PE10
Model Summary
Model R R Square Adjusted R Square Std. Error of the Estimate Durbin-Watson
1 .500 .250 .248 1.34241 1.652
ANOVA
Model Sum of
Squares df Mean Square F Sig.
Regression 2582.930 10 258.293 143.333 .000
Residual 7756.035 4304 1.802 Total 10338.965 4314
Coefficients
Model
Unstandardised Coefficients
Standardised
Coefficients t Sig.
95.0% Confidence Interval for B
B Std Error β Lower Bound Bound Upper
(Constant) 3.478 .128 27.169 .000 3.227 3.729
PE1 .094 .020 .107 4.605 .000 .054 .134
PE2 .081 .023 .088 3.481 .001 .035 .127
PE3 .081 .021 .088 3.955 .000 .041 .121
PE4 .033 .022 .034 1.539 .124 -.009 .076
PE5 .106 .021 .114 4.985 .000 .064 .147
PE6 .048 .020 .049 2.401 .016 .009 .087
PE7 .018 .023 .020 .785 .433 -.027 .062
PE8 -.023 .024 -.026 -.954 .340 -.071 .024
PE9 .080 .023 .090 3.431 .001 .034 .126
PE10 .041 .019 .049 2.174 .030 .004 .077
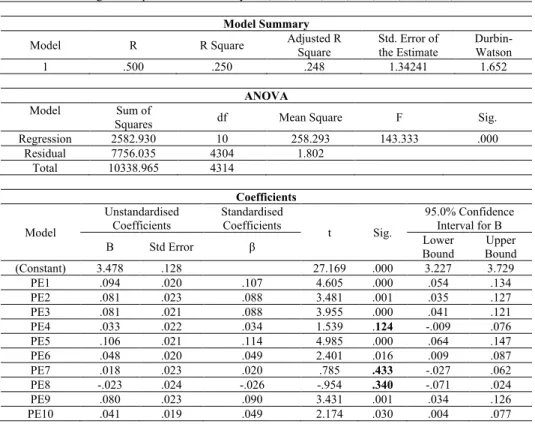
= 143.333, p = .000, with an R
2of .250; indicating that the proportion of variance
in CMc that can be explained by PE items was 25%.
At 95% confidence level, PE1 (B = .094, t = 4.605, p = .000), PE2 (B =
.081, t = 3.481, p =.001), PE3 (B = .081, t = 3.955, p =.000), PE5 (B = .106, t =
4.985, p = .000), PE6 (B = .048, t = 2.401, p =.016), PE9 (B = .080, t = 3.431, p
=.001) and PE10 (B = .041, t = 2.174, p =.030) were significant predictors of
CMc. On the contrary, it was found that PE4 (B = .033, t = 1.539, p =.124), PE7
(B = .018, t = .785, p = .433) and PE8 (B = -.023, t = -.954, p = .340) were not
significant predictors of CMc.
Personal Empowerment (PE) items account for 25% of Belongingness
(CMc). Seven (7) of PE items were significant predictors of CMc.
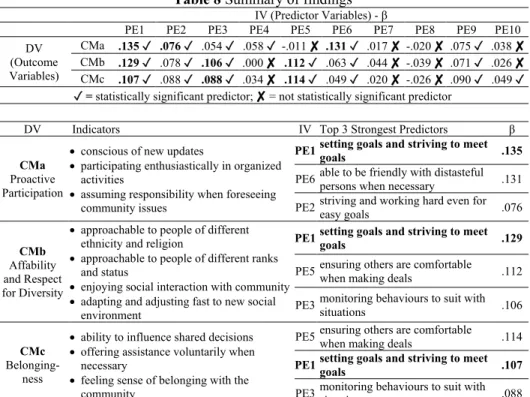
Table 8
Summary of findings
IV (Predictor Variables) - β
PE1 PE2 PE3 PE4 PE5 PE6 PE7 PE8 PE9 PE10 DV
(Outcome Variables)
CMa .135 ✓ .076✓ .054 ✓ .058 ✓ -.011 ✘ .131 ✓ .017 ✘-.020 ✘ .075 ✓ .038 ✘
CMb .129 ✓ .078 ✓ .106✓ .000 ✘ .112 ✓ .063 ✓ .044 ✘-.039 ✘ .071 ✓ .026 ✘
CMc .107✓ .088 ✓ .088✓ .034 ✘ .114 ✓ .049 ✓ .020 ✘-.026 ✘ .090 ✓ .049 ✓ ✓ = statistically significant predictor; ✘ = not statistically significant predictor
DV Indicators IV Top 3 Strongest Predictors β
CMa
Proactive Participation
• conscious of new updates
• participating enthusiastically in organized activities
• assuming responsibility when foreseeing community issues
PE1 setting goals and striving to meet goals .135
PE6 able to be friendly with distasteful persons when necessary .131
PE2 striving and working hard even for easy goals .076
CMb
Affability and Respect for Diversity
• approachable to people of different ethnicity and religion
• approachable to people of different ranks and status
• enjoying social interaction with community
• adapting and adjusting fast to new social environment
PE1 setting goals and striving to meet goals .129
PE5 ensuring others are comfortable when making deals .112
PE3 monitoring behaviours to suit with situations .106
CMc
Belonging-ness
• ability to influence shared decisions
• offering assistance voluntarily when necessary
• feeling sense of belonging with the community
PE5 ensuring others are comfortable when making deals .114
PE1 setting goals and striving to meet goals .107
PE3 monitoring behaviours to suit with situations .088