T
ECHNICAL AND
E
CONOMIC
E
VALUATION
OF
I
MPLEMENTING
S
HIP
E
NERGY
E
FFICIENCY
M
ANAGEMENT
P
LAN
(SEEMP)
ON
S
TEAM
P
ROPULSION
LNG
C
ARRIER
M. N. A. Rosmani,
aN. Ismail,
a,*a
Faculty of Mechanical Engineering (FKM)
Univerisiti Teknologi Malaysia
81310 UTM SKudai, Johor, Malaysia.
Article history Received 04 November 2015 Received in revised form
21 November 2015 Accepted 25 December 2015
*Corresponding author
[email protected]
KEYWORDS
Energy Efficiency Operational Indicator (EEOI);
Ship Energy Efficiency Management Plan
(SEEMP); Liquefied Natural Gas (LNG);
INTRODUCTION
International Maritime Organization (IMO) is a specialized agency of the United Nation responsible for monitoring to improve the safety and security of international shipping and to prevent marine pollution caused by ship emissions. IMO has developed a number of technical and operational measures such as SEEMP [1] and EEOI [2] in order to regulate shipping energy efficiency and indirectly control the marine Green House Gas (GHG) emissions. This greenhouse effect causes destruction to the earth atmosphere, such as rise in the global temperature and sea water level which can harm living things. This project focuses on identifying the parameters for evaluation, as well as to establish the procedure for implementation of SEEMP on steam propulsion LNG carrier to increase ship efficiency and reduce emission by ships.
ABSTRACT
Ship Energy Efficiency Management Plan
(SEEMP) is a simple approach for
monitoring ship and fleet efficiency
performances from time to time as well as
for emission monitoring and reduction as
mentioned as in the rule and regulation.
SEEMP also provides some options to be
considered to optimize ships efficiency to
reduce emission. SEEMP consists of four
stages. The first stage is the planning
stage,
followed
by
implementation,
monitoring and self-evaluation, and finally
improvement stage. In the planning stage,
any ship-specific measures that can be
implemented on board the ship to
improve the ship efficiency as well as to
reduce emission are determined. After the
ship-specific measures are implemented,
they will be monitored in the third stage
by using Energy Efficiency Operational
Indicator (EEOI). In the final stage, an
overall analysis from the data collected in
the monitoring stage are analyzed in order
to deepen the understanding on the
overall characteristics of the ship’s
operation, such as which type of measures
that can or cannot function effectively and
lastly to improve the SEEMP for the next
cycle. This project focuses on how to
implement the SEEMP on a steam
propulsion LNG carrier.
Technical and economic evaluations of
SEEMP
implementation
on
steam
TECHNICAL EVALUATION OF SEEMP
IMPLEMENTATION
Weather Routing Optimization
The steps to implement weather routing optimisation on steam propulsion LNG carrier are described in the next subsection.
Planning
The parameters for evaluation SEEMP on steam propulsion LNG carrier for weather routing optimization are shown in Table 1.
Table 1: Weather Routing Optimization Parameters
Taking advantages of the technology sophistication in present time and by making use of the computer program available which use accurate information such as weather, shallow water area, sea currents and other related information, the optimum route to be taken by the personal in charge on board of the ship can be determined. The information and modern technologies can help in decision making if they have more than one route to choose in order to arrive to specific destination. The criteria for the route selection are to achieve minimal fuel consumption, ship emission and time taken to arrive to the destination.
Besides using computer programs, some companies today make use weather forecast charts and hand the final decision to be made by the personnel in charge. The personnel needs to choose the most appropriate route to avoid bad weather, and if a wrong decision is made, this may cause a delay on the ship voyage and the ship will be unable to arrive at estimated time arrival (ETA). The main reasons of avoiding a route with bad weather are for safety of the vessel, its property, fuel and cargo, as well as to reduce emission.
Jeppesen, a Boeing company, had launched the Vessel and Voyage Optimization Solution (VVOS). VVOS is one of the weather routing software used in order to determine the best ship route.
Figure 1: Route plotted on a navigation chart using Jeppesen C-Map Professional Chart [3]
Figure 2: Ship routes comparison by using VVOS [3]
Figure 1 shows the example of ship route plotted on a navigation chart using Jeppesen C-Map Professional Chart, while Figure 2 shows the comparison between ship routes developed by using VVOS [3]. The personnel in charge on board of the ship can use the aid of the software such as VVOS or other weather routing software to decide the best route. The implementation of weather routing optimisation on board the ship can reduce the fuel oil consumption by 2 – 4 % [4].
Implementation
The concept of how weather routing software determines the best route takes into consideration four different parameters, which are distance sailed, speed of the vessel, condition of the sea and EEOI. Nevertheless, in real life situation, the software takes into consideration more than four parameters. Due to lack of information and data, only four parameters on concept of the weather routing optimisation below are explained in this paper.
a) Different Weather Condition with Almost the Same Speed and Distance Sailed
Table 2: Different Weather Condition with about the Same Speed and Distance
Table 3: Different Weather Condition with About the Same Speed and Distance
Table 4: Different Weather Condition with About the Same Speed and Distance
The red and purple columns in Table 2, 3 and 4 represent the weather condition of each of the route taken by the ship, as illustrated in Figure 3.
Figure 3: Weather Condition of Route A and B
Tables 2, 3 and 4 illustrate that the fuel consumption of a ship taking a route with bad weather condition is higher as compared to a ship sailing on the route with normal weather condition with the same speed and distance sailed. Table 5 shows similar distance sailed and speed of the ship but with different weather condition. A ship taking the route with bad weather condition consumes 177 tonnes of both heavy fuel oil and boil off gas, which is 21 tonnes higher as compared to the other route. Due to higher fuel consumption rate, its EEOI becomes higher because EEOI is directly proportional to fuel consumption.
b) Different Weather Condition and Distance Sailed with Almost the Same Speed
In real life situation, although with implementation of weather routing optimization as an approach to reduce fuel consumption and emission, the distance sailed by a ship sailing on a typical weather condition will be greater than the route with bad weather condition because it needs to avoid the bad weather condition (Figure 4).
Figure 4: Route taken by Ship in Weather Routing Optimization
A voyage data of the steam propulsion LNG carrier with different weather condition and different distance sailed but the same speed are obtained in order to evaluate this situation as shown in Tables 5, 6 and 7.
Table 5: Different Weather Condition and Distance Sailed with About the Same Speed and Distance
Table 6: Different Weather Condition and Distance Sailed with About the Same Speed and Distance
Tables 5 and 6 illustrate that the fuel consumed for a route with a bad weather condition is higher although the distance sailed by the ship with typical weather condition is greater. From EEOI point of view, due to the higher fuel consumption, the EEOI of route with bad weather condition is greater as compared to the other route.
Monitoring
Table 7: Total fuel consumption by eighteen voyages and the average EEOI
without WRO with WRO
Voyage ∑HFO Consume
(tones)
EEOI (×10-6) tons.CO2/
tons.NM
∑HFO Consume
(tones)
EEOI (×10-6) tons.CO2/
tons.NM
Different In ∑HFO Consume
(tones)
Reduce avg EEOI
(%)
1 725 43.665 703.25 43.013 21.75 1.49
2 769 39.414 745.93 38.821 23.07 1.51
3 760 40.609 737.2 40.025 22.80 1.44
4 1446 32.471 1402.62 31.887 43.38 1.80
5 466 36.048 452.02 35.641 13.98 1.13
6 323 47.259 313.31 46.803 9.69 0.97
7 432 32.985 419.04 32.660 12.96 0.98
8 478 37.022 463.66 36.714 14.34 0.83
9 473 34.460 458.81 34.111 14.19 1.01
10 779 43.170 755.63 42.584 23.37 1.36
11 302 55.652 292.94 55.175 9.06 0.86
12 422 40.419 409.34 40.072 12.66 0.86
13 545 38.383 528.65 37.911 16.35 1.23
14 795 37.449 771.15 36.960 23.85 1.31
15 464 35.812 450.08 35.404 13.92 1.14
16 649 40.189 629.53 39.816 19.47 0.93
17 785 56.933 761.45 56.193 23.55 1.30
18 760 40.609 737.2 40.025 22.80 1.44
341.19 1.20
Table 7 shows the total fuel consumption and average EEOI for eighteen voyages in one year. From the table, it can be concluded that by implementing weather routing on board of steam propulsion LNG carrier, the total fuel consumed per year is 341.19 tonnes while percentages of average EEOI reduced is 1.2 % per year. This information indicates that the average EEOI per voyage as well as ship’s emission is reduced by 1.2%.
Asymmetry Pre-Swirl Stator
The steps to implement asymmetry pre-swirl stator on steam propulsion LNG carrier are described in the subsection of this chapter.
Planning
The parameters for SEEMP evaluation on steam propulsion LNG carrier for Asymmetry pre-swirl stator are summarized in Table 8.
Table 8: Asymmetry Pre-Swirl Stator Parameters
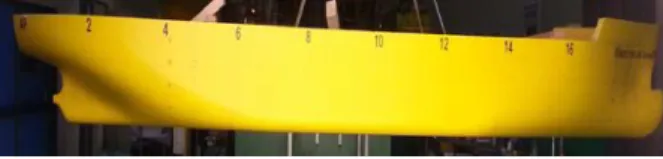
LNG carrier is classified by its LNG storage tank of some standard capacities such as 140,000, 160,000, 180,000 and 200,000 m3. The simplified form to this classification is through 160k LNG carrier for an example of LNG carrier that consist 160,000m3 tank of gases. From the experiment conducted on 160k LNG carrier model ship at Pusan National University, the model setup, ship particulars and results obtained in the experiment are as follows [5].
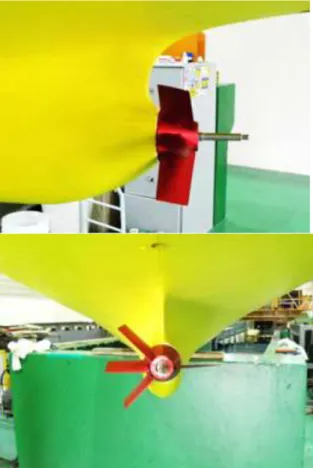
Figure 6: Ship model without Asymmetry Pre-Swirl Stator
Figure 7: Ship model with Asymmetry Pre-Swirl Stator
Table 9: Ship Model Particulars
Dimension Ship Model
LPP (m) 278 5.756
LWL (m) 274.1 5.675
B (m) 46 0.952
T(m) 11.6 0.24
Design Speed(Knot) 19.5 2.81
λ 48.3
Table 10: Result of the experiment
Dimension PD(Kw) △PD (%) Without Asymmetry Pre-Swirl
Stator
26438 0
With Asymmetry Pre-Swirl Stator (Constant)
25038 -5.29
By referring to the result of this experiment in Table 10, it can be concluded that the delivered power (PD) of 160k LNG carrier can be reduced by implementing the constant type Pre-Swirl Asymmetry Stator. The delivered power (PD) can be reduced up to -5.29 %. In this project, the constant Asymmetry Pre-Swirl Stator has been installed on the base ship, with assumption that the hull form of the basis ship is the same as the 160k LNG carrier model used in the above experiment.
Implementation
By using the data of the base ship of LNG carrier, the fuel consumption can be calculated. The results of the calculation are as shown below.
Table 11: Effect of Implementing Asymmetry Pre-Swirl Stator on the Base Ship
Items Without
Asymmetry Pre-Swirl
Stator
With Asymmetry
Pre-Swirl Stator
PD(Kw) 26800 25382.28
Steam Consumption
(t/h)
87.6 84.17
Fuel Consumption
Rate (t/h)
8.28 7.84
△ Fuel Consumption
Rate
5.31 %
Table 12: Total Fuel Consumption per Year
Without asymmetry Pre-Swirl Stator
With asymmetry Pre-Swirl Stator
Different
Monthly Breakdown
Total Fuel Consumed Total Fuel Consumed ∑HFO
(tones)
∑MDO (tones)
∑BOG (tones)
∑HFO (tones)
∑MDO (tones)
∑BOG (tones)
∑HFO (tones)
Jan 1678 0 2162 1588.90 0 2162 89.10
Feb 1435 0 1743 1358.80 0 1743 76.20
Mar 1919 30 1630 1817.10 30 1630 101.90
May 703 32 1510 666.62 32 1510 36.38
June 882 2 1755 783.09 2 1755 98.91
July 1062 21 2190 965.84 21 2190 96.16
Aug 1054 0 1494 884.40 0 1494 169.60
Sept 675 0 1895 633.48 0 1895 41.52
Oct 1519 20 2186 1335.13 20 2186 183.87
Nov 740 0 2393 689.34 0 2393 50.66
Dec 1578 0 2034 1493.26 0 2034 84.74
1029.04
Table 12 above indicates that by implementing the asymmetry pre-swirl stator on steam propulsion LNG carrier, the total fuel consumption can be reduced to 1029.04 tonnes per year.
Monitoring
Energy Efficiency Operational Indicator (EEOI) is a tool used to monitor the effect of implementing asymmetry swirl-stator on steam propulsion LNG carrier. The fuel consumption rate can be reduced by 5.31 %. By applying the value into the voyage profile data obtained [5], the Average EEOI for every month and for one year can be obtained. The results from the calculation are shown in Table 13.
Table 13: Average EEOI without asymmetry pre-swirl stator for one year [5]
Without Asymmetry Pre-Swirl Stator Monthly
Breakdown
Total Transport
Work (t. NM)
Total Emission
(tones)
EEOI average
( ×10-6) tons.CO2/
tons.NM January 322484207 11171 34.6 February 218043390 9262 42.51 March 214074982 8736 40.81
May 189969806 6600 34.74
June 146847269 7573 51.57 July 294254201 9397 31.94 August 82147870 7080 86.18 September 223289587 7313 32.75
October 258866002 10806 41.75 November 260472576 8885 34.11 December 229232112 10508 45.84
2439682002 97334 40.54
Table 14: Average EEOI with asymmetry pre-swirl stator for one year
With Asymmetry Pre-Swirl Stator Monthly
Breakdown
Total Transport
Work (t. NM)
Total Emission
(tones)
EEOI average
( ×10-6) tons.CO2/
tons.NM
January 322484207 10893.96 33.78 February 218043390 9025.10 41.39 March 214074982 10042.68 46.91
May 189969806 6228.61 32.77
June 146847269 7069.84 48.14
July 294254201 8659.26 31.23
August 82147870 6557.64 79.83 September 223289587 7164.90 32.41 October 258866002 10026.63 38.74 November 260472576 8592.89 32.99 December 229232112 9479.61 41.35
2439682002 93741.13 38.42
the same every year after the implementation of asymmetry swirl stator, and the value should maintain at 38.42 × 10⁻⁶tons.CO2/ tons. nm. As the ship continues to operate, the hull resistance will increase gradually due to the fouling and barnacles that growth on the surface of the hull, including the asymmetry pre-swirl stator. This situation will lead to the increase of the average EEOI value per year. If the difference in average EEOI per year is too much lower as compared to the average EEOI value per year before the implementation of the asymmetry pre-swirl stator, the ship will need to go for docking in order to undergo hull cleaning process so that the average EEOI and total saving of fuel per year can be maintained.
Self-Evaluation and Improvement
In this stage, for both weather routing optimisation and asymmetry pre-swirl stator, the monitoring data recorded in monitoring stage will be collected and assembled for further analysis. Analysis is done to deepen the understanding on the overall characteristics of the ship-specific measures that have been implemented on board the ship. The result from the analysis will be used during the evaluation period in order to make improvement during the next cycle of SEEMP. For example, the voyage profile data for the same period for the next year is collected and analysed, and the new average EEOI is calculated. The new average EEOI in one year is then compared with the average EEOI one year before the weather routing optimisation and asymmetry pre-swirl stator were implemented on board the ship. Nevertheless, several conditions might occur, as in Table 15.
Table 15: Example of data collection and analysis
Ship-Specific Measure
Condition
Weather routing optimisation
If the new average EEOI in one year is less than 5.23% as compared to the average EEOI in one year before, weather routing optimisation is implemented on board the ship.
Asymmetry pre-swirl stator
If the new average EEOI in one year is less than 5.23% as compare to the average EEOI in one year before, asymmetry pre-swirl stator is implemented on board the ship.
Table 15 shows the example of the condition that might occur during the self-evaluation and improvement stage of SEEMP. If the conditions occur as stated in the above table for weather routing optimisation and asymmetry pre-swirl
stator, respectively, it indicates that the efficiency of each ship-specific measure is reduced and the person in charge should take initial action by identifying the factors that contribute to the condition and figuring out the solution.
ECONOMIC EVALUATION OF IMPLEMENTING
SEEMP
The Initial Cost Of Steam Propulsion LNG
carrier
The initial cost of steam propulsion LNG carrier covers design and construction cost. Base on the thesis written by Siow Chee Loon on Design of High Performance Steam Propulsion LNG carrier, the initial cost are estimate as illustrate in the Table 16.
Table 16: The details of price for Steam Propulsion LNG carrier [6]
Components Description
Ship Price USD 170,300,000 Size of LNG carrier 140,000
Propulsion, Auxiliary and related equipment.
USD 32,500,000
Data Collection 2003
Table 16 shows the price for the basic items for steam propulsion LNG carrier. The size of the LNG carrier above is about 1.7 % smaller than the base ship of steam propulsion LNG carrier used in this project. Even though they are slightly different in size, the detail above can be applied in this project because the difference in size is insignificant and can be neglected.
Repair and Maintenance Cost
The data for repair and maintenance cost are illustrated Table 17.
Table 17 Detail of Repair and Maintenance Cost [6]
Components Description
Number of failure per year
10
Relative repair cost 0.5% x ship price Ship price USD 170,300,000 Repair cost per failure USD 851,500 Annual repair cost USD 8,851,000
Operating Cost
The operating cost is assumed to be the same as the conventional steam propulsion’s operating cost which is USD 83,325,680 per year [6].
Fuel Cost
Fuel cost per year is calculated based on the voyage data for one year and the result of the calculation is shown in Table 18.
Table 18: Fuel Cost for Conventional Steam Propulsion LNG carrier [6]
Distance between port 3500 n.m
Ship speed 19.5 knots(service)
Sailing time/sail 179.5 hours(7.5 days) Loading/unloading times 12 hours
Times per round trips 383 hours(16 days)
Services day/year 355
Total round trip per year 22
Fuel price 361 – 406 USD/ ton (select 384 USD/ton) [7]
BOG + Fuel oil consumption 3.838 tons/hours Fuel consumption per trip 2064 tonnes/trip
Fuel cost per trip 792,576 USD
Fuel cost per year 17,436,672 USD
As stated in Table 18, the total fuel cost per year for steam propulsion LNG carrier is 17,436,672 USD.
Salvage Value and Income per year
The salvage value and total income per trip are as shown in Table 19. The calculation is based on the total typical number of trip of the steam propulsion LNG carrier which is 22.
Table 19: Salvage Value and income per year [6]
Total trip per year 22
Income per trip 4,474,369 USD
Income per Year 98,436,118 USD
Salvage Value 20,704,504 USD
Economic Evaluation of Implementing SEEMP on Weather Routing Optimisation
The net present value (NPV) for both steam propulsion LNG carrier with and without weather routing optimisation on board of the ship have been calculated. The purpose of calculating NPV for both conditions is to determine which condition would give more profit in term of investment. The calculations of NPV for both
conditions are shown in Appendix F while the results from the calculation are shown in Table 20 and Figure 7 below.
Table 20: Comparison between Net Present Values (NPV)
i (%) NPV (without) Million USD
NPV (with) Million USD
0.25 1222.73 1225.35
1.00 1116.18 1118.60
2.00 990.86 993.05
3.00 882.04 884.03
Figure 7: Graph of comparison of NPV between steam propulsion LNG carrier with and without weather
routing optimisation
Table 20 and Figure 7 show the comparison between net present value (NPV) of steam propulsion LNG carrier with and without weather routing optimisation on board of the ship. From Figure 7, the NPV for steam propulsion LNG carrier with weather routing optimisation is more compared to steam propulsion LNG carrier without weather routing optimisation. This indicates that the implementation of weather routing optimisation is more profitable. However, the value of NPV decreases linearly as the interest increases. This situation proves that the profit received by implementing this ship-specific measure on board steam propulsion LNG carrier decreases and approaches zero as the interest increases.
Economic Evaluation of Implementing SEEMP
on Asymmetry Pre-Swirl Stator
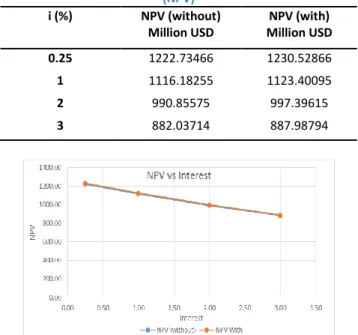
Table 21: Comparison between Net Present Values (NPV)
i (%) NPV (without) Million USD
NPV (with) Million USD
0.25 1222.73466 1230.52866
1 1116.18255 1123.40095
2 990.85575 997.39615
3 882.03714 887.98794
Figure 8: Graph of comparison of NPV between steam propulsion LNG carrier with and without asymmetry
pre-swirl stator
Table 21 and Figure 8 show the comparison between the net present value (NPV) of steam propulsion LNG carrier with and without asymmetry pre-swirl stator. From Figure 8, the NPV for steam propulsion LNG carrier with asymmetry pre-swirl stator is higher as compared to steam propulsion LNG carrier without asymmetry pre-swirl stator. This information indicates that the implementation of asymmetry pre-swirl stator is more profitable. However, the value of NPV decreases linearly as the interest increases. This situation proves that the profit received by implementing this device on board of steam propulsion LNG carrier decreases and approaches zero as the interest increases.
D
ISCUSSIONTechnical Evaluation
In this project, the technical evaluation is focused on the effect of implementing ship-specific measure, such as weather routing optimisation and asymmetry pre-swirl stator on steam propulsion LNG carrier, in terms of fuel consumption and EEOI. Implementation of weather routing optimisation on board the ship can reduce the total fuel consumption by 341.19 tonnes per year, as referred to the basic formulae of EEOI in Equation 1.
∑
(1)
Fuel consumption is proportional to EEOI. In short, when fuel consumption reduces, the EEOI will decrease. From the result of the calculation of the average EEOI per year in the previous chapter, average EEOI per year can be reduced by 1.2 % after weather routing optimisation is implemented. This indicates that the emission level of the steam propulsion LNG carrier in term of C production per cargo tonne-nautical mile can be reduced.
In comparison, for asymmetry pre-swirl stator, the total fuel consumption and percentage of average EEOI reduce per year are 1029.04 tonnes and 5.23%, respectively.
In short, the implementation of both ship-specific measures gives benefits in technical part, in term of total fuel consume and average EEOI reduce per year, while the implementation of asymmetry pre-swirl stator on board the ship gives more benefits compared to the weather routing optimisation.
Economic Evaluation
In this study, economical evaluations have been done for both implementation of weather routing optimisation and asymmetry pre-swirl stator. The results show that the net present value of both implementations is higher compared to the net present value of steam propulsion without weather routing optimisation and asymmetry pre-swirl stator implemented on board the ship. This situation indicates that the investment made on the implementation of both ship-specific measures is profitable. The payback period for implementation of weather routing optimisation is 2.33 years while the payback period for asymmetry pre-swirl stator is 2.32 years.
CONCLUSION
The project has been completed by firstly identifying the approach in order to improve the typical steam propulsion LNG carrier efficiency in terms of reducing the ship’s emission and EEOI. After identifying the approach that is possible to be implemented on board of the ship, the parameters in order to implement SEEMP are determined. The next step is to follow the guidelines published by IMO, MEPC.213 (63) regarding the development of Ship Energy Efficiency Management Plan (SEEMP). There are four main stages in developing SEEMP which are planning, implementing, monitoring and self-evaluation. The entire steps have been tested for weather routing optimisation and asymmetry pre-swirl stator.
Technical evaluation of implementing weather routing optimisation and asymmetry pre-swirl stator has been discussed extensively in this paper. The technical evaluation in this project takes into consideration the fuel consumption and EEOI after the plan has been executed. In comparison, the economic evaluation has been assessed by using the net present value in order to determine which condition is more profitable.
REFERENCES
[1] MEPC.213 (63), IMO 2012 Guidelines for the Development of A Ship Energy Efficiency Management Plan (SEEMP) [2 March 2012] [2] Chieh, T. W. 2014. Implementing Energy Efficiency
Operational Indicator (EEOI) On LNG Carrier.
(
Master’s thesis).[3] Chen, H. 2014. Voyage Optimisation Supersedes Weather Routing, Jeppesen Marine, 2014.
(Doctoral thesis).
[4] MEPC.58/INF 21, MARINE ENVIROMENT PROTECTION COMMITTEE Prevention of Air Pollution from Ship [1 August 2008]
[5] Chun, H. H. 2014. Hull Efficiency Hull/appendage development and integrated power/energy system diagnostic/evaluation technology,Global Care Research Center for Ships and Offshore Plants, Pg 21-25
[6] Loon, S. C. 2012 Design of High Performance Steam Propulsion System For an LNG carrier. [7] Bunker world, bunker price: IFO380, available
![Figure 1: Route plotted on a navigation chart using Jeppesen C-Map Professional Chart [3]](https://thumb-us.123doks.com/thumbv2/123dok_us/8011286.2122908/2.892.474.785.356.467/figure-route-plotted-navigation-chart-jeppesen-professional-chart.webp)
![Table 13: Average EEOI without asymmetry pre-swirl stator for one year [5]](https://thumb-us.123doks.com/thumbv2/123dok_us/8011286.2122908/6.892.113.410.872.1146/table-average-eeoi-asymmetry-pre-swirl-stator-year.webp)
![Table 16: The details of price for Steam Propulsion LNG carrier [6]](https://thumb-us.123doks.com/thumbv2/123dok_us/8011286.2122908/7.892.463.794.902.1022/table-details-price-steam-propulsion-lng-carrier.webp)
![Table 18: Fuel Cost for Conventional Steam Propulsion LNG carrier [6]](https://thumb-us.123doks.com/thumbv2/123dok_us/8011286.2122908/8.892.472.785.209.555/table-fuel-cost-conventional-steam-propulsion-lng-carrier.webp)