T
he fourth section of the core data survey focused on networking, methods of remote access, bandwidth shaping, videoconferencing capabilities on campus, deployment of new technologies, and practices related to network security.Network Speed and Shaping
The core data survey requested data about the bandwidth available from a campus to the commodity Internet and to high-speed net-works. Table 4-1 shows the distinct patterns that characterize bandwidth availability to the Internet by Carnegie groups for responding institutions. Doctoral schools have signifi-cantly more total bandwidth than MA, BA, and AA colleges, and master’s institutions reported significantly more total bandwidth than AA and BA schools. The mean total bandwidth available to the commodity
Internet from campus increased significantly among ALL institutions in the matched data set, up to an average of just over 350 Mbps, an increase of about 15% since last year. Increases were also found within all Carnegie groups, with doctoral institutions up 37%, BA institutions up 32%, AA institutions up 18%, and MA institutions up 6%.
Looking at access to high-performance net-works from campuses, Table 4-2 shows that total bandwidth available is related to Carnegie group. The greatest access was reported by doctoral institutions, most likely due to the large data sets, visualization, and other applications needed by faculty at such institutions for their academic work. About 60% of the MA institutions and about 70% of the AA and BA colleges responding to our sur-vey provide no access whatsoever to such net-works. From the 2004 to the 2005 survey, the
FOUR
Networking, Advanced Technologies,
and IT Security
Bandwidth ALL DR MA BA AA OTHER
0 Mbps 0.1% 0.0% 0.0% 0.0% 0.6% 0.0% More than 0–4.5 Mbps 10.0% 0.5% 5.4% 11.4% 24.5% 12.0% 4.6–12 Mbps 15.8% 1.1% 16.1% 21.7% 28.8% 11.3% 12.1–44 Mbps 23.9% 5.5% 30.7% 40.8% 16.6% 21.8% 45–89 Mbps 18.1% 15.9% 25.3% 18.5% 17.2% 8.5% 90–154 Mbps 11.4% 20.3% 10.7% 3.3% 7.4% 16.2% 155–299 Mbps 9.1% 25.8% 4.2% 1.1% 3.1% 14.1% 300–999 Mbps 3.8% 13.7% 2.3% 0.0% 0.0% 2.8% 1,000 Mbps or more 7.8% 17.0% 5.4% 3.3% 1.8% 13.4% Table 4-1
total bandwidth available to high-perform-ance networks increased significantly among ALL institutions in the matched data set to nearly 406 Mbps, a 41% increase, with signif-icant increases for doctoral institutions (45%) and BA schools (65%).
Shaping bandwidth refers to adjusting parameters on the campus Internet connec-tion to limit use through various means, such as type of connection, location of connection, direction of traffic, time of day, or other specif-ic characteristspecif-ics. A campus may choose to shape bandwidth to ensure that the down-loading of large files does not interfere with the basic operational needs of the campus and that the bandwidth is available when faculty and students need it for their academic work.
As seen in Table 4-3, about 6% of ALL cam-puses report not tracking or shaping band-width at all, but this percentage is elevated by the high percentage of AA colleges (over 14%) reporting no such practices. The dominant
strategy of AA colleges appears to be tracking by utilization, with this group reporting much less use of shaping strategies than the other Carnegie groups. The most popular shaping strategy overall is shaping by the type of net-work traffic, with AA institutions nonetheless using this strategy far less than doctoral, MA, and BA institutions. Only about 10% of AA institutions reported shaping by time of day compared to more than one-third of BA col-leges, and only about 23% of these institutions reported shaping by direction compared to 65–70% for doctoral, MA, and BA schools. Nearly 74% of doctoral institutions reported shaping by location, the highest percentage of all groups for this type of shaping.
In looking at the matched data set, there was an increase overall in the past year in the per-centage of schools that track bandwidth utiliza-tion (from about 62% to nearly 68%). In addi-tion, there was a significant increase in shaping of every kind, for every type of institution.
Practice ALL DR MA BA AA OTHER
Track bandwidth utilization
67.1% 65.9% 65.6% 64.1% 69.9% 71.8% Shape by time of day 26.5% 29.7% 33.6% 37.0% 10.4% 14.1% Shape by location on
campus
51.8% 73.6% 66.8% 59.2% 14.1% 29.6% Shape by type of traffic 73.4% 77.5% 84.0% 88.6% 46.6% 59.9% Shape by direction 54.6% 70.3% 64.1% 71.2% 23.3% 31.0% Do not track or shape 6.2% 2.2% 3.4% 4.3% 14.1% 9.9%
Bandwidth ALL DR MA BA AA OTHER
0 Mbps 51.2% 9.3% 60.5% 72.8% 69.3% 38.7% More than 0–4.5 Mbps 3.2% 0.0% 1.9% 3.8% 6.7% 4.9% 4.6–12 Mbps 5.3% 2.2% 6.5% 3.8% 8.6% 4.9% 12.1–44 Mbps 4.5% 3.3% 6.1% 4.3% 3.7% 4.2% 45–89 Mbps 9.2% 13.7% 10.7% 8.7% 5.5% 5.6% 90–154 Mbps 4.6% 10.4% 5.0% 0.5% 2.5% 4.2% 155–299 Mbps 6.0% 22.0% 1.9% 0.5% 1.8% 4.9% 300-999 Mbps 3.0% 9.9% 1.9% 0.0% 0.0% 3.5% 1,000 Mbps or more 13.0% 29.1% 5.4% 5.4% 1.8% 28.9%
Total Bandwidth Available to High-Performance Networks from Campus
Table 4-3
Remote and Wireless Access
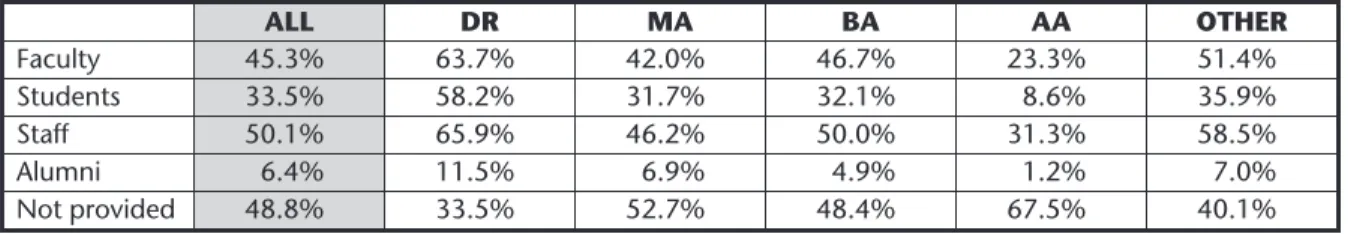
Providing remote access to the Internet and to campus networks is critical to serving faculty and students who live off campus. The survey asked about a number of commonly used meth-ods of providing such access to four constituen-cies: faculty, students, staff, and alumni. Internal modem pool access is differentially employed for various constituencies, as shown in Table 4-4, with the greatest access provided to faculty and staff and considerably less to stu-dents. Only 6.4% of ALL respondents make such access available to alumni. The percentage of institutions reporting that remote access is pro-vided via an internal modem pool decreased significantly from the 2004 to the 2005 survey for faculty, students, and staff. This is the third year in a row with such decreases, indicating that campuses seem to be moving away from this method of providing remote access.
Table 4-5 shows the percentage of schools providing remote access to faculty in various ways. Providing access to faculty via an
inter-nal modem pool, the strategy employed by about 45% of ALL responding campuses, is the most common method employed. About 4% reported providing access by an outsourced modem pool, with approximately 14% pro-viding access via ISPs with an institutionally arranged discount and 5.5% providing subsi-dized ISP accounts. This year, a new option was added to determine the percentage of campuses that are employing virtual private network (VPN) connections, irrespective of the type of connectivity. About 55% of ALL respon-dents indicated that they employ VPNs.
The growth of wireless network access on campuses is striking. The 2005 core data sur-vey captured detailed data (far too great to include in this summary report) about the extent of penetration of wireless into eight specified areas of the campus: classrooms, libraries, open spaces, research facilities, administrative buildings, public laboratories, student unions, and residence halls. In gener-al, there is wide variation as to the level of
ALL DR MA BA AA OTHER Faculty 45.3% 63.7% 42.0% 46.7% 23.3% 51.4% Students 33.5% 58.2% 31.7% 32.1% 8.6% 35.9% Staff 50.1% 65.9% 46.2% 50.0% 31.3% 58.5% Alumni 6.4% 11.5% 6.9% 4.9% 1.2% 7.0% Not provided 48.8% 33.5% 52.7% 48.4% 67.5% 40.1%
Level of Remote Access Provided via an Internal Modem Pool to Various Constituencies
ALL DR MA BA AA OTHER
Modem pool 45.3% 63.7% 42.0% 46.7% 23.3% 51.4% Outsourced modem pool 4.1% 8.2% 3.8% 2.2% 1.8% 4.2% Institutionally arranged
discount with ISP
13.6% 25.8% 11.5% 8.7% 7.4% 15.5% Subsidized ISP accounts 5.5% 4.9% 3.8% 6.5% 4.9% 8.5% State academic network 21.1% 31.9% 25.2% 8.7% 16.6% 21.1% Regional academic
network
12.6% 25.3% 9.5% 6.0% 4.9% 19.7% Virtual private network
(VPN)
54.7% 71.4% 53.4% 50.5% 39.3% 58.5%
Table 4-5
deployment of wireless across these categories and across Carnegie groups. Overall, the high-est level of penetration is found in libraries, with nearly 70% of ALL respondents reporting that 76–100% of their libraries provide wire-less access, up nearly 13% from last year, and up nearly 28% over the last two years. Wireless access is least available in residence halls, open spaces, and research facilities.
Videoconferencing Capabilities
Videoconferencing capabilities were report-ed by all campus types, but about 18% of ALL responding campuses do not have any sites (excluding desktop videoconferencing) from which interactive conferences can be initiated, with that case being most common for BA institutions (about 39%). In addition, the level of penetration varied immensely by Carnegie class, as seen in Table 4-6. More doctoral insti-tutions reported availability of these facilities, with about 19% of respondents in this catego-ry having more than 20 such sites.
In addition to central sites for videoconfer-encing, respondents were asked about the per-centage of desktops that could deploy video-conferencing. The same pattern was found as with central sites, with doctoral institutions having the most such capability, followed by OTHER and MA institutions. As seen in Table 4-7, about 40% of BA schools reported not having a single machine with such capability. Deployment of New Technologies
This year’s core data survey explored the level of deployment of 16 technologies that are currently hot topics of conversation within the higher education IT community. This question carried over 11 technologies from last year and added 5 new technologies: antispyware soft-ware, IPTV (Internet Protocol television), per-sonal firewalls, tokens, and two-factor author-ization. Data for these technologies are presented in Tables 4-8 through 4-23.
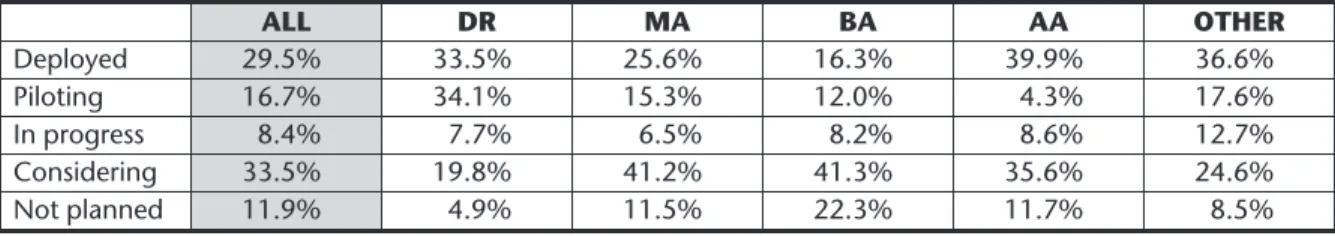
As shown in Table 4-8, voice-over-IP (VoIP) technology is being fully deployed at 29.5% of
% of Desktops ALL DR MA BA AA OTHER 0% 28.9% 5.5% 30.2% 40.8% 38.7% 30.3% Up to 19% 48.3% 57.1% 48.5% 40.8% 46.6% 48.6% 20–39% 6.9% 13.2% 5.3% 6.0% 6.1% 3.5% 40–59% 4.2% 8.2% 5.0% 3.3% 1.2% 2.1% 60–79% 2.5% 3.8% 1.5% 2.7% 1.2% 3.5% 80–100% 9.2% 12.1% 9.5% 6.5% 6.1% 12.0% Number of Sites ALL DR MA BA AA OTHER 0 17.9% 1.1% 18.3% 39.1% 14.7% 14.8% 1 15.1% 1.1% 14.5% 32.6% 13.5% 13.4% 2 12.9% 6.0% 14.9% 12.5% 18.4% 12.0% 3 11.3% 7.7% 13.7% 6.5% 14.1% 14.1% 4–5 12.3% 15.4% 14.1% 2.7% 16.0% 13.4% 6–10 16.2% 28.6% 16.8% 4.9% 14.1% 16.2% 11–20 7.6% 20.9% 5.0% 1.1% 3.7% 8.5% More than 20 6.8% 19.2% 2.7% 0.5% 5.5% 7.7%
Number of Campus Sites from Which Interactive Videoconferencing Can Be Initiated
Table 4-7
ALL responding campuses, a significant increase since last year, and there was also a significant increase in the deployment of VoIP since last year for all Carnegie groups except BA institutions.
Video-over-IP technology is employed to a much higher extent than VoIP, as shown in Table 4-9. About 43% of ALL campuses report-ed having deployreport-ed this technology, with the highest use by doctoral institutions and lowest use at BA institutions. Associate’s colleges are second highest in reporting use of this advanced technology, probably in large part due to their innovative use of technology in teaching and learning. The use of this technol-ogy increased since last year across all groups. The use of public key infrastructure (PKI) is interesting to note, as this technology may well be critical in the deployment of campus
security policies and practices. As seen in Table 4-10, deployment of PKI is still in the early stages of diffusion, despite the amount of cam-pus discussion and numbers of conference pre-sentations on this topic. There was virtually no change in the level of deployment, piloting, or progress in deployment of PKI since last year, the third straight year of no movement on use of this technology.
Doctoral institutions use enterprise directo-ry technology more than the other types of institution, but as of this year, more than 58% of ALL responding institutions are using it. Such a directory is essential for the authenti-cation and authorization efforts required in PKI. As shown in Table 4-11, the vast majority of respondents in all groups have already deployed it, are in the process of implement-ing it, or are considerimplement-ing it.
ALL DR MA BA AA OTHER Deployed 29.5% 33.5% 25.6% 16.3% 39.9% 36.6% Piloting 16.7% 34.1% 15.3% 12.0% 4.3% 17.6% In progress 8.4% 7.7% 6.5% 8.2% 8.6% 12.7% Considering 33.5% 19.8% 41.2% 41.3% 35.6% 24.6% Not planned 11.9% 4.9% 11.5% 22.3% 11.7% 8.5%
Status of Voice-over-IP Technology
ALL DR MA BA AA OTHER Deployed 16.1% 16.5% 10.7% 17.4% 22.7% 16.2% Piloting 5.1% 8.2% 3.1% 3.3% 4.9% 7.7% In progress 6.9% 8.8% 7.3% 5.4% 5.5% 7.0% Considering 33.0% 46.2% 39.3% 19.6% 19.0% 38.0% Not planned 38.9% 20.3% 39.7% 54.3% 47.9% 31.0% ALL DR MA BA AA OTHER Deployed 42.8% 56.0% 43.9% 22.8% 49.1% 42.3% Piloting 10.8% 17.0% 8.4% 10.9% 6.1% 12.7% In progress 9.9% 8.8% 13.0% 4.9% 8.6% 13.4% Considering 23.5% 13.7% 24.8% 31.0% 22.7% 24.6% Not planned 13.1% 4.4% 9.9% 30.4% 13.5% 7.0% Table 4-9
Status of Video-over-IP Technology
Table 4-10 Status of PKI Technology
There is still very little deployment of bio-metric technology on campuses, which includes use of fingerprints, retinal scans, or other physiological means of user identifica-tion for security purposes. Over 67% of ALL responding campuses are not even planning for this technology (see Table 4-12).
As shown in Table 4-13, the deployment of smart cards was reported most by doctoral institutions and least by AA institutions. Only about 15% of ALL responding institutions reported deployment of smart card technolo-gy, and more than 44% reported that this tech-nology is not planned.
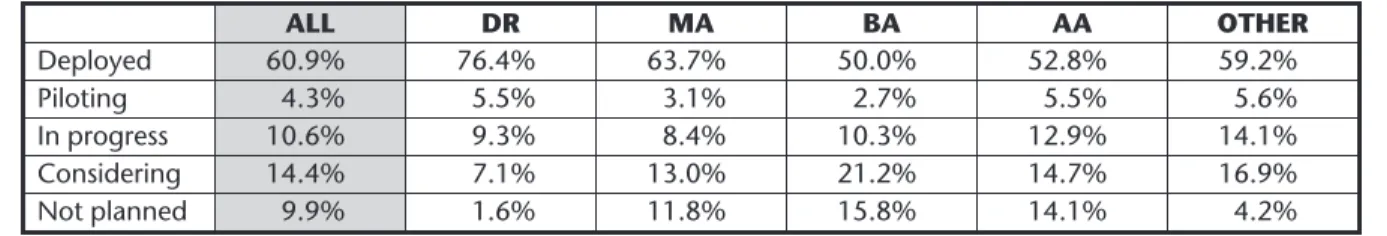
Web services technology refers to a set of tools and building blocks for system develop-ment. As shown in Table 4-14, this technology is relatively advanced at a large percentage of institutions overall and within each Carnegie
class. Over 76% of doctoral institutions have deployed Web services technology, and anoth-er 14.8% are piloting it or have it in progress. Among MA, BA and AA colleges, 63.7%, 50.0% and 52.8%, respectively, have deployed this technology, and about another 11%, 13%, and 18% of these institutions, respectively, are piloting this technology or have it in progress. While the status of the various technologies discussed thus far has differed considerably across Carnegie groups, antivirus software was reported to be deployed at 99.6% of ALL responding institutions. Table 4-15 shows the remarkable consistency and high level of deployment of antivirus software across all types of institutions.
Like biometrics, electronic signature tech-nology is not particularly common in higher education institutions across all groups, as
ALL DR MA BA AA OTHER Deployed 58.3% 75.8% 55.3% 54.3% 45.4% 61.3% Piloting 3.4% 3.8% 3.1% 3.8% 4.3% 2.1% In progress 15.2% 13.7% 17.6% 14.7% 16.6% 12.0% Considering 14.1% 4.9% 14.1% 13.0% 21.5% 19.0% Not planned 8.9% 1.6% 9.9% 14.1% 12.3% 5.6%
Status of Enterprise Directory Technology
ALL DR MA BA AA OTHER Deployed 15.2% 23.1% 13.4% 16.3% 8.6% 14.8% Piloting 2.0% 3.8% 1.9% 1.1% 0.0% 3.5% In progress 5.6% 4.4% 5.3% 3.3% 7.4% 8.5% Considering 32.8% 35.2% 35.5% 26.6% 35.0% 30.3% Not planned 44.4% 33.5% 43.9% 52.7% 49.1% 43.0% ALL DR MA BA AA OTHER Deployed 3.9% 8.2% 4.2% 0.5% 1.2% 4.9% Piloting 4.2% 5.5% 5.0% 3.3% 2.5% 4.2% In progress 2.0% 4.4% 2.3% 1.6% 0.6% 0.7% Considering 22.7% 30.8% 22.9% 15.2% 21.5% 23.2% Not planned 67.2% 51.1% 65.6% 79.3% 74.2% 66.9% Table 4-12
Status of Biometric Technology
Table 4-13
shown in Table 4-16. Again, the percentage of campuses at which such technology has been deployed, is in the pilot stage, or is otherwise in progress is greatest for doctoral institutions, at about 34%, followed by approximately 23% and 21% of MA and OTHER colleges, respec-tively. This technology is not planned at 34% of ALL institutions; however, the percentage of schools considering using electronic signatures
is greater than the percentage not planning for this technology at all types of institutions except BA schools, nearly half of which report-ed no plans to implement.
Table 4-17 shows the status of wireless secu-rity technologies to be particularly advanced at doctoral institutions, with nearly 75% reporting having deployed this technology and less than 1% reporting no plans for
imple-ALL DR MA BA AA OTHER Deployed 8.3% 14.3% 6.5% 6.0% 6.7% 8.5% Piloting 5.7% 10.4% 6.5% 2.7% 2.5% 5.6% In progress 8.0% 8.8% 10.3% 6.0% 6.7% 7.0% Considering 44.1% 43.4% 45.4% 37.5% 47.2% 47.2% Not planned 34.0% 23.1% 31.3% 47.8% 36.8% 31.7% ALL DR MA BA AA OTHER Deployed 99.6% 99.5% 99.6% 100.0% 99.4% 99.3% Piloting 0.1% 0.5% 0.0% 0.0% 0.0% 0.0% In progress 0.3% 0.0% 0.4% 0.0% 0.6% 0.7% Considering 0.0% 0.0% 0.0% 0.0% 0.0% 0.0% Not planned 0.0% 0.0% 0.0% 0.0% 0.0% 0.0% ALL DR MA BA AA OTHER Deployed 60.9% 76.4% 63.7% 50.0% 52.8% 59.2% Piloting 4.3% 5.5% 3.1% 2.7% 5.5% 5.6% In progress 10.6% 9.3% 8.4% 10.3% 12.9% 14.1% Considering 14.4% 7.1% 13.0% 21.2% 14.7% 16.9% Not planned 9.9% 1.6% 11.8% 15.8% 14.1% 4.2%
Status of Web Services Technology
Table 4-15
Status of Antivirus Software
Table 4-16
Status of Electronic Signatures
ALL DR MA BA AA OTHER Deployed 62.4% 74.7% 65.6% 57.6% 45.4% 66.2% Piloting 8.3% 10.4% 6.5% 6.0% 11.0% 8.5% In progress 16.1% 12.6% 13.7% 16.3% 22.1% 17.6% Considering 11.9% 1.6% 11.8% 18.5% 20.2% 7.0% Not planned 1.4% 0.5% 2.3% 1.6% 1.2% 0.7% Table 4-17
mentation. Another 23% of doctoral schools are piloting this technology or have it in progress. About two thirds of MA and OTHER colleges have deployed wireless security tech-nologies, as have about 45% of AA institu-tions, the lowest percentage among the Carnegie classes. There was a significant leap in deployment of this technology since last year’s survey, with an approximately 12% increase in deployment overall, and about a 27% increase over the past two years. There were significant increases in deployment of this technology at institutions of all types.
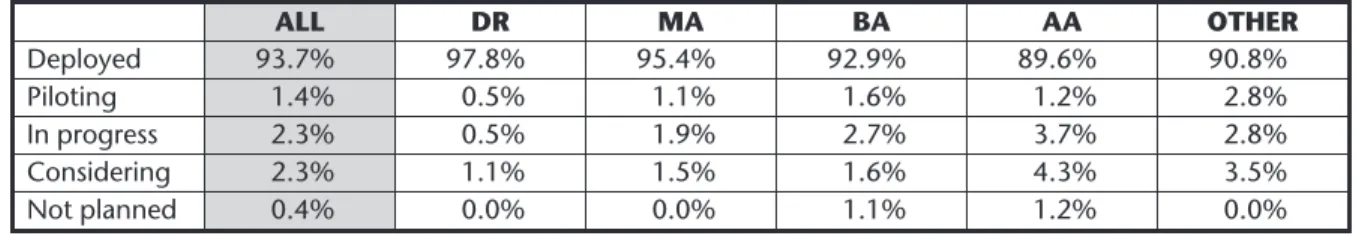
The spam plague that all of our campuses have unfortunately suffered has resulted in almost universal adoption of antispam tools, with nearly 94% having deployed this tech-nology and virtually no campuses not plan-ning to do so, as shown in Table 4-18. There
were no notable differences across the Carnegie groups in adoption of this technology.
This year a new technology was added to the survey to determine the status of deploy-ment of antispyware software. The data shown in Table 4-19 indicate that over three-fifths of ALL campuses have deployed this software, with only 4% not planning to do so. There were no significant differences in adoption patterns across the various Carnegie types. Clearly this is a technology that has been readily embraced in a very short period of time.
Another new technology added to the 2005 survey was Internet Protocol television (IPTV). As seen in Table 4-20, this technology is in the very early stages of adoption with only about 6% of ALL campuses having deployed IPTV and 63% having no plans to do so. It should be noted, however, that there is a
significant-ALL DR MA BA AA OTHER Deployed 93.7% 97.8% 95.4% 92.9% 89.6% 90.8% Piloting 1.4% 0.5% 1.1% 1.6% 1.2% 2.8% In progress 2.3% 0.5% 1.9% 2.7% 3.7% 2.8% Considering 2.3% 1.1% 1.5% 1.6% 4.3% 3.5% Not planned 0.4% 0.0% 0.0% 1.1% 1.2% 0.0%
Status of Antispam Tools
ALL DR MA BA AA OTHER Deployed 6.1% 7.7% 6.1% 2.7% 8.6% 5.6% Piloting 3.5% 7.7% 3.1% 1.1% 1.8% 4.2% In progress 2.9% 3.8% 2.7% 2.2% 4.9% 0.7% Considering 24.4% 41.8% 22.5% 20.1% 17.2% 19.7% Not planned 63.0% 39.0% 65.6% 73.9% 67.5% 69.7% ALL DR MA BA AA OTHER Deployed 62.3% 59.9% 64.5% 68.5% 64.4% 50.7% Piloting 6.3% 7.1% 8.0% 4.3% 3.1% 8.5% In progress 9.5% 9.3% 9.5% 8.2% 8.0% 13.4% Considering 17.9% 20.3% 14.5% 15.2% 20.2% 21.8% Not planned 4.0% 3.3% 3.4% 3.8% 4.3% 5.6% Table 4-19
Status of Antispyware Software
Table 4-20 Status of IPTV
ly different pattern within the Carnegie groups, as doctoral institutions reported a greater level of piloting or considering this technology compared to other groups, with a significantly lower percentage of DR institu-tions not planning to implement IPTV.
As with other measures related to security, the use of personal firewall software appears to have been readily embraced. As shown in Table 4-21, over 40% of ALL campuses have deployed this technology, but since this was a new technology added to this year’s survey, no trends are possible to determine. Again, with this technology there is a more active pattern of adoption in doctoral institutions, with fewer of these campuses having no plans to deploy personal firewalls.
Another new technology added to the sur-vey was use of tokens to authenticate users to systems or networks. As shown in Table 4-22, only about 5% of ALL campuses have deployed token technology, with over two-thirds of campuses indicating that they have no plans to do so. However, a significantly greater percentage of DR institutions have deployed or are considering deployment—and conversely a significantly smaller percentage have no plans to deploy—than the other Carnegie groups.
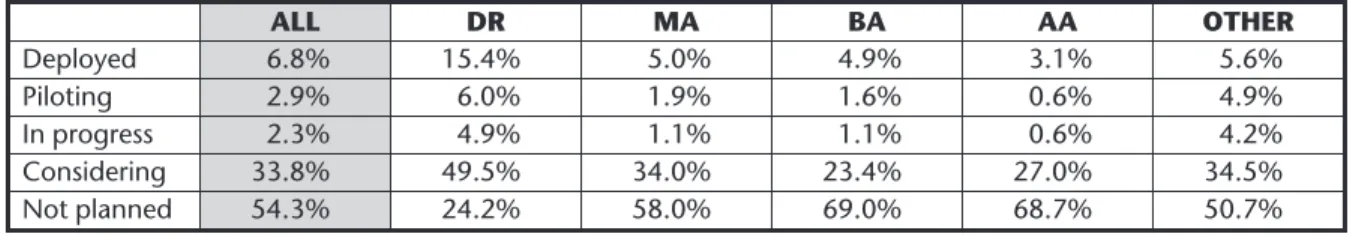
Finally, looking at one other new technolo-gy added to the survey this year, that is, two-factor authentication, Table 4-23 shows a pat-tern similar to that noted for tokens, with this technology being in the early stages of adop-tion. Again, doctoral institutions are more aggressively deploying, piloting, in the process of deploying, and considering deployment of this technology than the other types of institutions.
Security
The final area of analysis in this section is security, including the processes being used to secure campuses from disruptions of service, incursions, and other security breaches. Perhaps the most common type of security protection being used by responding campus-es is a firewall. However, experience has shown that a single firewall is not adequate for security because many of the individuals who provide a threat to security are students and personnel who work and operate within the environment protected by the firewall. Table 4-24 shows various strategies currently being employed and their relative frequency within each of the Carnegie groups.
Overall, fewer than 1% of ALL respondents have no firewalls, with the most common
ALL DR MA BA AA OTHER Deployed 5.0% 14.8% 3.4% 1.6% 1.2% 4.2% Piloting 1.9% 3.3% 1.5% 1.6% 0.0% 3.5% In progress 1.4% 2.7% 0.8% 0.0% 0.6% 3.5% Considering 22.7% 35.7% 22.5% 15.8% 17.8% 21.1% Not planned 68.9% 43.4% 71.8% 81.0% 80.4% 67.6% ALL DR MA BA AA OTHER Deployed 41.3% 52.2% 41.2% 44.0% 33.7% 32.4% Piloting 2.9% 2.2% 2.7% 1.6% 1.8% 7.0% In progress 6.8% 11.5% 5.3% 4.3% 3.7% 9.9% Considering 16.2% 19.8% 17.6% 13.0% 16.0% 13.4% Not planned 32.9% 14.3% 33.2% 37.0% 44.8% 37.3%
Status of Personal Firewall Software
Table 4-22
strategy being the deployment of a firewall at the external Internet connection (88.4%). This is true for a very large percentage of schools in all categories except doctoral institutions, which more often reported deploying firewalls around high-security servers and by or for individual departments.
Table 4-25 shows the patterns and use of software patches and other practices to ensure security on campus. Far and away the most common practice is requiring all critical sys-tems to be expeditiously patched or updated, with more than 96% of ALL respondents reporting this practice and no significant dif-ferences among Carnegie groups.
The second most common practice is requir-ing campus-owned or -leased computers to be expeditiously patched or updated, with about 87% of ALL respondents reporting this prac-tice. Conducting proactive scans to detect known security exposures in critical systems is the third most common practice, with over
three-fourths of ALL respondents reporting this. The least reported practice is conducting proactive scans to detect known security expo-sures in all personally owned computers con-nected to the campus network, reported by about 38% of ALL respondents.
The survey asked if the respondent campus has actually undertaken an IT security risk assessment. As seen in Table 4-26, more than 58% of ALL campuses responded in the affir-mative, up from 52% last year. Looking at the Carnegie groups, some significant differences are apparent. More than 80% of responding doctoral institutions reported having under-taken risk assessments, an increase of 10% for this group and a much higher percentage than the other Carnegie groups over last year’s survey. More than half of the BA and AA respondents reported not having conducted such an assessment.
A new question on this year’s survey addressed the deployment of end-user
authen-ALL DR MA BA AA OTHER Deployed 6.8% 15.4% 5.0% 4.9% 3.1% 5.6% Piloting 2.9% 6.0% 1.9% 1.6% 0.6% 4.9% In progress 2.3% 4.9% 1.1% 1.1% 0.6% 4.2% Considering 33.8% 49.5% 34.0% 23.4% 27.0% 34.5% Not planned 54.3% 24.2% 58.0% 69.0% 68.7% 50.7%
Status of Two-Factor Authentication
ALL DR MA BA AA OTHER
Firewall at external Internet connection
88.4% 66.5% 95.0% 93.5% 94.5% 90.8% Firewalls around certain
high-security servers or networks 67.7% 95.1% 70.6% 53.3% 47.9% 69.0% Firewalls deployed by or on behalf of individual departments 36.5% 83.5% 32.1% 14.1% 15.3% 38.0% Campus site license for a
personal firewall product
19.1% 25.3% 20.2% 13.6% 14.1% 21.8% Plan to implement one or
more firewalls
18.3% 34.1% 16.8% 8.2% 12.3% 21.1% No firewalls 0.3% 0.0% 0.4% 0.5% 0.6% 0.0%
Table 4-24
ALL DR MA BA AA OTHER
All critical systems expeditiously patched or updated 96.4% 96.7% 98.5% 97.3% 94.5% 93.0% Campus computers expeditiously patched or updated 87.1% 77.5% 92.4% 87.5% 88.3% 88.0% Personal computers expeditiously patched or updated 51.2% 58.8% 58.8% 57.6% 24.5% 50.0% Proactive scans in critical
systems
77.4% 90.1% 78.2% 74.5% 65.0% 77.5% Proactive scans in campus
computers connected to the network
64.2% 73.6% 66.4% 56.5% 57.1% 66.2% Proactive scans in PCs
connected to the network
38.4% 56.6% 42.7% 39.7% 17.8% 28.9% Security system includes
intrusion detection system
57.6% 80.2% 58.8% 45.7% 45.4% 55.6% Security-Related Practices ALL DR MA BA AA OTHER Yes 58.3% 80.2% 58.8% 42.4% 47.9% 62.0% No 41.7% 19.8% 41.2% 57.6% 52.1% 38.0% Table 4-26
Campus IT Security Risk Assessment
ALL DR MA BA AA OTHER
Currently require end-user authentication for all network access
53.8% 44.0% 59.2% 54.3% 54.6% 54.9% In process of
implementing end-user authentication
requirement for all network access
13.6% 14.3% 14.1% 15.2% 12.9% 10.6%
Planning to require end-user authentication for all network access
12.6% 14.3% 11.1% 9.2% 16.0% 14.1% Considering end-user
authentication requirement for all network access
12.6% 17.6% 9.9% 15.2% 9.2% 12.0%
No plans for requiring end-user authentication for all network access
6.0% 7.7% 4.2% 6.5% 8.0% 4.2% Other 5.4% 7.1% 3.4% 3.8% 4.9% 9.2%
Table 4-27
ponent of overall security strategies. The results shown in Table 4-27 (previous page) indicate that over half of ALL respondents require such authentication for all network access. Another 26.2% of ALL campuses are either in the process of implementing this requirement or are planning to do so, with an additional
dents had no plans for such a requirement. There were no significant differences in respons-es across Carnegie typrespons-es. (Note that since respondents were permitted to enter an expla-nation into the “other” field on the survey instrument as well as checking one of the stages of deployment, the totals exceed 100%.)