Supply Chain Resilience 2012. Copyright © 2012 The Business Con nuity Ins tute. All Rights Reserved. 1
Supply
Chain
Resilience
2012
4th Annual Survey
Published November 2012
Supported by:
Supported by: An international survey of more than 530 organisations from Supported by:
over 65 countries, which considers the origin, causes and
consequences of supply chain disruption, along with proven
Contents
03
Execu ve
summary
04
Introduc on
05
Experience
of
disrup on
09
Supply
chain
con nuity
14
Business
con nuity
in
tendering
and
contrac ng
19
Review
and
conclusions
21
About
the
survey
22
About
the
BCI,
CIPS,
Zurich
&
DHL
Supply
Chain
26
Annex
1:
Wri en
comments
by
survey
respondents
15
Geographical
and
sector
perspec ves
18
Lesson
learned
and
key
challenges
32
Annex
2:
Full
sector
and
geographical
data
Introduc on
This survey is the fourth in a series, star ng
back in 2009, that sets out to consider the
challenge of developing resilient supply
chains.
Key
Findings
73% of survey respondents experienced at
least one disrup on with an average of
five. This high level is consistent with the
trend‐line over the past four years
39% of analysed disrup ons originated
below the immediate er one supplier,
underscoring for the second consecu ve
year the deep‐rooted nature of disrup on
Unplanned IT or telecom outages jumped
to the top of sources of disrup on with
52% affected to some or a high degree.
The level was 41% in 2011
Adverse weather maintained its prominent
posi on with 48% ci ng it as a cause of
disrup on, but rela vely unchanged from
51% in 2011
Failure of service provision by outsourcing
suppliers has doubled from 17% to 35% of
disrup on and joins the top three causes
21% suffered more than €1M in costs for a
single incident; higher than 2011 and in
spite of lower overall levels of disrup on
59% cited loss of produc vity as the
primary impact of the disrup on
experienced, up from 49% in 2011. Across
all indicators there was a deepening on
impact experienced with an average of
three dis nc ve consequences per incident
25% of respondents have s ll to consider
supply chain disrup on in their business
con nuity programmes, and 44% of
respondents have weak supply chains,
while major sector differences persist
especially in manufacturing and retail and
between countries such as the UK and USA
While 47% now look for evidence of a
business con nuity programme over a
simple plan and 23% run joint exercises—
all improvements on 2011—15% s ll do
not collect any informa on from key
suppliers, and 41% do not validate that key
supplier plans might work in prac ce
42% stated the biggest on‐going challenge
is to secure buy‐in to implement supply
chain con nuity prac ces in their firm
Review
&
Conclusions
Since 2009 consistently high levels of supply
chain disrup ons have been experienced and
events are becoming more consequen al
even with absolute levels dipping a er 2011,
a year, which saw the Great East Japan
Earthquake and extensive flooding in
Thailand.
Business con nuity is widely seen as effec ve
in resis ng the impact of disrup on, alongside
its core benefits of enabling con nuity and
faster recovery from incidents.
The drama c rise in disrup on through
outsourcer service failures requires further
study into service chains and the specific
challenges inherent in them.
Given the dominance of supply chain
disrup on through unplanned IT or telecom
outages, there is now a need to evaluate the
contribu on of “the cloud” to resilience.
The challenge of securing execu ve buy‐in
requires an understanding of the broader
trends driving supply chain vulnerability and
its disrup on. In this way it will become
possible to demonstrate that high levels of
disrup on are not going to go away, however
fragile corporate memory may be.
Introduc on:
73%
experienced
at
least
one
disrup ve
supply
chain
incident
with
an
average
of
fi
ve
This report is the fourth in a series that,
star ng in 2009, set out to consider the
challenge of developing resilient supply chains.
While we have con nued to track trends in
supply chain disrup on, mi ga on and
assurance methods employed, the 2012 survey
is re‐focused on events that cause at least
some if not high levels of disrup on, rather
than disrup on in general, much of which can
be dealt with as part of business as usual.
When reviewing the results it is naturally
important to consider the profile of the
respondents: In this case 82% of respondents
work “in‐house” i.e. they are employed to run
business con nuity, supply chain or risk
programmes with 18% providing consul ng
services in these domains. The organisa ons
responding are typically large ones—42%
employ between one thousand and fi y
thousand staff and 12% employ more than fi y
thousand people.
The 2012 survey has also achieved a stronger
balance of views from across risk, business
con nuity and supply chain professionals.
Finally, we asked respondents to ar culate the
tough challenges where they are s ll to find an
answer, insights which inform the Business
Con nuity Ins tute’s thinking on next steps.
So, what do we mean by supply chain? Here is
a reprise of the defini on that we first used in
2011 (Christopher 2005):
The network of organisa ons that are involved,
through upstream and downstream rela
on-ships, in the different processes and ac vi es
that produce value in the form of products and
services in the hands of the ul mate consumer.
The headline figure for disrup on in the 2012
survey is that 73% of responding organisa ons
experienced at least one disrup on in the
previous 12 months, with an average level of
five incidents. In 2011, supply chains were
widely disrupted by the Great East Japan
Earthquake and flooding in Thailand causing a
jump to 85% in the deadline disrup on figure
and peaking above the established trend‐line,
to which we have now returned.
It is also worth no ng that only one in four
firms have the full picture on supply chain
disrup on, which would be achieved by record‐
ing, measuring and repor ng on performance‐
affec ng supply chain disrup ons across the
whole enterprise. For 75% of respondents, this
is therefore not the case, so the level of
disrup on recorded here is likely to be an
underes mate of actual levels, albeit major
disrup ons are likely to be picked up across
company boundaries.
We hope this year’s survey provides some new
insights and would welcome your feedback.
Chart 1: How many supply chain incidents would you es mate your organisa on experienced in the past 12 months that caused disrup on to your organisa on?
Origin of disrup on
Following on from providing informa on on
the number of disrup ve incidents
experienced in the last 12 months, those who
had experienced disrup on were asked
whether they had analysed the original source
of the disrup on within their supply chain. The
ques on specifically asked whether the disrup‐
on occurred with the immediate supplier ( er
one) or their supplier ( er two), or much lower
down in the supply chain ( er three or four
etc). 87% of respondents to this ques on were
able to provide an analysis of the source of dis‐
rup on as seen in Chart 2.
61% of disrup on originated with the
immediate supplier according to this year’s
survey meaning that 39% originated in the
extended supply chain ( er two, three, etc).
This level of disrup on is consistent with levels
reported in 2011, and confirms the deep‐
rooted nature of disrup on. The
comments suggest that buying
organisa ons take it upon them‐
selves to scru nise their extended
supply chain rather than rely on
their immediate supplier to audit
their suppliers in turn, which would
be an alterna ve method of
addressing a difficult challenge.
“We reach to the original source of
the supply chain to minimize
contamina on to produce high
purity products. When suppliers of
original source are hired, we have
excep onal confidence they are not
contamina ng”
“While we don’t rou nely analyse
the full supply chain, I was able to review three
of the disrup ons that I was made aware of
and found one to be an immediate supplier
failure and two to be er two”
Causes of disrup on
When considering causes of disrup on in the
2012 survey, we refined the main ques on to
dis nguish between disrup on that caused
some impact from disrup on that had high
impact in order to qualify the severity of the
disrup on. The results in Chart 3 show the
totals of each threat type experienced over the
previous 12 months.
Overall some 1,200 causes of disrup on were
reported with 301 of them designated as high
impact. The top five causes by high impact
represent 42% of severe events.
Unplanned IT or telecom outages are the most
commonly experienced source of some or high
levels of disrup on with 52% of responding
organisa ons selec ng this op on. Adverse
weather drops from first place in the 2011
survey to second place in 2012 at 48%.
Failure in service provision by an outsourcer
reaches the top three with 35% sta ng they
experienced some impact or high impact from
Experience
of
Disrup on
such an event. This is a significant increase
from the 17% level recorded in 2011.
In 2011, we wrote that intellectual property
viola ons was one to watch and this has
proved to be the case in jumping to 16th place
above cyber a ack, industrial dispute
and act of terrorism with 11% and 26
responses compared with 25th place
in 2011 with just five responses.
Other significant climbers included
energy scarcity in sixth place (14th in
2011) and new laws/regula ons in
seventh place (17th in 2011).
Cyber threats tend to score highly in
horizon scanning and the media, so it
is interes ng to note the low levels of
disrup on actually experienced: only
16% of respondents recorded severe
or some supply chain disrup on as a
result of a cyber threat, ranking it 18th
on the list of threats experienced by
severity out of 25, and 14th by
number of incidents registered. What
is notable is the concentra on of this
disrup on in the financial services
sector, which claimed 41% of incidents
recorded. The finding suggests that this threat
has a strong sector bias rather than one for all ‐
data from 2009, 2010, and 2011 support this
conclusion as well.
The prominence of earthquake/tsunami in the
list underscores the extended recovery mes
faced by some organisa ons following the
2011 disaster.
Loss of talent/skills has slipped in 2012 from
sixth posi on down to tenth. The London 2012
Chart 3: How severely has your supply chain been aff
ect-ed by any of the following sources of disrup on over the past 12 months? Severity levels can be considered in terms of ini al impact, ability to con nue to deliver key products and services and recovery me, as well as the consequences on brand and reputa on. Base: 227
Olympics registered as a source of disrup on at
the UK level but not in the overall interna onal
survey.
Consequences of disrup on
When comparing 2012 with 2011 data on the
consequences arising from disrup ons, the first
observa on is an increased level of responses
across all 14 poten al areas of impact. As can
be seen from Chart 4, loss of produc vity is s ll
the primary consequence, with 59% checking
this in 2012 compared with 49% in 2011.
Increased cost of working, loss of revenues,
customer complaints all increased over 2011
levels. Product release delay jumped from 17%
in 2011 to 26% in 2012. Further down the list,
the jump in payment of service credits (from
1% to 9%) mirrors the prominence of
outsourcer failures among the top three
sources of disrup on. Incidents forcing a
product recall or withdrawal also increased
from just 5% in 2011 to 11% in 2012. As
iden fied in 2011, longer term impacts are be‐
ing experienced more frequently with damage
to brand reputa on increasing from 17% to
24% in this year’s survey.
Overall the survey recorded 741 impacts from
215 respondents. Of the 195 survey
respondents who experienced ‘1‐5’ disrup ve
events, 18 stated they endured six or more
consequences (9%), i.e. evidence that there is
more than one consequence from a single
event. Events which lend themselves to this
cascading effect are unplanned telecom/IT
outages, outsourcer failure, loss of talent/skills
and currency vola lity.
Economic consequences
One in five responding organisa ons had
suffered a single loss event of more than €1M
in the past 12 months up from 2011, when 17%
registered a similar magnitude of loss. This
increase is noteworthy given the overall lower
level of disrup on experienced in this year’s
survey, sugges ng an increase in the
Chart 4: Which of the following impacts or consequences arose from the incidents/ disrup ons experienced in the last 12 months? Base 215.
consequen al nature of supply chain
disrup on.
The aggregate annual figure could clearly be
higher given that the average level of incidents
experienced was five.
It is worth comparing the single loss event
against the annual revenues of organisa ons to
understand the significance of the event.
Considering the 29 cases where this
comparison can be made the average (mean)
minimum loss is €8M but there is significant
varia on. For example, three firms experienced
a single event loss between €1M and €10M on
annual revenues of €1M to €10M indica ng a
significant bo om line hit. While another
suffered a loss of between €51M and €100M
on annual revenues greater
than €50BN. The economic
consequences will therefore
be subject to further study.
One ques on that arises is
around the profile of those
organisa ons suffering a
single event loss of more
than €1M. Are these firms
simply laggards in terms of
business con nuity?
The answer is, in fact, quite
the opposite.
Firstly, the affected organi‐
sa ons were much larger
ones than the survey
average with 58%
employing more than
10,000 employees and 49% had revenues in
excess of €1BN (compared with 23% and 22%
respec vely in the overall sample). Larger
organisa ons tend to have business con nuity
programmes, even if they are not labelled as
such.
These organisa ons do have more key
suppliers than the average with 43% recording
more than 100 key suppliers compared with
the survey average of 23%, indica ng increased
complexity and higher need for assurance
resources.
What is also clear is that those affected had
stronger business con nuity programmes with
63% having BC in place for supply chain
disrup on, and a more rigorous approach was
taken across all assurance methods (more on
the criteria will follow in the following sec on
of the report).
Most noteworthy is that in spite of the
economic hit over the past 12 months, this
group is convinced that business con nuity has
helped them resist the impact of disrup on
(63%) and helped with con nuity and recovery
(96%).
Chart 5: Considering the single most significant incident in the last 12 months what was the approximate
financial cost (loss of revenue and/ or increased cost of working)? Please give your response in EUROs. Base:182
Does your business con nuity programme
consider supply chain disrup on?
When asked whether the responding
organisa on had business con nuity (BC)
arrangements in place to deal with supply
chain disrup on only 58% stated that this was
the case with 25% sta ng they definitely did
not and a further 17% not knowing.
For those with BC in place for their supply
chain (237) a series of follow up ques ons
were asked. The first was to consider three
business con nuity benefit statements and
rate their strength of agreement with each
one based on a scale from strongly agree
through to strongly disagree (refer to Chart 6)
The conclusion is that BC is an essen al
component of supply chain resilience, as more
than 90% agree it delivers the capability of
faster recovery and the capability to con nue
to deliver key products and services. There is
less agreement about BC allowing survey
respondents to resist any impact of
disrup on, but even so, s ll more than 60%
agree with the statement.
As the supplier base for larger organisa ons
can number hundreds if not thousands of
companies, the next logical step is to seek to
understand supplier BC arrangements. This
can be a daun ng task, even assuming
resources are available to do so. The BCI
Partnership has published separate guidance
on how to perform the task of iden fying key
supply chain partners from among the wider
supply base in a separate paper available to
download from the BCI website. In the case
of this survey, 77% of responding
organisa ons had less than 100 key suppliers,
a level which is felt to be a manageable one.
The survey found that 77% of survey
respondents who have BC themselves took
the step of asking their key suppliers whether
they had business con nuity arrangements in
place for their own needs. 16% did not ask
this ques on.
The response to this ques on provides an
insight into the state of supply chain resilience
across a wide range of sectors (and beyond
Supply
Chain
Con nuity—
25%
of
in
‐
house
BC
programmes
do not
consider
supply
chain
disrup on
Chart 6: If you have BCM arrangements in place for your supply chain, how strongly would you agree with the following statements? Base: 237 (only those with BCM could respond to this ques on).
the BCI’s membership). This can be viewed in
Chart 7 below.
In 2012 we can see that 55% of survey
respondents have key supply chains where at
least half of the companies that comprise these
supply chains do have business con nuity in
place for their own needs. However, 44%
have much weaker supply chains, where less
than half have BC arrangements in place. In
the sector and country analysis that follows
later in this report, the strength of supply
chains is one of the key indicators for
comparison. Nevertheless, we can report that
their has been a modest strengthening of
supply chains compared with 2011.
Another new dimension in the 2012 survey was
to consider not just upstream supply chain but
also the presence of BC arrangements
downstream among channels, distributors,
franchisees etc. Here 17% ensured that all
have BC in place, while 50% focus on the key
channel partners. 19% do not take this step,
leaving a major vulnerability in the end‐to‐end
business con nuity picture.
Building confidence
In order to understand what the presence of
BC arrangements among the key supplier base
may mean in prac ce, the survey looked at the
informa on requested from key supply chain
partners, how this informa on was collected
and subsequently validated and reviewed.
These steps are clearly essen al in developing
a sense of confidence in the resilience of
supply chains. Naturally the picture that is then
developed may require one or more subse‐
quent ac ons. Within the survey, we asked
about the measures taken to deal with any
uncertainty generated from feedback from key
supply chains.
Informa on sought by survey respondents
As set out in Chart 8 (overleaf) the most
popular ques ons to ask relate to the existence
Chart 7: Considering your key suppliers, what percentage of them would you say have business con nuity arrangements in place to address their own needs?
of a business con nuity programme (47%),
whether its scope is appropriate (44%) and rel‐
evant to the product or service being pur‐
chased (44%). This may seem obvious but in
earlier surveys the focus was on the business
con nuity plan rather than the overall
programme. In 2011 only 28% of respondents
were looking for the BC programme.
Standards and codes of prac ce play an
important role in assessing the resilience of key
suppliers with 37% and 36% respec vely
looking for alignment or compliance.
Cer fica on lags behind on 28%.
One area with a significant increase from 2011,
is asking where responsibility for BC is held in
the organisa on and the involvement of senior
management. This clearly provides evidence of
the level of commitment behind the BC
programme. In 2011 the figure was just 23%
but has jumped to 36% in this year’s survey.
The least likely ques on to ask is around the
creden als of those who run the BC
programme, such as statutory membership of
the BCI, which would seem to be a cri cal one
given the programme can only be as effec ve
as the people assigned to deliver it. Only 18%
asked this ques on, albeit this level has
doubled from 2011.
How is the informa on collected?
51% of survey respondents required copies of
supplier documenta on, up frac onally from
48% in 2011. The self‐assessment ques on‐
naire retains its popularity in second place with
45% of respondents selec ng this op on, while
there has been a rise from 37% to 42% of those
who will retrieve informa on through audit.
Reques ng an independent audit is s ll the
least popular op on among those who collect
informa on at 9%, down from 12% in 2011.
15% s ll do not collect any informa on,
implying it is good enough for the supplier to
just state they have business con nuity in
place.
“We do not ask to see their BCP but rather we
ask that they state whether they have a BCP
and will only award the contract to those who
have a BCP for key contracts”
There were a significant number of comments
to illustrate approaches taken, which are listed
in Annex 1, but four are quoted here to reflect
the range of approaches undertaken:
“Ini al ques onnaire followed up with further
ques ons, mee ngs and site visits as
appropriate to nature of the service being
supplied”
“We would ask them to set out their BCM plans
in response to par cular scenarios”
Chart 8: What informa on do you seek in order to be er understand the business con nuity management (BCM) arrangements of key suppliers? Base 200.
“We personally visit each key supplier each
year and if they have presented any significant
problems then have moved to audit them”
“Ac vi es may be performed by various
disciplines , for example, internal audit,
depart-ment-level vendor managers and procurement”
Valida ng that plans may work in prac ce
The crucial step of valida ng whether plans
and inten ons might be effec ve in prac ce is
s ll one that 41% do not take. The good news
is that this level has fallen from the 49% figure
registered in 2011.
A number of op ons were offered to respond‐
ents and naturally most would use a variety of
techniques depending on the assigned
cri cality of the supply chain partner. The
most popular selec on was to request
documented outcome reports and ac ons
plans following recent exercises conducted by
the supplier. 40% chose this op on, up from
34% in 2011. Another angle on the same
technique is to approve the scope of tests in
advance and sign‐off all post‐test reports, this
was used by 11% of respondents. Holding a
workshop with a key supplier or running a desk
‐top exercise were techniques used by 16% of
respondents, unchanged from 2011. One area
that has grown in popularity is the running of
joint exercises based around likely scenarios,
which was selected by 23% of respondents
compared with just 17% in 2011.
One respondent summarises the challenge and
benefit of valida ng supplier planning:
“The extent we get involved does depend on
risk, coopera on and rela onships. Most key
suppliers are open to close engagement and
see the opportunity of shared learning and
improved longer term rela onships and
resilience”
Reviewing requirements
One of the biggest changes in the 2012 survey
comes in the sec on on reviewing require‐
ments. Given the frequency of change within
organisa ons, it seems highly likely that
priori es, scope and resources around business
con nuity programmes may change more
frequently than key supplier contracts.
Likewise new threats or opportuni es may
arise that need to be considered within an
organisa on and through its supply chain.
In the 2012 survey, 44% of respondents s ll
wait un l contract renewal before reviewing
their business con nuity requirements with
key suppliers and their ability to meet them.
This has increased from 37% in 2011.
Having said this, only 8% never review,
significantly down from 18% in the 2011
survey. Likewise ad hoc mee ngs have dipped
from 24% in 2011 to 21% in 2012. Scheduled
review mee ngs with key suppliers at
appropriate me intervals as part of an exis ng
governance process has jumped to 40% from
31% in 2011, providing a good example of
embedding BC in the organisa on.
Three more dynamic op ons are less popular,
namely reviewing business con nuity
whenever there is a major change event at the
buyer (21%) or supplier end (20%), and
whenever a new significant external threat is
iden fied (20%).
Again comments received provide some clues
into how prac oners approach this issue:
“We plan to develop a schedule, but have not
at this me. We have inadequate staffing to
“Contracts are usually for three years, we audit
at the start of the contract and mid term”
“Our concerns tend to be greater on companies
that are smaller with less public informa on
available”
“On an annual basis we select four cri cal
suppliers for capability assessment”.
Seeking alignment and adap ng
The next logical step is to check whether the
BC plans of the supplier would help you. In the
survey we termed this alignment. As BC
programmes are organised around the
objec ves and priori es of the supplying firm,
it is important for the buying firm to
understand where it fits in the picture should
an event occur. It is quite common for
organisa ons to priori se between services
and hence customers in terms of con nuing
and restoring impaired ac vi es. In prac cal
terms being able to respond that you have
been largely successful, i.e. most key suppliers
are aligned, would seem to be a good result. In
2012, 23% could state this while a further 6%
stated all of their key suppliers were aligned.
The number who had not tried alignment was
14%, down from 24% in 2011, which again is a
posi ve trend.
When key suppliers do not, cannot or will not
meet alignment needs, then respondents will
typically take a number of ac ons as set out in
Chart 9. 48% of respondents are keen to work
with the supplier where there is a will on the
other side to improve. Fewer in 2012 just
accept the risk at 26%, down from 39% in 2011.
Bringing an addi onal supplier on board has
become more popular at 38% (2011: 31%).
Insurance or risk transfer is consistently one of
the least chosen op ons at 5%.
Comments from respondents illustrate the
choices available:
“A er iden fying vulnerabili es, we implement
mi ga on programs, generally around mul
-sourcing”
“Un l we find a more cost effec ve solu on, we
are using inventory to decouple our supply
capability from our supplier”
End of sec on.
Being asked about BC in tendering
Results show that more organisa ons are being
requested to provide evidence of their business
con nuity arrangements when tendering for
new business. The figure for those receiving
this request for the majority if not all tenders
has increased from 28% to 33%. Mirroring this
increase, the number who stated they are
rarely, if at all asked to provide such evidence
has fallen from 24% to 19%. Comments from
respondents suggested the trend was driven by
major global customers, the banking and
financial sector, the healthcare sector and large
automo ve manufacturers.
Among those not seeing a customer pull are
retailers and local authori es, the emergency
services and regulated monopoly service
providers, who either do not seek to win
business or whose customers don’t have the
buyer power to ask for evidence of BC
programmes (i.e. consumers).
BC involvement in procurement processes
When considering the involvement of business
con nuity prac oners in the procurement
process, there is s ll a long way to go. 51%
stated that business con nuity featured as an
integral part of the procurement process from
the start, a modest improvement on 47% in
2011, but a significant minority either ignore
business con nuity or make it a post‐purchase
ac vity. However, the comments from
respondents are more encouraging, sugges ng
that this is one area of intense ac vity, so we
should see future improvements on this
indicator. Here’s one example:
“Increasingly BCM is becoming an integral part
of the procurement process and in some cases
a key upfront objec ve. There are s ll
occasions where parts of the business make
purchasing decisions before engaging on BCM,
though the frequency is fast reducing”
Business
Con nuity
in
Tendering
and
Contrac ng
Processes
Chart 10: When tendering for new business
clients over the past 12 months, how o en have
you had to provide assurance to clients that your
own business con nuity arrangements are
sufficient? Base: 207
Chart 11: Does business con nuity feature
as part of your supplier contractual
Geographical
and
Sector
Perspec ves
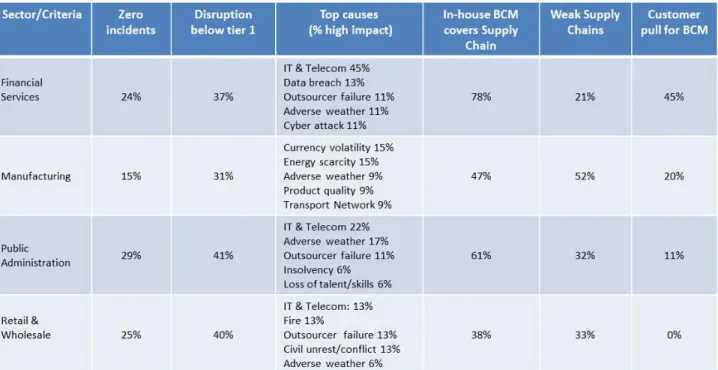
Sector comparisons
Table 1 provides a comparison of selected
industry sectors to highlight the significant
varia on in terms of disrup on, preparedness
and customer pull. A full sector lis ng is
available in Annex 2.
The criteria for comparison are as follows:
The level of incidents reported with a focus
on those repor ng “zero”
The origin of the disrup on in terms of ers,
with a focus below er one
The top five causes of disrup on by levels of
high impact
The number who state their internal BCM
programme considers supply chain
disrup on
And two further measures:
The strength of supply chains, where the
percentage against “weak supply chains”
refers to how many respondents have key
suppliers where less than half have BC
programmes in place for their own needs
Customer pull, where this means the
frequency with which evidence of BC is
requested in tendering for new business, and
the percentage relates to those who do so
every me or the majority of mes
The financial services sector is more advanced
than other sectors in terms of extending BC
programmes to consider their supply chain at
78% and their key supply chains are stronger
than other sectors, confirming a head‐start in
the introduc on of supply chain con nuity.
This sector also stands out for having to
provide evidence of their BC programme in
tendering, with 45% having had this experience
in the past 12 months.
Given the high reliance on technology it is not
surprising to see IT and telecom outages as the
leading source of disrup on in financial
services coupled with informa on and cyber
security threats.
Manufacturing serves as a good contrast,
experiencing high levels of disrup on rela ve
to others (85% experienced at least one
disrup on) and a different range of disrup ve
events consistent with the sector. At 47%
fewer in‐house BC programmes consider
supply chain partners than in financial services
and those that have addressed this issue face a
major challenge with their supply base—52%
of respondents in manufacturing concede that
less than half of their key supply chains have
business con nuity for their own needs (let
alone any a empt at alignment). It is also
evident that to date there has been a low level
of customer pull to change this situa on at
20%.
With public administra on, we would not
expect to see a high level of customer pull but
there are o en statutory requirements that
drive BC programmes. The range of sources of
disrup on provides some contrast with
outsourcer failure, insolvency and loss of talent
or skills causing disrup on. Policy changes for
public administra ons to move to shared
service models and private sector providers
may well be exposing organisa ons in this
sector to these threats.
The retail and wholesale sector does not have
their customers reques ng evidence of BC
arrangements before making a purchase, and
it’s good that the survey confirms this long
standing assump on. It’s also consistent with
the nature of the sector that their supply chain
may be affected by riots or civil disturbances as
these tend to occur in city centres. The sector
does stand out from others for the lack of
in‐house BC programmes considering supply
chain disrup on at just 38%.
Geographical comparisons
There is significant varia on in maturity with
respect to considering supply chain disrup on
within in‐house BC programmes when viewed
on a geographical basis. Respondents from the
UK and USA form a substan al part of the
survey response and therefore lend themselves
to comparison (Annex 2 provides a fuller
geographical breakdown of responses).
The UK sample is drawn from 14 different
sectors with 28% from financial services, 16%
from public administra on, 11% from
professional services and IT/communica ons
and transport/storage each sharing 7%. 80%
experienced at least one disrup on and 33%
found the disrup on originated in the
extended supply chain. The London 2012
Olympics registered as one of the top five
causes of some or high impact disrup on and
was ahead of industrial ac on but some way
behind IT and telecom outages and adverse
weather. The UK stands out from other
countries in considering supply chain
disrup on within BC programmes with 75%
confirming this compared with just 44% of US
respondents and similar levels in Australia,
New Zealand and Canada. The UK also differs
from other countries in respect of customer
pull for the provision of informa on around
business con nuity in tendering processes,
where 34% stated that they typically have to
do this compared with 23% in the US. The US
sample in this survey was also drawn from 14
sectors, however manufacturing was the lead
sector in terms of response at 18% with retail/
wholesale at 13% and financial services at 13%.
The US respondents reported lower levels of
disrup on and the top threat profile reflects
the different mix in sectors with product
quality incident and lack of credit featuring
prominently.
Although the US respondents may lag on
considering supply chain business con nuity,
those that do are slightly ahead of the UK and
other countries in terms of having stronger
supply chains, i.e. more than 50% of key supply
chain partners have BC arrangements, and they
are less likely to wait for contract renewal
before reviewing their business con nuity
requirements with their key suppliers.
Looking beyond these two countries to a
broader regional picture, we see that the
region which experienced most disrup on was
the Middle East & Africa where 78%
experienced at least one disrup on. 70% of
respondents from con nental Europe and
Central & La n America experienced at least
one disrup on, while respondents in Asia
experienced a quieter year with 43%
registering “zero incidents”. There is a
significant difference in threats when viewed
on a regional basis with energy scarcity and
exchange rate vola lity domina ng in Middle
East & Africa, while IT and telecom was the
primary source of disrup on in con nental
Europe.
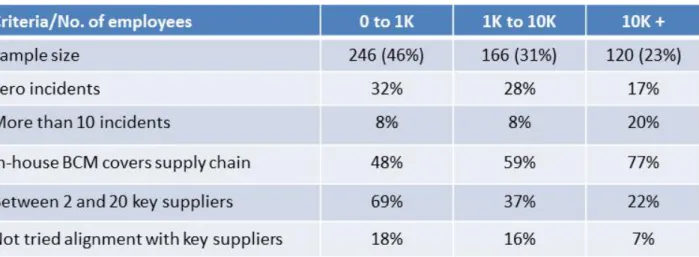
Comparison by organisa onal size
The size of an organisa on also has an impact
on the experience of disrup on and business
con nuity approach as Table 3 shows. The
results are consistent with expecta ons— the
larger the organisa on, the greater the
likelihood of experiencing disrup on. 20% of
firms with more than ten thousand staff
experienced more than ten incidents compared
with 8% in smaller sized en es. Larger
organisa ons are also more developed in
considering business con nuity for the supply
chain and more likely to have tried to align
their requirements with their key supply chain
partners.
End of sec on.
“Assurance from suppliers can only go so far. A
plan for dealing with the effects of a disrup on
is needed, even if the supplier’s business
con nuity arrangements are extremely robust”
Survey respondents felt the main lesson to be
taken away from the disrup on they
experienced was to improve their approach to
business con nuity in terms of risk assessment,
mi ga on efforts, planning and exercising.
“The plans we have in place and work we’ve
done with suppliers have helped an cipate
incidents, proac vely plan our response,
communicate to stakeholders and minimise
impact. Several years ago this would not have
been the case”
Specific ac ons taken over the past 12 months
can be divided into three broad areas of
ac vity: More analysis, securing new policies
or introducing new processes, and taking the
extra step of running joint workshops or
exercises with partners, the la er generated
some very posi ve outcomes:
“Joint exercises with key suppliers and
observing their exercises. These really focus
the minds and the general improvement in
exercising is reassuring”
Some changes in procurement policy were also
required including moving away from single
source (where possible), making provision for
alterna ve suppliers, transport routes and
payment methods, and introducing buffer
stocks.
“We have amended tender packs to request
details of suppliers’ BCM. We have introduced
a consistent ra ng methodology to assess
supplier cri cality in line with our own BIA
process”
The top 10 challenges (see Table 4) are led by
two related subjects in the sense that resource
and budget availability in larger organisa ons,
where most respondents are, is really a ma er
of priority and buy‐in and not a lack of people
or funds. Beyond these leading factors, there
is a wide range of issues to be addressed, in
some cases it would warrant a re‐evalua on of
the strategy. For more comments, please
refer to Annex 1.
Table 4: Base: 167 respondents provided free-form responses
Since 2009 consistently high levels of supply
chain disrup on have been experienced and
events are becoming more consequen al even
with absolute levels dipping a er 2011, a year
which saw the Great East Japan Earthquake
and extensive flooding in Thailand.
One area for further work is a be er
understanding of the cascading nature of risks
and their consequences in supply chain
con nuity. The research in 2012 has iden fied
that there are mul ple consequences from the
same event.
A number of non‐tradi onal business
con nuity risks have registered in this year’s
survey, most notably disrup on caused by
exchange rate vola lity. Applying business
con nuity exper se specifically around
con ngency planning presents an excellent
opportunity for prac oners to provide a more
valuable service to their organisa ons. One
other risk type also became more visible,
namely disrup on caused by intellectual
property viola ons, and this deserves further
analysis.
The drama c rise in disrup on through
outsourcer service failures requires further
study into service chains and the specific
challenges inherent in them.
Given the dominance of supply chain
disrup on through unplanned IT and telecom
outages, there is now a need to evaluate the
contribu on of “the cloud” to resilience.
The challenge of securing execu ve buy‐in
requires an understanding of the broader
trends driving supply chain vulnerability and its
disrup on. In this way it will become possible
to demonstrate the trend is not going to go
away, however fragile corporate memory may
be.
More work is also required to understand the
economic impact of supply chain disrup on
including the value of investment in raising the
level of resilience in key supply chains.
This la er work will help support the challenge
of unlocking resources through execu ve
commitment. In addi on, the broader trends
that are driving supply chain vulnerability and
hence disrup on need to be be er
understood.
One useful next step from this research would
be to develop an assurance model that would
allow a calibrated response to the ques on
“how confident are you in the resilience of our
key supply chains?”
Another business con nuity specific
perspec ve to track is whether the new
interna onal business con nuity standard ISO
22301 will make efforts to seek alignment
easier and thereby contribute to improved
resilience.
The good news for business con nuity
professionals is that the BC methodology is
widely seen as effec ve in resis ng the impact
of disrup on, alongside its core benefits of
enabling con nuity and faster recovery from
incidents. Good prac ce is documented in
abundance in the survey and there is li le
excuse for not trying out some of the ideas.
The value of moving from a documenta on
centric approach for evalua ng supply chain
resilience to one based on ac ve engagement
and joint exercises is also clear. In closing, let’s
not find ourselves in the situa on that one
person did:
“A major failure that impacted our customers
drew management a en on to the issue. It
took a $4million (US) loss to get any a en on.”
Respondent
Profile—base
532
Chart 14: Geographical loca on
Chart 13: Primary ac vity of the organisa on
Chart 16: Size of organisa on by revenues
or budget (public sector): 460 respondents
Chart 12: Func onal role
Chart 15: Size of organisa on by number of
Fieldwork for the 4th Annual Supply Chain Resilience Survey commenced on 22nd June and closed on 31st August 2012 with
532 responses validated. All members of the Business Con nuity Ins tute received an individual email invita on to complete
the online survey. This was complemented by the Chartered Ins tute of Purchasing and Supply invi ng its members to
contribute through their exis ng communica on methods. In addi on, support is acknowledged from the following people
and organisa ons:
Chartered Ins tute of Logis cs & Transport
AIRMIC
Colin Ive MBCI and the BRiSC community
Buyers Mee ng Point
Kuniyuki Tashiro MBCI for transla ng the survey into Japanese.
We would like to thank Zurich Insurance Group for sponsoring this research for the fourth successive year and DHL Supply
Chain for joining them for a second year.
We would also like to thank the BCI Partnership Working Party on Supply Chain Con nuity under Steve Wicks MBCI, and the
wider BCI Partnership Steering Group for their support in the development of the survey.
Author: Lee Glendon CBCI, Head of Research & Advocacy, The Business Con nuity Ins tute
Reviewers: Lyndon Bird FBCI, Technical Director, The Business Con nuity Ins tute. Deborah Higgins MBCI, Technical &
Learning Manager, The Business Con nuity Ins tute
About
The
Business
Con nuity
Ins tute
Based in Caversham, United Kingdom, the Business Con nuity Ins tute
(BCI) was established in 1994 to “promote the art and science of business
con nuity management” and to assist organisa ons in preparing for and
surviving minor and large‐scale man‐made and natural disasters. The
Ins tute enables members to obtain guidance and support from their
fellow prac oners, as well as offers professional training and cer fica on
programmes to disseminate and validate the highest standards of
competence and ethics. It has over 7,000 members in more than 100
countries, ac ve in an es mated 2,500 organisa ons in private, public and
third sectors. For more informa on go to: www.thebci.org
The BCI Corporate Partnership, established in 2007, offers corporate
membership of the BCI with over 90 member organisa ons including: Aon
Risk Consul ng, BAE Systems, BP, BSI Management Systems, BT,
ClearView Con nuity, Con nuitySA, Con nuity Shop, DHL Supply Chain,
DNV Business Assurance, eBay, eBRP Solu ons, Hill Dickinson, iAgenci,
IBM, Itau‐Unibanco, KPN Corporate Market, LRQA, Link Associates, Milton
Keynes Council, Na onal Grid, Phoenix, Pruden al, PwC, Reed Elsevier,
Royal Mail, Savant, T‐Systems, VocaLink and Zurich Insurance Group.
To join as a corporate member, go to: www.bcipartnership.com
Business
Con nuity
Business Con nuity (BC) is the capability of the organisa on
to con nue delivery of products or services at acceptable
predefined levels following a disrup ve incident.
Business Con nuity Management (BCM) is a holis c
management process that iden fies poten al threats to an
organiza on and the impacts to business opera ons those
threats, if realized, might cause, and which provides a
framework for building organiza onal resilience with the
capability of an effec ve response that safeguards the
interests of its key stakeholders, reputa on, brand and
value‐crea ng ac vi es.
Source: ISO22301:2012
Contac ng
the
BCI
Lee Glendon CBCI, Head of Research & Advocacy
The Business Con nuity Ins tute
10‐11 Southview Park, Marsack Street
Caversham, RG4 5AF, UK.
Phone: +44 (0) 118 947 8215
About
The
Chartered
Ins tute
of
Purchasing
&
Supply
The Chartered Ins tute of Purchasing & Supply (CIPS) is the world’s largest procurement and supply
professional organisa on. It is the worldwide centre of excellence on purchasing and supply
management issues. CIPS has a global community of over 88,000 in 150 different countries,
including senior business people, high‐ranking civil servants and leading academics. The ac vi es of
purchasing and supply chain professionals have a major impact on the profitability and efficiency of
all types of organisa on and CIPS offers corporate solu ons packages to improve business
profitability.
Zurich
Zurich is a thought leader in supply chain risk management. It has developed supply chain risk
assessment tools and an innova ve and award winning supply chain insurance product. The company
has extensive experience of working with clients to help them make their supply chains more resilient.
Zurich Insurance Group (Zurich) is a leading mul ‐line insurance provider with a global network of
subsidiaries and offices in Europe, North America, La n America, Asia‐Pacific and the Middle East as
well as other markets. It offers a wide range of general insurance and life insurance products and
services for individuals, small businesses, mid‐sized and large companies as well as mul na onal
corpora ons. Zurich employs about 60,000 people serving customers in more than 170 countries.
Founded in 1872, the Group is headquartered in Zurich, Switzerland. Zurich Insurance Company Ltd
(ZURN) is listed on the SIX Swiss Exchange and has a level I American Depositary Receipt program
(ZFSVY) which is traded over‐the‐counter on OTCQX. Further informa on about Zurich is available at
www.zurich.com
Zurich
Contact
Details
Nick Wildgoose, Global Supply Chain Product Manager
Phone: +44 (0) 0787 588 6068
Email: [email protected]
About
DHL
DHL is the global market leader in the logis cs industry and “The Logis cs company for the world”. DHL
commits its exper se in interna onal express, air and ocean freight, road and rail transporta on, contract
logis cs and interna onal mail services to its customers. A global network composed of more than 220
countries and territories and about 275,000 employees worldwide offers customers superior service
quality and local knowledge to sa sfy their supply chain requirements. DHL accepts its social responsibility
by suppor ng climate protec on, disaster management and educa on.
DHL
Supply
Chain
Service
Capability
DHL Supply Chain provides solu ons for all industry sectors including retail and fashion. By understanding
your business needs, DHL delivers cost effec ve supply chain solu ons that improve efficiency. From
consul ng and design, sourcing and transporta on through to warehousing, order assembly, distribu on
and returns, we manage the full supply chain opera on. DHL is part of Deutsche Post DHL. The Group
generated revenue of 53 billion euros in 2011.