ANNEXATION AND WATER UTILITY EXTENSIONS IN WAKE COUNTY, NC: THE ROLE OF RACE, INCOME, AND OTHER DEMOGRAPHIC CHARACTERISTICS
Allison Corinne Clonch
A Masters Project submitted to the faculty at the University of North Carolina at Chapel Hill in partial fulfillment of the requirements for the degree of Master of City and Regional
ABSTRACT
Allison Corinne Clonch: Annexation and Water Utility Extensions in Wake County, NC: The Role of Race, Income, and Other Demographic Characteristics
(Under the direction of Danielle Spurlock)
Racial segregation in the United States, formally ended some 65 years ago, still persists in many cities and towns through intentional and unintentional land use planning and policy. It has been demonstrated that low-income and Black neighborhoods are less likely to have access to municipal services through a phenomenon known as municipal underbounding. Many unincorporated communities lack basic amenities, such as water or sewer service, sidewalks, parks, or proper drainage systems, and most individuals living in these communities rely on unregulated private wells. The objective of this study is to determine the relationship between demographic characteristics of unincorporated communities and how annexations and water utility extensions are made over time. We created and utilized a novel database of residential parcels in Wake County, NC, from 2002 to 2018 and block group level demographic data. With this, we created logistic models to assess the relationship between community demographics and annexations and water utility extensions over time in Wake County, NC. In general, the models show that median age, race, and population density significantly affect the odds of both
1. Introduction
Annexation and access to municipal services, such as water and sewer services, are fraught with racial and socioeconomic disparities1–10. Racial segregation in the United States, formally ended some 65 years ago, still persists in many cities and towns through intentional and unintentional land use planning and policy9,10. It has been demonstrated that low-income and Black neighborhoods are less likely to have access to municipal services through a phenomenon known as municipal underbounding8. Individuals outside of municipal service areas in North Carolina live in what are known as “extra-territorial jurisdictions” (ETJs). In these
unincorporated communities, inequitable investments in community infrastructure lead to decreased property values and high concentrations of low-income residents, which further disincentivizes annexation by neighboring towns. Many unincorporated communities lack basic amenities, such as water or sewer service, sidewalks, parks, or proper drainage systems8.
Notably, most people living in these communities rely on private wells that are
unregulated by the Clean Water Act11–13. In the past several years, studies done on lead in private wells have reported lead levels comparable to those of Flint, Michigan, at the peak of the Flint water crisis. One study conducted in Orange County, NC, found elevated levels of lead and other metals in several private wells14. Another study found presence of bacterial contamination in ~30% of wells sampled in majority Black peri-urban neighborhoods in Wake County, NC15. A 2014 study was one of the first to quantify the racial disparities in access to municipal water services. This study conducted in Wake County, NC, looked at one year of utility services and found that race significantly predicted whether a community within an extraterritorial
increased by 3.8% for every 10% increase in Black population in a community when controlling for other covariates (p<0.05)1. Another study published in 2018 corroborate these findings; looking at the entire state of North Carolina, this study geographically analyzed the relationship between race and municipal water and sewer access. Using peri-urban census blocks, the study found that the odds of having community water service was greatest in communities with no or low Black residents and lowest in communities with 100% Black populations (p<0.01)16. A study of multiple locations in North Carolina examined the reasons that inhibit the extension of water and sewer service into unincorporated communities, and the study found that the most common hindrance on the decision to extend water/sewer service was financing the extension.
Additionally, health concerns were minor in the decision-making process, which indicates that local agencies either do not place high importance of the health implications of private well water or do not know about them17.
County, NC. We hypothesized that a parcel in a predominantly-minority neighborhood or low-income neighborhood will be less likely to be annexed and receive water service over time.
2. Materials and Methods:
2a. Database Development:
This study was completed using a retrospective database that included tax parcel data from Wake County GIS Services, 2010 Census data and 2017 American Community Survey (ACS) 5-year estimates data, as well as two years of tax data from 2013 and 2018 from Wake County’s revenue services department. The tax parcel data included in this study was for all residential parcels in Wake County from 2002 to 2018. All data cleaning and analysis was completed in STATA 15.1.
2018. After this, all non-residential parcels were dropped from the dataset, leaving only parcels identified as dwellings.
2b. Geocoding and Spatial Join:
We used ArcMap to geocode the data and perform a spatial join in order to merge Census and American Community Survey (ACS) data to each observation. We geocoded the data in ArcMap using a stand-alone geocoding program created from Esri Business Analyst StreetMap premium data from 2017. Less than 1% of the addresses were not matched; these were dropped from the dataset. We downloaded population demographics from the 2010 Census, and income data from the 2017 ACS 5-year estimates via Social Explorer’s pre-made Income table. We used a shapefile of Wake County to perform a spatial join to assign each observation from our dataset to a Census Block along with the corresponding Census and ACS data.
Analysis:
For the analysis, we had two primary outcomes of interest: 1) annexation by 2018, and 2) water utility access by 2018. We narrowed the population to only include parcels in an ETJ as of 2002. We created variables to capture percentages of white, Black, Hispanic, and Asian
population for each parcel’s census block group. We created two logistic regression models for each of our outcomes of interest, using racial composition, median household income, population density, and median age as covariates.
3. Results:
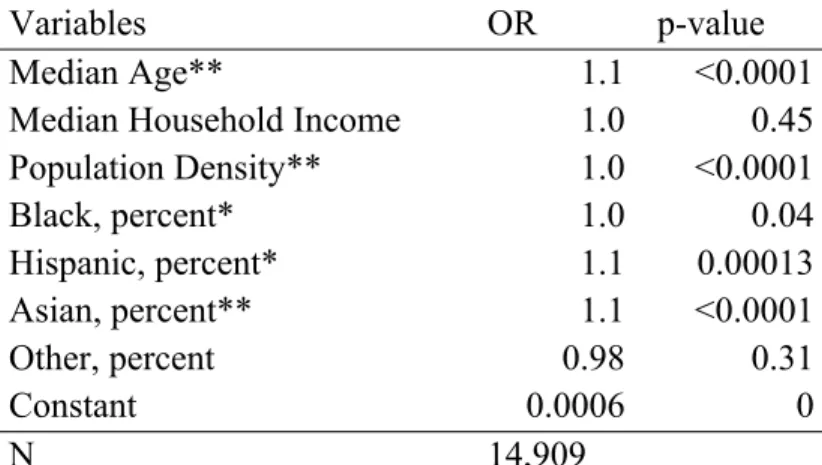
Parcels within census blocks with an increasing proportion of the population being Black had a very small increased odds of being annexed (OR=1.0, p<0.05). Median household income of the census block did not have a significant effect on annexation (OR=1.0, p=0.45). Parcels within census blocks with an increasing proportion of the population being Hispanic had
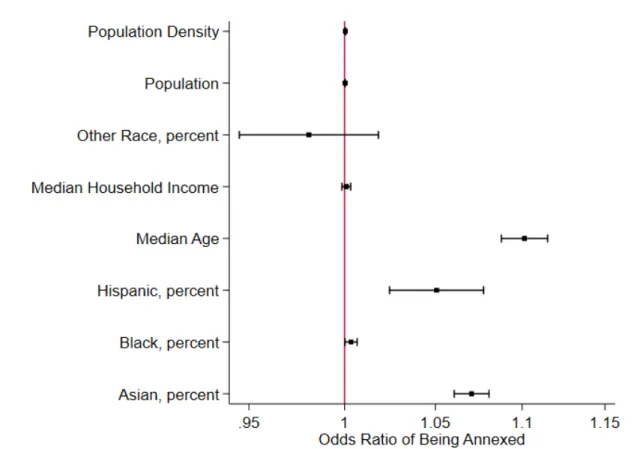
increased odds of being annexed (OR=1.1, p<0.01). Similarly, parcels within census blocks with an increasing proportion of the population being Asian had increased odds of being annexed (OR=1.1, p<0.001). Parcels had higher odds of being annexed if the median age was greater within the census block; each additional 1-year increase in the median age of a census block resulted in increased odds of annexation of 1.1 (Table 1, Figure 1. OR=1.1, p<0.0001).
Variables OR p-value
Median Age** 1.1 <0.0001
Median Household Income 1.0 0.45
Population Density** 1.0 <0.0001
Black, percent* 1.0 0.04
Hispanic, percent* 1.1 0.00013
Asian, percent** 1.1 <0.0001
Other, percent 0.98 0.31
Constant 0.0006 0
N 14,909
Figure 1. Graphical representation of the annexation logistic model with odds ratios, confidence intervals, and all variables included in model. Each point represents the odds ratio, and the lines extending left and right from each point represent the lower and upper confidence intervals, respectively.
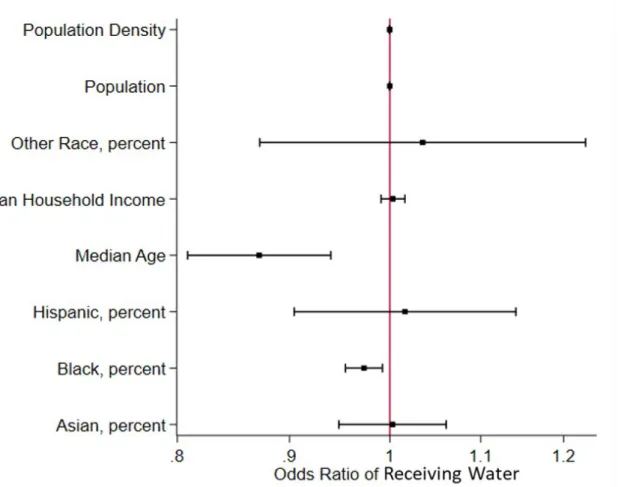
3b. Odds of Gaining Water Service over Time
Variables OR p-value
Median Age* 0.87 0.0003
Median Household Income 1.0 0.61
Population Density 1.0 0.06
Black, percent* 0.97 0.006
Hispanic, percent 1.0 0.79
Asian, percent 1.0 0.92
Other race, percent 1.0 0.69
Constant 2.1 0.65
N 7,935
Table 2. Results of a logistic regression model dichotomized by water extension (yes/no) within the study period from 2002 to 2018. All covariates are listed here with OR and p-values.
Figure 2. Graphical representation of the water extension logistic model with odds ratios, confidence intervals, and all variables
included in model. Each point represents the odds ratio, and the lines extending left and right from each point represent the
lower and upper confidence intervals, respectively.
In general, the models show that race significantly affected the odds of both being annexed and receiving water service. Contrary to our original hypothesis, an increasing percentage of the population in a census block being Black was significantly associated with increased odds of being annexed from 2002 to 2018, but the effect size was very small. However, an increasing percentage of the population in a census block being Black did significantly decrease the odds of receiving water access from 2002 to 2018. Also contrary to the original hypothesis, median household income of a census block was not significantly associated with either annexation or water access over time. Interestingly, median age followed the same pattern as race, with an increase in the median age resulting in increased odds of being annexed, but an increase in median age resulted in a decrease in the odds of receiving water access.
Since this is the first study to analyze the relationship between demographic characteristics and annexations and water extensions over time, no direct comparisons to the literature can be made. However, previous research has shown that selective annexation based on racial and socioeconomic factors does occur. For instance, research in Texas’ Lower Rio Grande Valley found that census blocks containing colonias are less likely to be annexed by municipalities than census blocks without colonias4. Additionally, another study’s findings suggest that low-income Black populations in North Carolina are more likely to be without community water or sewer service, potentially due to exclusion from municipal services during the era of legal racial
The differences seen in annexation over time in this study from other studies could be due to the location of the study and/or timeframe of the study. Wake County, NC, is one of the fastest growing metropolitan areas in the United States, and the past 2 decades have been characterized by widespread development across the county to accommodate the increasing population. Previously unincorporated areas have been annexed by municipalities as property values increased in response to demand in the region. The rapid growth of the county has also been characterized by gentrification of previously historically Black and low-income communities on the peri-urban fringe. This rapid growth over the study period may account, in part, for the results seen in the models. The census estimates used in this study were from 2010 – the most recent census. However, when the new census is conducted in 2020, one could hypothesize that the racial composition of much of the county will have changed. In order to truly understand the relationship between race and annexation over time in Wake County, this same analysis should be conducted with the updated census estimates.
Overall, median age, race, and population density all have a relationship with both
Bibliography
1. MacDonald Gibson J, DeFelice N, Sebastian D, Leker H. Racial disparities in access to community water supply service in wake county, north carolina. Am J Public Health. 2014;104(12):e45-e45. doi:10.2105/AJPH.2014.10412e45.1
2. Marsh B, Parnell AM, Joyner AM. Institutionalization of racial inequality in local political geographies. Urban Geogr. 2010;31(5):691-709. doi:10.2747/0272-3638.31.5.691
3. Stillo F. Racial disparities in access to municipal water supplies in.
4. Mukhija V, Mason DR. Reluctant cities, colonias and municipal underbounding in the US: can cities be convinced to annex poor enclaves? Urban Studies. 2013;50(14):2959-2975. doi:10.1177/0042098013482503
5. Ranganathan M, Balazs C. Water marginalization at the urban fringe: environmental justice and urban political ecology across the North–South divide. Urban Geogr. 2015;36(3):403-423. doi:10.1080/02723638.2015.1005414
6. Aiken CS. Race as a factor in municipal underbounding. Annals of the Association of American Geographers. 1987;77(4):564-579. doi:10.1111/j.1467-8306.1987.tb00181.x 7. Wilson SM, Heaney CD, Cooper J, Wilson O. Built Environment Issues in Unserved and
Underserved African-American Neighborhoods in North Carolina. Environmental Justice. 2008;1(2):63-72. doi:10.1089/env.2008.0509
8. Anderson MW. Cities inside out: race, poverty, and exclusion at the urban fringe. SSRN Journal. 2007. doi:10.2139/ssrn.1007359
9. Wilson S, Hutson M, Mujahid M. How planning and zoning contribute to inequitable development, neighborhood health, and environmental injustice. Environmental Justice. 2008;1(4):211-216. doi:10.1089/env.2008.0506
10. Pendall R. Local land use regulation and the chain of exclusion. Journal of the American Planning Association. 2000;66(2):125-142. doi:10.1080/01944360008976094
11. MacDonald Gibson J, Pieper KJ. Strategies to Improve Private-Well Water Quality: A North Carolina Perspective. Environ Health Perspect. 2017;125(7):076001.
doi:10.1289/EHP890
12. Swistock BR, Clemens S, Sharpe WE, Rummel S. Water quality and management of private drinking water wells in Pennsylvania. J Environ Health. 2013;75(6):60-66. 13. Seltenrich N. Unwell: the public health implications of unregulated drinking water.
Environ Health Perspect. 2017;125(11):114001. doi:10.1289/EHP2470
14. Heaney CD, Wing S, Wilson SM, et al. Public infrastructure disparities and the
microbiological and chemical safety of drinking and surface water supplies in a community bordering a landfill. J Environ Health. 2013;75(10):24-36.
15. Stillo F, MacDonald Gibson J. Exposure to contaminated drinking water and health disparities in north carolina. Am J Public Health. 2017;107(1):180-185.
doi:10.2105/AJPH.2016.303482
16. Leker HG, MacDonald Gibson J. Relationship between race and community water and sewer service in North Carolina, USA. PLoS One. 2018;13(3):e0193225.
17. Naman JM, Gibson JM. Disparities in Water and Sewer Services in North Carolina: An Analysis of the Decision-Making Process. Am J Public Health. 2015;105(10):e20-6. doi:10.2105/AJPH.2015.302731