Who Presents Satisfied? Non-modifiable Factors Associated
with Patient Satisfaction among Gynecologic Oncology Clinic
Patients
Emma L Barber, MD1,2, Jeannette T Bensen, PhD2,3, Anna Snavely, PhD4, Paola A Gehrig,
MD1,2, and Kemi M Doll, MD1,2,5
1Division of Gynecologic Oncology, Department of Obstetrics and Gynecology, University of North
Carolina, Chapel Hill, NC
2Lineberger Comprehensive Cancer Center, University of North Carolina, Chapel Hill, NC
3Department of Epidemiology, Gillings School of Global Public Health, University of North
Carolina, Chapel Hill, NC
4PDstat LLC
5Department of Health Policy and Management, Gillings School of Global Public Health,
University of North Carolina, Chapel Hill, NC
Abstract
Objective—To examine associations between non-modifiable patient factors and patient satisfaction (PS) among women presenting to a gynecologic oncology clinic.
Methods—This is a cross sectional analysis of patients presenting for surgical management by a gynecologic oncologist at a tertiary care academic medical center. The Patient Satisfaction Questionnaire (PSQ-18) that measures PS in seven domains of health care was administered. Scores were converted to “satisfied” versus “unsatisfied/equivocal”. Demographic and medical factors were obtained from the medical record. Chi-square, t-tests, and multivariable logistic regression were used.
Results—208 patients completed the baseline patient satisfaction questionnaire and the median PSQ-18 score was 70.5 (range 42–90). Median age was 58 years (range 22–93). Several non-modifiable factors were associated with PS. White patients had higher interpersonal PS than minorities (86% v 65% p =0.002). The uninsured had lower interpersonal (60% v 86% p =0.003)
CORRESPONDING AUTHOR: Emma Barber, MD, Division of Gynecologic Oncology, Department of Obstetrics and Gynecology, University of North Carolina at Chapel Hill, 103B Physicians’ Office Building, Campus Box #7572, Chapel Hill, NC 27599. Phone: 919-966-1194; Fax: 919-843-5387; [email protected].
Publisher's Disclaimer: This is a PDF file of an unedited manuscript that has been accepted for publication. As a service to our
customers we are providing this early version of the manuscript. The manuscript will undergo copyediting, typesetting, and review of the resulting proof before it is published in its final citable form. Please note that during the production process errors may be discovered which could affect the content, and all legal disclaimers that apply to the journal pertain.
PRESENTATIONS: The data contained within this article was presented in abstract form at both the Annual Winter Meeting of the Society of Gynecologic Oncology February, 2016 in Squaw Valley, CA and at the Society for Gynecologic Oncology Annual Meeting
HHS Public Access
Author manuscript
Gynecol Oncol
. Author manuscript; available in PMC 2017 August 01.Published in final edited form as:
Gynecol Oncol. 2016 August ; 142(2): 299–303. doi:10.1016/j.ygyno.2016.06.009.
A
uthor Man
uscr
ipt
A
uthor Man
uscr
ipt
A
uthor Man
uscr
ipt
A
uthor Man
uscr
and accessibility PS (33% v 67% p =0.03). Increasing education and less time traveled to care were both associated with higher interpersonal (p =0.03, p =0.05) and accessibility PS (p =0.01, p =0.01). There was no association between clinical factors (BMI, comorbidities, cancer) and PS. In multivariable analysis, the strongest predictor of interpersonal PS was white race while the strongest predictors of accessibility PS were time travelled to care and insurance status.
Conclusions—Patient satisfaction scores among patients presenting to a gynecologic
oncology clinic are associated with non-modifiable demographic, financial and geographic factors. Pay for performance measures that use summed patient satisfaction scores may penalize hospitals for patient-mix driven differences.
INTRODUCTION
The Affordable Care Act mandates that payments to hospitals depend on providing value-based care (1). Two percent of total hospital Center for Medicaid and Medicare Services (CMS) reimbursements is calculated using value-based performance scores (2). Within these value-based performance scores, a subjective measure of performance called the ‘patient experience of care domain’, is 30% of the total hospital performance score (2). This domain is measured using a patient satisfaction questionnaire.
Given that patient satisfaction is part of how the delivery of value-based care is measured, many investigators have examined the relationship between patient satisfaction and other markers of high quality healthcare with mixed results. In some studies, higher patient satisfaction scores have been correlated with decreased hospital readmissions, decreased length of hospital stay and decreased mortality (3). Others studies, specifically in surgery, have found no relationship between patient satisfaction and adherence to Surgical Care Improvement Program (SCIP) process measures, postoperative complications or mortality (4, 5). Paradoxically, one study actually found an inverse relationship: patient satisfaction was associated with increased healthcare costs and increased mortality (6).
In addition to studying the relationship between patient satisfaction and other markers of high quality healthcare, investigators have also examined the association between non-modifiable patient factors and patient satisfaction. In this work, patient satisfaction scores vary with a number of non-modifiable patient and hospital system factors. At the patient level, lower satisfaction scores have been found for younger and more educated patients (7, 8). Other studies have found lower satisfaction scores for patients who are non-English speakers (8). At the systems level, lower patient satisfaction scores have been observed for densely populated urban areas, hospitals with more beds and those that are non-profit or academic (8, 9). The consistent variation of patient satisfaction by non-modifiable factors suggests that patient satisfaction may be measuring factors beyond just the quality of healthcare delivered.
However, much of this literature focuses on the inpatient setting, and the association between non-modifiable factors and patient satisfaction has not been studied to date in outpatient gynecologic oncology patients. Our objective was to evaluate the association between non-modifiable patient factors and domain-specific patient satisfaction scores among women presenting to a gynecologic oncology clinic.
A
uthor Man
uscr
ipt
A
uthor Man
uscr
ipt
A
uthor Man
uscr
ipt
A
uthor Man
uscr
METHODS
We conducted a cross sectional analysis of a larger parent prospective cohort study: The Impact of Surgical Complications on Health Related Quality of Life.(10) The recruitment of this cohort has been previously described. Briefly, patients were identified and enrolled in a hospital-based Registry, the University of North Carolina at Chapel Hill (UNC) Health Registry/Cancer Survivorship Cohort (HR/CSC), as well as, the parent study when presenting to the Gynecologic Oncology outpatient clinic from October 2013 to October 2014. Both the HR/CSC and parent study were reviewed and approved by the Human Research Protections Program at the University of North Carolina at Chapel Hill (IRB #09-0605 and #13–2367). Participation included use of medical records for research and interviews. Eligibility criteria included: 18 years or older, North Carolina mailing address, English or Spanish speaking, and planned surgical management of gynecologic cancer or a suspicious pelvic mass.. Exclusion criteria included: pregnancy, the inability to provide informed consent and the inability to participate in an interview. All enrolled patients provided signed informed consent and HIPAA authorization. Participants completed a baseline interview, which included the patient satisfaction questionnaire (PSQ-18). Baseline interviews were conducted within 2 weeks of enrollment by trained staff using a computer-assisted telephone interview (CATI) software tool specifically designed for the parent study.
Our primary outcome was patient satisfaction in seven different domains. We measured patient satisfaction using the patient satisfaction questionnaire (PSQ-18). The PSQ-18 is a patient satisfaction tool originally developed by the RAND corporation and has been validated in a diverse number of practice settings (11, 12). It measures patient satisfaction in seven different domains: general satisfaction, satisfaction with the technical quality of care, satisfaction with the interpersonal manner of the physician, satisfaction with communication, satisfaction with the financial aspects of care, satisfaction with time spent with doctor and satisfaction with the accessibility/convenience of care. Each of the 18 questions in the PSQ-18 asks the patient to respond on a 5-point Likert scale and each question maps to a specific domain of patient satisfaction. The minimum number of questions that maps to a single domain is 2 and the maximum number is 4. The score for each domain is a mean score of all questions on that domain. A maximum score is 90 and a minimum score is 18. For our analysis, we converted the PSQ-18 score in each domain of patient satisfaction into a binary outcome of ‘satisfied’ versus ‘unsatisfied/equivocal’ based on a numerical cutoff. Scores of greater than 3.5 were grouped as ‘satisfied’ and scores of 3.5 and below were ‘unsatisfied/equivocal’. This cut off was chosen as, on a single item, a score of 3 indicates being equivocal and a score of 4 indicates being partially satisfied and we wanted to ensure that patients who were categorized as ‘satisfied’ in a specific domain had more responses indicating being ‘satisfied’ than ‘equivocal/unsatisfied’.
Our factors of interest were non-modifiable patient factors. These included demographic factors such as age, race, insurance, and highest level of education; geographic factors such as the time travelled to obtain care; and medical factors such as comorbidities, body mass index, specific cancer site, and cancer versus benign disease on final pathology. Health insurance and all medical factors were obtained from the patient’s medical record. Age,
A
uthor Man
uscr
ipt
A
uthor Man
uscr
ipt
A
uthor Man
uscr
ipt
A
uthor Man
uscr
race, education and time travelled to care were reported by the patient in the baseline interview.
Associations between non-modifiable patient factors and patient satisfaction in each of the seven domains were evaluated using chi square tests and t-tests. A multivariable logistic regression model was used to estimate the strongest predictors of satisfaction in each domain. Models were created by including all non-modifiable patient factors as covariates; non-modifiable factors that remained significant in these models were considered the strongest predictors of satisfaction. As the goal of the models was to evaluate potential predictors of satisfaction in each of the seven domains rather than test a specific hypothesis, models were not reduced. Sensitivity analyses were performed with reduced models to ensure the odds ratio did not change which would indicate over-fitting. All analyses were performed using SPSS version 20.0 (IBM Corp, Armonk, NY). A p value of less than 0.05 was considered significant for all analyses.
RESULTS
Of the 281 women who consented for the parent study, we had patient satisfaction data for 208 (74%). Of the 73 patients without data available, 12 were ineligible due to enrollment criteria or patient withdrawal, 38 did not respond to interview requests and 23 did not have medical data abstracted as they only completed a baseline assessment.
Our 208 patients had the following demographic characteristics (Table 1). Median age was 58 years (range 22–93) and median PSQ-18 score was 70.5 (range 42–90). Approximately 20% of the patients were racial/ethnic minorities with 78.4% White patients, 16.8% Black patients and 4.8% Asian, Native American, or self-identified as ‘Other’. Education levels were broadly distributed with 25.5% high school graduate or less, 31.7% some college or trade school, and 42.8% with college degree or greater. Most patients had some private insurance, with 7.2% uninsured and 8.7% with Medicare or Medicaid alone.
Several non-modifiable factors were associated with different domains of patient satisfaction (Table 2). Satisfaction with the interpersonal manner of the physician differed for patients depending on race, insurance status, highest level of education and time travelled to care. White patients had higher satisfaction with the interpersonal manner of the physician than racial/ethnic minorities (86% v 65%, p=0.002), as did those with insurance compared to the uninsured. Those with a college education were also more likely to be satisfied with the interpersonal manner of the physician compared to those with a high school education or less (88% v 70%, p=0.03). Those who travelled less than 60 minutes to obtain care were also more likely to be satisfied (88% versus 77%, p=0.05).
Satisfaction with the accessibility and convenience of care was significantly different for patients based on race, highest level of education, insurance status, and the time they travelled to care. Patients travelling more than 60 minutes to obtain care were less satisfied with the accessibility and convenience of care than those travelling less than 60 minutes (58% v 74%, p=0.01). Those who were uninsured were also less satisfied with the accessibility of care compared to those with some private insurance. Racial and ethnic
A
uthor Man
uscr
ipt
A
uthor Man
uscr
ipt
A
uthor Man
uscr
ipt
A
uthor Man
uscr
minorities and those with a high school education or less were also significantly more likely to be dissatisfied with the accessibility and convenience of care (p=0.03 and p=0.01, respectively). Finally, satisfaction with financial aspects of care was more common among older patients and insured patients. Seventy-one percent of patients greater than 60 years old were satisfied with financial aspects of care compared to only 47% of those less than 60 years old (p<0.001). Those with insurance were also more satisfied compared to those who were uninsured. We found no associations between any of the non-modifiable factors and the other four domains of patient satisfaction: general satisfaction, technical quality of care, communication and time spent with the doctor (data not presented). There was also no association between medical factors (age, BMI, medical comorbidities or cancer versus benign disease) and patient satisfaction in any of the seven domains.
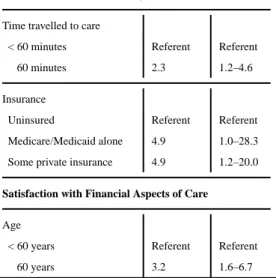
In multivariable analysis, the strongest predictor of satisfaction with the interpersonal manner of the physician was the patient’s race (Table 3). White patients had 2.9 (95% CI 1.1–7.3) times the odds of being satisfied than racial/ethnic minority patients with adjustment for all other non-modifiable factors. For satisfaction with the accessibility and convenience of care, distance travelled to care and insurance status, were the strongest predictors (Table 3). Those who travelled less than 60 minutes to care had 2.3 times the odds of being satisfied than those who travelled 60 minutes or more. Those who had either public or private insurance were also more likely to be satisfied with the accessibility and
convenience of care than the uninsured. Finally, for satisfaction with financial aspects of care, age was a significant predictor (Table 3). Those who were 60 or older had 3.2 times the odds of being satisfied with financial aspects of care as those younger than 60. Regression models with the outcomes of general satisfaction, satisfaction with the technical quality of care, communication and time spent with the doctor, all revealed no significant predictors of satisfaction (data not presented).
DISCUSSION
This study agrees with previous work in other disciplines that patient satisfaction scores are affected by non-modifiable patient and system factors, such as the age of the patient or the size of the hospital (8, 9). In a cohort of gynecologic oncology patients in an outpatient setting, we found that patient satisfaction scores are associated with non-modifiable demographic, financial and geographic factors. Additionally, these non-modifiable patient factors have varying effects on the different domains of patient satisfaction.
Patient satisfaction is a quality metric by which hospital systems and increasingly, individual physicians, are judged (13). We found lower patient satisfaction scores in specific domains for underserved patients (racial minorities, patients with less education, those living farther from the hospital and the uninsured). These differences persisted even when adjusting for disease-related factors such as the stage of disease and the disease site. Underserved patients have many reasons to be unsatisfied with the healthcare system, as disparities in treatment offered and in outcomes, have been reported by race, insurance status, education and geographic distance travelled to care (14). Thus, these patient satisfaction results provide us important information about how to improve the patient experience for these groups. However, as we measured these factors at the initiation of care, underserved patients may be
A
uthor Man
uscr
ipt
A
uthor Man
uscr
ipt
A
uthor Man
uscr
ipt
A
uthor Man
uscr
responding to longer held beliefs based on previous experiences or expectations with the healthcare system and this history may be influencing their experience with the specific institution and episode of care.
If these results are confirmed, there is the possibility that penalties based on patient satisfaction scores will simply add to the financial disincentives for providers to care for these underserved groups. It is particularly concerning that other investigators have consistently found that patient satisfaction scores are lower for large academic or public hospitals (8, 15, 16). These institutions care for a higher proportion of underserved patients compared to smaller based hospitals. By directly comparing small community-based hospitals serving homogenous populations to larger academic/public hospitals serving heterogeneous populations, hospitals caring for the most underserved women may be penalized. Penalties that remove needed funding from these already underfunded institutions may actually worsen healthcare disparities. Rather, a system with incentives based on trending improvements in scores, as opposed to the absolute value of scores, would be more appropriate to help address these observed disparities.
Another approach to addressing the differences in baseline satisfaction scores by non-modifiable patient factors is case-mix adjustment (17). Case-mix adjustment means adjustment for factors related to the outcome being measured to allow hospitals to be directly compared to one another as if they had for example, the same age patients. However, case mix-adjustment is controversial when addressing healthcare disparities. It has the potential to mask disparate quality delivered care based on these same non-modifiable factors (18). Thus, if the goal is for an individual institution to improve its own outcomes, case-mix or risk-adjustment is inappropriate. However, if the goal is to compare institutions to one another and level financial penalties, case-mix adjustment can play a role in
preventing penalties to hospitals based on the community they serve.
Our study has several strengths. It is a cross sectional analysis of a larger parent prospective longitudinal cohort study. This means that patients were completing the patient satisfaction surveys along with a battery of other items. This decreases the potential selection bias compared to a stand-alone patient satisfaction survey that particularly satisfied or unsatisfied patients may be more likely to complete. Additionally, the survey was administered by a trained interviewer not affiliated with the healthcare system who interviewed the patient outside of the healthcare setting. This decreases the potential for social desirability bias in the responses while allowing for the inclusion of those with lower literacy. Our study is also subject to several limitations. As it was a single institution study, the results may not be generalizable to other institutions or practice settings. However, as a large public hospital serving an entire state, the population is diverse in terms of socioeconomic status, insurance, and race and thus the results may be more generalizable to diverse populations. Additionally, we tested multiple hypotheses to examine the effects of various patient factors on the different domains of patient satisfaction. Thus, these results should be considered hypothesis generating and need to be confirmed in additional studies.
In conclusion, domain-specific patient satisfaction at initiation of care is associated with non-modifiable patient factors. Tertiary care facilities that serve heterogeneous populations
A
uthor Man
uscr
ipt
A
uthor Man
uscr
ipt
A
uthor Man
uscr
ipt
A
uthor Man
uscr
and have large catchment areas can use this information to target improvement projects at specific domains of patient satisfaction. However, given that patient satisfaction scores are used to compare hospitals to one another it is important to note that domain-specific patient satisfaction scores vary by non-modifiable patient factors and that this may penalize hospitals and physicians who care for heterogeneous populations. This has the potential to worsen healthcare disparities.
Acknowledgments
FINANCIAL SUPPORT: Dr Barber is supported by NIH T32 HD040672-15. Dr. Doll is supported by NCI 2R25CA116339.
The authors thank the UNC Health Registry/Cancer Survivorship Cohort (HR/CSC) participants for their important contributions. The HR/CSC is funded in part by the UNC Lineberger Comprehensive Cancer Center’s University Cancer Research Fund.
REFERENCES
1. Patient Protection and Affordable Care Act, 42 U.S.C. § 18001. 2010
2. Centers for Medicare and Medicaid Services. [March 2016] Hospital Compare. Accessed at: http:// www.medicare.gov
3. Tsai TC, Orav EJ, Jha AK. Patient satisfaction and quality of surgical care in US hospitals. Annals of surgery. 2015; 261(1):2–8. [PubMed: 24887985]
4. Kennedy GD, Tevis SE, Kent KC. Is there a relationship between patient satisfaction and favorable outcomes? Annals of surgery. 2014; 260(4):592–598. discussion 8-600. [PubMed: 25203875] 5. Lyu H, Wick EC, Housman M, Freischlag JA, Makary MA. Patient satisfaction as a possible
indicator of quality surgical care. JAMA surgery. 2013; 148(4):362–367. [PubMed: 23715968] 6. Fenton JJ, Jerant AF, Bertakis KD, Franks P. The cost of satisfaction: a national study of patient
satisfaction, health care utilization, expenditures, and mortality. Archives of internal medicine. 2012; 172(5):405–411. [PubMed: 22331982]
7. Zaslavsky AM, Zaborski LB, Ding L, Shaul JA, Cioffi MJ, Cleary PD. Adjusting Performance Measures to Ensure Equitable Plan Comparisons. Health Care Financ Rev. 2001; 22(3):109–126. [PubMed: 25372572]
8. McFarland DC, Ornstein KA, Holcombe RF. Demographic factors and hospital size predict patient satisfaction variance-implications for hospital value-based purchasing. Journal of hospital medicine : an official publication of the Society of Hospital Medicine. 2015; 10(8):503–509. 9. Borah BJ, Rock MG, Wood DL, Roellinger DL, Johnson MG, Naessens JM. Association between
value-based purchasing score and hospital characteristics. BMC health services research. 2012; 12:464. [PubMed: 23244445]
10. Doll KM, Barber EL, Bensen JT, Snavely AC, Gehrig PA. The health-related quality of life journey of gynecologic oncology surgical patients: Implications for the incorporation of patient-reported outcomes into surgical quality metrics. Gynecologic oncology. 2016
11. Thayaparan AJ, Mahdi E. The Patient Satisfaction Questionnaire Short Form (PSQ-18) as an adaptable, reliable, and validated tool for use in various settings. Med Educ Online. 2013; 18:21747. [PubMed: 23883565]
12. Marshall, GN.; Hays, RD. The Patient Satisfaction Questionnaire Short Form (PSQ-18). RAND Corporation; 1994.
13. National Quality Forum. 2015 [Accessed March, 2016] http://www.qualityforum.org/about/. 14. Kelley E, Moy E, Stryer D, Burstin H, Clancy C. The national healthcare quality and disparities
reports: an overview. Medical care. 2005; 43(3 Suppl):I3–I8. [PubMed: 15746588]
15. Al-Amin M, Makarem SC. The Effects of Hospital-Level Factors on Patients' Ratings of Physician Communication. J Healthc Manag. 2016; 61(1):28–41. [PubMed: 26904776]
A
uthor Man
uscr
ipt
A
uthor Man
uscr
ipt
A
uthor Man
uscr
ipt
A
uthor Man
uscr
16. McFarland DC, Shen MJ, Holcombe RF. Predictors of patient satisfaction with inpatient hospital pain management across the United States: A national study. Journal of hospital medicine : an official publication of the Society of Hospital Medicine. 2016
17. Iezzoni, L. Risk Adjustment for Measuring Health Care Outcomes. Health Administration Press; 2012.
18. National Quality Forum. Risk Adjustment for Socioeconomic Status or Other Sociodemographic Factors. [March 18, 2014] http://www.leapfroggroup.org/media/file/NQF_SocioDem.pdf.
A
uthor Man
uscr
ipt
A
uthor Man
uscr
ipt
A
uthor Man
uscr
ipt
A
uthor Man
uscr
Highlights
Domain-specific patient satisfaction scores are associated with non-modifiable demographic, financial and geographic patient factors.
These non-modifiable factors affect the varying domains of patient satisfaction differently.
Comparing hospitals to one another using summed domains of patient satisfaction scores may disproportionately penalize hospitals caring for underserved patients.
A
uthor Man
uscr
ipt
A
uthor Man
uscr
ipt
A
uthor Man
uscr
ipt
A
uthor Man
uscr
A
uthor Man
uscr
ipt
A
uthor Man
uscr
ipt
A
uthor Man
uscr
ipt
A
uthor Man
uscr
ipt
Table 1
Demographic, Geographic, and Medical Factors
Characteristics (N=208) N(%) or median (range)*
Age (years) 58 (22–93)
BMI (kg/m2) 31 (17–58)
Race
White 165 (78.4)
Black 38 (16.8)
Other minority 5 (2.4)
Education
High school graduate or less 53 (25.5)
Some college/trade school 66 (37.1)
College graduate and above 89 (42.8)
Insurance
Uninsured 15 (7.2)
Medicaid/Medicare alone 18 (8.7)
Some private insurance 175 (84.1)
Time travelled to care (minutes) 60 (5–240)
Disease site
Benign 57 (27.4)
Uterus 93 (44.7)
Ovary 32 (15.4)
Cervix 18 (8.7)
Vulva/Vagina 4 (1.9)
Non-GYN 4 (1.9)
Stage1
I 96 (67.6)
II 11 (7.7)
III 31 (21.8)
IV 4 (2.8)
Charlson Comorbidity Score
0–1 57 (27.4)
2–3 107 (51.4)
4+ 44 (21.2)
*
Data is reported as N(%) for categorical variables and median (range) for continuous variables.
1
A
uthor Man
uscr
ipt
A
uthor Man
uscr
ipt
A
uthor Man
uscr
ipt
A
uthor Man
uscr
ipt
T ab le 2Association of Non-modif
iable F
actors and P
atient Satisf
action by Domain
Inter
personal
Manner of Ph
ysician
Accessibility and
Con
v
enience of Car
e Financial Aspects of Car e Characteristics N Satisf ied p v alue Satisf ied p v alue Satisf ied p v alue
Age < 60 years
111
83%
66%
47%
≥ 60 years
97 80% 0.65 64% 0.76 71% <0.001
BMI Non-obese (<30 kg/m
2)
87
87%
66%
62%
Obese (≥30 kg/m
2) 121 78% 0.08 65% 0.88 55% 0.33
Race White
165 65% 68% 61% Racial/Ethnic Minority 43 86% 0.002 51% 0.03 49% 0.16
Education High school graduate or less
53 70% 49% 53% Some colle ge/trade school 66 83% 65% 53% Colle
ge graduate and abo
v e 89 88% 0.03 74% 0.01 65% 0.21
Insurance Uninsured
15 60% 33% 27% Medicaid/Medicare alone 18 61% 67% 72% Some pri v ate insurance 175 86% 0.003 67% 0.03 59% 0.02 T ime tra v
elled to care
< 60 minutes
90
88%
74%
62%
≥ 60 minutes
118 77% 0.05 58% 0.01 55% 0.30
Disease site Benign
A
uthor Man
uscr
ipt
A
uthor Man
uscr
ipt
A
uthor Man
uscr
ipt
A
uthor Man
uscr
ipt
Inter personalManner of Ph
ysician
Accessibility and
Con
v
enience of Car
e Financial Aspects of Car e Characteristics N Satisf ied p v alue Satisf ied p v alue Satisf ied p v alue Ov ary 32 81% 75% 75% Cervix 18 94% 89% 67% V ulv a/V agina 4 75% 75% 25% Non-GYN 4 75% 0.73 33% 0.10 33% 0.17 Stage 1 I 96 81% 65% 56% II 11 91% 73% 55% III 31 81% 74% 77% IV 4 50% 0.60 50% 0.70 50% 0.25
Charlson Comorbidity Score 0–1
57 84% 63% 56% 2–3 107 83% 65% 56% 4+ 44 75% 0.42 66% 0.95 66% 0.50 Bolded te
xt indicates statistical signif
icance. All p-v
alues determined using Chi-square tests.
1 T
otal of 142 patients with stage information a
v
ailable, remainder benign pathology or unkno
A
uthor Man
uscr
ipt
A
uthor Man
uscr
ipt
A
uthor Man
uscr
ipt
A
uthor Man
uscr
ipt
Table 3
Strongest Predictors of Patient Satisfaction by Domain
aOR* 95% CI
Satisfaction with Interpersonal Manner of the Physician
Race
Black Referent Referent
White 2.9 1.1–7.3
Satisfaction with Accessibility and Convenience of Care
Time travelled to care
< 60 minutes Referent Referent
≥ 60 minutes 2.3 1.2–4.6
Insurance
Uninsured Referent Referent
Medicare/Medicaid alone 4.9 1.0–28.3
Some private insurance 4.9 1.2–20.0
Satisfaction with Financial Aspects of Care
Age
< 60 years Referent Referent
≥ 60 years 3.2 1.6–6.7
*