Cortisol and testosterone dynamics following exhaustive endurance exercise
By: Travis Anderson, Amy R. Lane, and Anthony C. Hackney
Anderson, T., Lane, A.R. & Hackney, A.C. Eur J Appl Physiol (2016) 116: 1503. https://doi.org/10.1007/s00421-016-3406-y
***© Springer-Verlag Berlin Heidelberg. Reprinted with permission. No further reproduction is authorized without written permission from Springer-Verlag Berlin Heidelberg. This version of the document is not the version of record. Figures and/or pictures may be missing from this format of the document. ***
Abstract:
Purpose: Cortisol (C) and testosterone (T) are impacted significantly by prolonged endurance exercise with inverse responses. Increases in C are witnessed concurrently with decrements in T, possibly impacting recovery. This study was conducted to assess the dynamics of C and free T (fT) concentration and recovery time following an exhaustive endurance exercise session (EES).
Methods: 12 endurance-trained males (X ± SD: VO2max 66.3±4.8 ml/kg/min, age
22.8 ± 3.1 years, body fat 11.0 ± 1.4 %, training 7.1 ± 3.2 years) completed a treadmill EES at ventilatory threshold (74.7 ± 4.6 % of VO2max; 96.9 ± 10.8 min). Basal blood C and fT were collected at baseline: −48, −24 h, and immediately before (0 h) the EES as well as immediately (+0 h), +24 h, +48 h, and +72 h after the EES. Blood glucose (G) was measured to confirm no undue influence on C. Statistically data were analyzed with repeated measures ANOVA (LSD post hoc).
Results: C (nmol/L) increased significantly from −48 h (321 ± 59) to +0 h (701 ± 178)
(p < 0.001), and displayed a baseline overshoot with +24 h (209 ± 67) being significantly lower
than −48 and +0 h (p < 0.03). fT (pmol/L) decreased significantly from −48 h (161 ± 40) to +0 h (106 ± 38) (p < 0.01) and remained lower at +24 h (110 ± 33) and +48 h (129 ± 30) (p < 0.001). G remained stable throughout. A moderately negative correlation (r = −0.636, p < 0.026) was found between C and fT at +0 h.
Conclusions: EES recovery may require 48 h for C and 72 h for fT to return to baseline values. Furthermore, C and fT were only correlated immediately post-exercise. Future research should perform more frequent measurements throughout time course.
Keywords: Stress | Endocrine | Recovery | Overtraining
Article:
Abbreviations
C Cortisol
fT Free testosterone
Hb Hemoglobin
Hct Hemocrit
HPA axis Hypothalamic–pituitary–adrenal axis LH Luteinizing hormone
REPANOVA Repeated analysis of variance RPE Rate of perceived exertion
VO2max Maximal volume of oxygen uptake
VT Ventilatory threshold
Communicated by Fabio Fischetti.
Introduction
Endurance running has been demonstrated to provide a large physiological stress to the body, resulting in large neuroendocrine system responses. Specifically, the hypothalamic–pituitary– adrenal (HPA) axis is stimulated to secrete the glucocorticoid hormone, cortisol. Cortisol has many physiological effects within the body that aid in substrate mobilization to improve running performance, but also affects the recovery process following an exercise bout (Brownlee et al. 2005; Daly et al. 2004). Testosterone, an anabolic–androgenic steroid that is secreted
predominately from the Leydig cells of the testes, will tend to lower in concentration following exhaustive endurance exercise (Daly et al. 2005), reducing its anabolic affect within the body. These two hormones have long been studied as potential biomarkers for the catabolic or anabolic state of the body since they are highly involved with regulation of protein breakdown and
synthesis (Hackney and Dobridge 2003). Due to the critical role these hormones play in protein turnover, it has been suggested they can be used to assess the recovery status of an athlete (Urhausen et al. 1995).
Although many studies have assessed the direction and magnitude of change in both of these hormones, most studies have assessed the concentrations either during an exercise bout or immediately following exercise completion. Some investigators have collected data on recovery processes, but most were only during the acute recovery phase (Hough et al. 2011; Thorpe and Sunderland 2012) or up to 24 h post-exercise (Daly et al. 2005; Duclos et al. 1997; Moore et al. 2005; Tremblay et al. 2005). Although this is valuable information, it is necessary to observe the concentrations of these hormones over a more extensive period of time to assess the time course required for the neuroendocrine system to return to a resting homeostatic state (Viru and Viru 2001). Such information is potentially vital to the coach and athlete in establishing timeline guidance for the number of rest days necessary after strenuous exercise, such as might occur in a competition.
time course of hormonal recovery. Therefore, the purpose of this study was to assess the dynamics of cortisol and testosterone concentration during recovery, following an exhaustive exercise bout in elite endurance runners.
Methods
Subjects
Twelve highly trained male endurance athletes volunteered to participate in this study. All subjects were free of any endocrine, musculoskeletal or cardiopulmonary system abnormalities or illnesses, and had been competing in and training for endurance-type activities for at least 5 days per week for the last 2 years. All subjects principally exercise trained by running;
although, some also occasionally performed cycling or swimming. All subjects signed a written Informed Consent form, as approved by the Institutional Review Board at University of North Carolina at Chapel Hill.
Procedures
Subjects reported to the laboratory on seven separate occasions each time being required to adhere to the pre-assessment guidelines, which included being 2.5 h fasted, abstaining from strenuous activity, alcohol and sexual activity for 24 h, and abstaining from caffeine
consumption for 12 h. At the initial session, subjects completed a written informed consent form, medical history questionnaire and training log, prior to anthropometric data (height, body mass, age) being recorded and undergoing a medical screening by a trained examiner, to ensure safety of participants in the study. Each subject then completed a modified Astrand maximal treadmill test to determine maximum oxygen uptake (VO2max). Respiratory gases were collected via
Truemax 2400 open-spirometry system (ParvoMedics Inc., UT) and VO2max was determined by
satisfying the following criteria: VO2 did not increase with an increase by more than 0.15 l/min
with an increase in workload, heart rate did not increase with an increase in workload, RPE > 18 (ACSM 2013). Ventilatory threshold (VT) was then calculated using the criteria of Wasserman (1984) and Yeh et al. (1983) to determine exercise intensity for the exhaustive exercise session (EES).
Following a 7-day wash-out period, participants returned to the lab for an initial blood draw, 48 h
prior to the exhaustive exercise bout (−48 h). All subjects reported between 1300 and 1500 h, due to the relatively stable basal hormonal levels. First, height, body mass and body composition (skinfold measurements: chest, abdomen, thigh) were recorded. Subjects were then required to rest in a supine position for 30 min, prior to a blood sample being taken via the antecubital vein. This process was then repeated 24 h later (−24 h).
Subjects reported for the exhaustive exercise session having followed the pre-assessment guidelines. Subjects rested in a supine position for 30 min, prior to an indwelling, 20 gauge catheter being placed in the antecubital vein and a resting blood sample drawn (0 h). Subjects were fitted with a Polar heart rate (HR) monitor and were permitted time to warm-up and stretch. Subjects then completed a prolonged exercise run on the treadmill until volitional fatigue,
60, and 75 min into the exercise bout. Strong verbal encouragement was given to subjects towards the end of the exercise session to ensure a truly fatiguing exercise session. Subjects completed a ~5 min cool down, prior to a post-exercise blood sample being taken (+0 h). Subjects reported back to the laboratory at the same time of day 24 (+24 h), 48 (+48 h), and 72 (+72 h) hours after the exhaustive exercise bout, where blood samples were again drawn.
Subjects were asked to maintain a similar diet and activity level compared to the pre-EES period during this 72 h of recovery, and the latter involved only activities of daily living and no exercise training.
Biochemical analysis
All blood samples were drawn in EDTA-treated tubes and placed on ice until processing. Whole blood aliquot samples were analyzed for hematocrit (Hct) and hemoglobin (Hb). Remaining sample aliquots were centrifuged at 4 °C for 15 min at 3000 rpm (Centra-8R IEC, MA).
Separated plasma was frozen at −80 °C until hormonal analysis. Triplicate measurements of Hct and Hb were used to estimate plasma volume shifts during the fatiguing exercise bout (Dill and Costill 1974).
Hormonal concentrations of cortisol (C) and free testosterone (fT) were assessed in all samples,
while glucose (G) was assessed in only −48, −24, 24, 48, 72 h, to exclude blood glucose changes as a confounding factor. All assessments were completed using highly specific, single-antibody sole phase radioimmunoassay kits that were specific for each hormone (DPC Inc., Los Angeles, CA, USA). All hormonal measurements were made with duplicate determination and were performed by highly trained technicians. Between and within coefficients of variation for all assays were less than 10 % for all biochemical analyses.
Statistics
Repeated measures analysis of variance (REPANOVA) over time was used to assess differences in cortisol, testosterone and glucose concentrations (SPSS version 21.0; IBM, Armonk, New York, USA). Fisher LSD post hoc procedures were used to identify significant differences between each level. Pearson-Product moment correlations were used to assess the relationship between cortisol and testosterone immediately following the EES (+0 h). Significance for all statistical tests was set a priori at α ≤ 0.05.
Results
Subjects all presented VO2max values that confirmed they were highly trained aerobic endurance
athletes (Table 1). The exercise session was successful in exhausting the athletes, and resulted in athletes running at 74.7 ± 4.6 % of VO2max for 96.9 ± 10.8 min (details presented in Table 2).
Table 1. VO2max test (X±SD)
Age (years)
BMI (kg/m2)
VO2max(ml/kg/min) VT (% of VO2max)
RPE (6–20 scale)
HRmax(bpm) Running Speed (km/h)
22.8 ± 3.1 22.1 ± 0.8 66.3 ± 4.8 74.65 ± 4.6 19.3 ± 0.8 198.8 ± 4.7 17.8 ± 1.4 BMI body mass index, VO2max maximal oxygen uptake, VT ventilatory threshold, RPE rate of
perceived exertion, HRmax maximum HR at the end of the test, running speed maximal running
speed
Table 2. Exhaustive exercise session (X ± SD)
Time (minutes) VO2(ml/kg/min) HR (bpm) RPE (6–20 scale) VO2 (% of VT)
5 47.6 ± 6.3 154.9 ± 3.8 11.6 ± 0.7 95.9 ± 2.9
30 49.8 ± 6.5 160.8 ± 4.2 13.1 ± 1.1 100.3 ± 2.7
60 51.2 ± 6.8 168.0 ± 5.2 15.1 ± 0.7 103.0 ± 3.0
75 52.7 ± 7.1 172.4 ± 5.5 16.6 ± 0.7 106.2 ± 3.2
VO2 oxygen uptake, HR heart rate, RPE rate of perceived exertion, VT ventilatory threshold
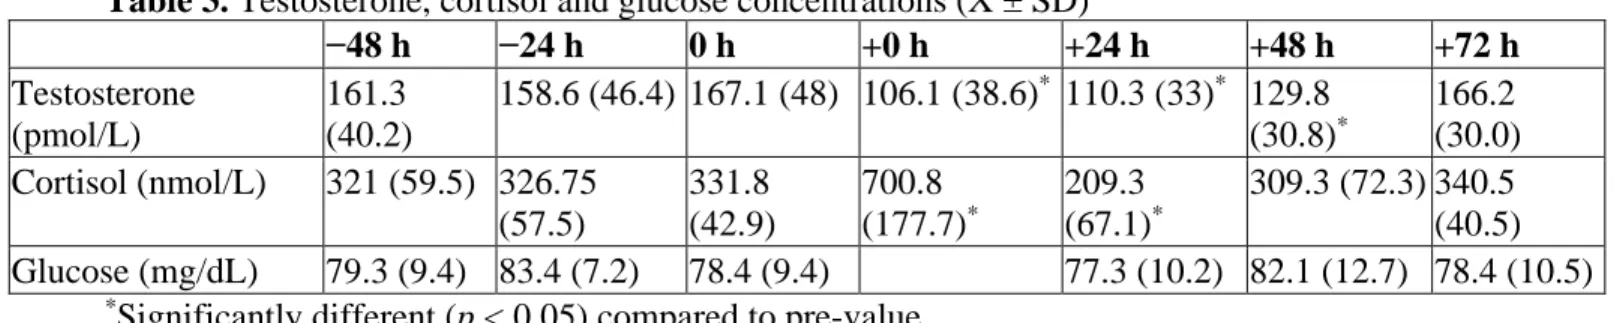
Table 3. Testosterone, cortisol and glucose concentrations (X ± SD)
−48 h −24 h 0 h +0 h +24 h +48 h +72 h
Testosterone (pmol/L)
161.3 (40.2)
158.6 (46.4) 167.1 (48) 106.1 (38.6)* 110.3 (33)* 129.8
(30.8)*
166.2 (30.0) Cortisol (nmol/L) 321 (59.5) 326.75
(57.5) 331.8 (42.9) 700.8 (177.7)* 209.3 (67.1)*
309.3 (72.3) 340.5 (40.5) Glucose (mg/dL) 79.3 (9.4) 83.4 (7.2) 78.4 (9.4) 77.3 (10.2) 82.1 (12.7) 78.4 (10.5)
*Significantly different (p < 0.05) compared to pre-value
Free testosterone
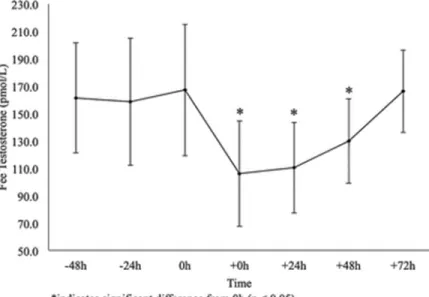
The REPANOVA and subsequent post hoc analysis revealed a significant decrease in fT following EES compared to pre-EES time points (−48 to 0 h; p = 0.053 to p = 0.001) that persisted for up to +48 h into recovery, before returning to baseline (pre-EES) levels at +72 h.
Cortisol
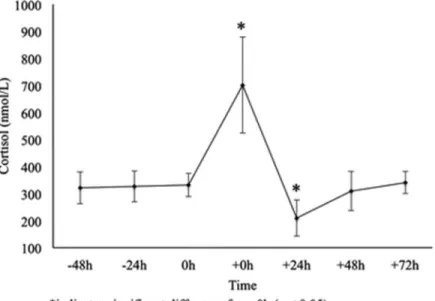
The REPANOVA and post hoc analysis revealed increases and decreases in C following EES compared to pre-EES. At +0 h, C was increased (p < 0.001) and decreased at +24 h (p < 0.002) before returning to baseline (pre-EES) levels.
Glucose
No differences were observed in glucose concentrations between any measurement times.
Correlations
fT:C ratio
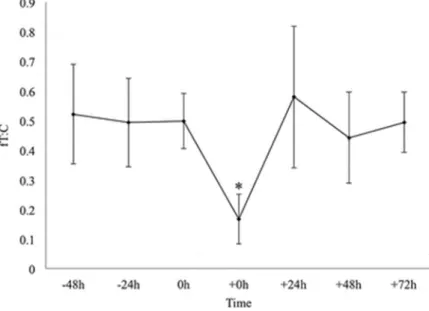
The REPANOVA revealed significant differences with post hoc analysis showing fT:C was significantly decreased at +0 h (0.167 ± 0.084) relative to all other time points (p < 0.005). The fT:C returned to pre-EES values at +24 h, with no significant differences between +48 h or +72 h compared to any pre-EES values. +24 h and +48 h (0.579 ± 0.239 vs. 0.441 ± 0.153) did,
however, approach significance (p = 0.086) relative to each other (power = 0.69, effect size 0.67).
Discussion
This study attempted to provide a more extensive understanding of the effects of exhaustive exercise on testosterone and cortisol concentration dynamics during recovery. The pre-exercise C and fT values were within normal ranges (Hellman et al. 1970; Zitzmann and Nieschlag 2001) and followed regular responses to exercise as previously observed in the literature (Kuoppasalmi et al. 1980).
The extended time frame with which these hormonal markers were assessed clearly demonstrate that 48–72 h of recovery may be required to return C and fT levels to resting levels following exhaustive exercise (Figs. 1, 2). This time to recovery is more extensive than has previously been observed, even in response to competitive rugby (38 h) and soccer (24 h) matches (Cunniffe et al. 2010; Ispirlidis et al. 2008), although some studies report an elevation in fT 6 days following a rugby competition (Elloumi et al. 2003). This elevation in testosterone is a curious finding relative to the 48 h of testosterone depression observed both in the present study and in triathletes (Urhausen and Kindermann 1987), and may be related to the high-intensity, intermittent nature of the sport of rugby.
Fig. 2 Cortisol dynamics over the course of the study. The depicted values are mean ± SD
Fig. 3 The relationship between testosterone and cortisol immediately post-exhaustive exercise
Following exercise, the negative relationship between cortisol and testosterone (Fig. 3) suggests that the elevated cortisol levels may be acting as a testosterone suppressor. Indeed, this
mechanism has been suggested since early investigations demonstrated that orally ingested cortisol resulted in testosterone suppression without changes in follicle-stimulating hormone or luteinizing hormone (Doerr and Pirke 1976). In agreement with the point, an investigation by Cumming et al. (1983) found that elevated levels of both endogenous and exogenous
recovery. This was suggested to possibly be a result of concurrent release of C and fT from the adrenal cortex, or as a result of plasma volume shifts (Daly et al. 2005).
The present results suggest that cortisol returns to baseline more rapidly than testosterone (48 vs. 72 h). In fact, following the large elevations in cortisol concentration immediately post-exercise, the subsequent 24 h are characterized by a decrease in cortisol that overshoots baseline values and must then gradually increase to return to baseline levels. In agreement with our findings, Kraemer et al. (2009) found cortisol levels in American football players to be depressed for 44– 48 h following a collegiate match, a similar pattern as that observed in other exercise stressors such as wresting (Passelergue and Lac 1999), and rugby (Cunniffe et al. 2010; Elloumi et al. 2003). This cortisol depression has been suggested to be a result of an enhanced anabolic “rebound” stimulus during recovery (Cunniffe et al. 2010). However, it may also be a result of nutritional status of the athlete prior to and following the exercise stimulus. Future studies should be aware of carbohydrate intakes during these periods, as this will be a major influence on
endocrine responses, even when sampling occurs at consistent time points (Lane et al. 2010). The rapid decrease in cortisol concentration is in contrast to testosterone concentrations which present a much more gradual increase back to baseline values, following the post-exercise suppression. The decoupling of the cortisol and testosterone relationship following +0 h, however, is possibly due to the fast response of the HPA axis and the short half-life of cortisol (Few 1974), resulting in increased cortisol clearances; whereas the hypothalamic–pituitary– gonadal axis requires extended time to adequately respond and stimulate gonadal testosterone production following glucocorticoid suppression of GnRH and LH.
Fig. 4 Free testosterone to cortisol ratio over the course of the study
hypothesis that a negative relationship only exists between these hormones when cortisol is significantly elevated (>160 % of baseline values) (Brownlee et al. 2005). Our results show that cortisol concentrations are significantly reduced below baseline resting values within 24 h of recovery from an exhaustive exercise bout and although further research is needed to confirm this finding, these results challenge the notion that fT:C is a useful metric for monitoring the anabolic/catabolic status of an athlete during recovery as has been previously suggested (Banfi and Dolci 2006), especially during the acute recovery phase.
The present study was limited by the frequency of sample collection; future studies should employ more frequent blood sampling so the exact nature of the fT:C dynamics could be more appropriately categorized. In addition, the present study included only 12 male subject endurance athletes and limited biomarker analysis. The sample size clearly affected the statistical power of our fT:C ratio analysis (postmortem power calculation = 0.69; effect size = 0.66). To reach a statistical significant finding, a calculated sample size of 16 would be required, thereby resulting in data for fT:C only trending towards significance (i.e., +24 h and +48 h). Future studies should also expand on these results by analyzing additional neuroendocrine biomarkers (e.g., prolactin, growth hormone, catecholamines), specifically in women and those of varying fitness levels undertaking varied training modalities.
Conclusion
To summarize and conclude, following an exhaustive exercise bout, 48 h of recovery may be required for cortisol to return to baseline values and testosterone may require up to 72 h of recovery. Furthermore, cortisol and testosterone appear to be only correlated immediately post-exercise, although the ratio of these two hormones may follow an oscillating response, thus requiring future studies to perform more frequent measurements throughout the same time course. These findings support the notion that following strenuous exercise, similar to a prolonged competitive event, several days of rest may be necessary to re-establish a complete hormonal equilibrium.
Notes
Acknowledgments. The authors wish to thank the subjects for their time and efforts in this
project. Additionally, the authors are grateful to Dr. Atko Viru, Tartu University, Estonia, for his valuable insight into the interpretation of the data.
Compliance with ethical standards
Conflict of interest. The authors declare no conflicts of interest.
References
ACSM (2013) ACSM’s guidelines for exercise testing and prescription, Lippincott Williams & Wilkins
Bambino TH, Hsueh AJ (1981) Direct inhibitory effect of glucocorticoids upon testicular luteinizing hormone receptor and steroidogenesis in vivo and in vitro. Endocrinology 108(6):2142–2148
Banfi G, Dolci A (2006) Free testosterone/cortisol ratio in soccer: usefulness of a categorization of values. J Sports Med Phys Fitness 46(4):611–616
Brownlee KK, Moore AW, Hackney AC (2005) Relationship between circulating cortisol and testosterone: influence of physical exercise. J Sport Sci Med 4(1):76
Cumming D, Quigley M, Yen S (1983) Acute suppression of circulating testosterone levels by cortisol in men. J Clin Endocr Metab 57(3):671–673
Cunniffe B, Hore AJ, Whitcombe DM, Jones KP, Baker JS, Davies B (2010) Time course of changes in immuneoendocrine markers following an international rugby game. Eur J Appl Physiol 108(1):113–122
Daly W, Seegers C, Timmerman S, Hackney A (2004) Peak cortisol response to exhausting exercise: effect of blood sampling schedule. Med Sport 8(1):17–20
Daly W, Seegers CA, Rubin DA, Dobridge JD, Hackney AC (2005) Relationship between stress hormones and testosterone with prolonged endurance exercise. Eur J Appl Physiol 93(4):375– 380
Dill D, Costill DL (1974) Calculation of percentage changes in volumes of blood, plasma, and red cells in dehydration. J Appl Physiol 37(2):247–248
Doerr P, Pirke KM (1976) Cortisol-induced suppression of plasma testosterone in normal adult males. J Clin Endocr Metab 43(3):622–629
Duclos M, Corcuff JB, Rashedi M, Fougere V, Manier G (1997) Trained versus untrained men: different immediate post-exercise responses of pituitary adrenal axis. A preliminary study. Eur J Appl Physiol Occup Physiol 75(4):343–350
Elloumi M, Maso F, Michaux O, Robert A, Lac G (2003) Behaviour of saliva cortisol [C],
testosterone [T] and the T/C ratio during a rugby match and during the post-competition recovery days. Eur J Appl Physiol 90(1–2):23–28
Hackney A, Dobridge J (2003) Exercise and male hypogonadism: testosterone, the hypothalamic-pituitary-testicular axis, and physical exercise. In: Winters S (ed) Male
hypogonadism: basic, clinical, and therapeutic principles. Humana Press, Totowa, pp 305–330
Hellman L, Nakada F, Curti J, Weitzman ED, Kream J, Roffwarg H, Ellman S, Fukushima DK, Gallagher TF (1970) Cortisol is secreted episodically by normal man. J Clin Endocrinol Metab 30(4):411–422
Hough JP, Papacosta E, Wraith E, Gleeson M (2011) Plasma and salivary steroid hormone responses of men to high-intensity cycling and resistance exercise. J Strength Cond Res 25(1):23–31
Ispirlidis I, Fatouros IG, Jamurtas AZ, Nikolaidis MG, Michailidis I, Douroudos I, Margonis K, Chatzinikolaou A, Kalistratos E, Katrabasas I, Alexiou V, Taxildaris K (2008) Time-course of changes in inflammatory and performance responses following a soccer game. Clin J Sport Med 18(5):423–431
Kraemer WJ, Spiering BA, Volek JS, Martin GJ, Howard RL, Ratamess NA, Hatfield DL, Vingren JL, Ho JY, Fragala MS, Thomas GA, French DN, Anderson JM, Hakkinen K, Maresh CM (2009) Recovery from a national collegiate athletic association division I football game: muscle damage and hormonal status. J Strength Cond Res 23(1):2–10
Kuhn J, Gay D, Lemercier J, Pugeat M, Legrand A, Wolf L (1986) Testicular function during prolonged corticotherapy. Presse Med (Paris, France: 1983) 15(12):559–562
Kuoppasalmi K, Naveri H, Harkonen M, Adlercreutz H (1980) Plasma cortisol, androstenedione, testosterone and luteinizing hormone in running exercise of different intensities. Scand J Clin Lab Invest 40(5):403–409
Lac G, Berthon P (2000) Changes in cortisol and testosterone levels and T/C ratio during an endurance competition and recovery. J Sports Med Phys Fitness 40(2):139–144
Lane AR, Duke JW, Hackney AC (2010) Influence of dietary carbohydrate intake on the free testosterone: cortisol ratio responses to short-term intensive exercise training. Eur J Appl Physiol 108(6):1125–1131
Moore A, Timmerman S, Brownlee K, Rubin D, Hackney A (2005) Strenuous, fatiguing exercise: relationship of cortisol to circulating thyroid hormones. Int J Endocrinol Metab 3(1, Winter):18–24
Passelergue P, Lac G (1999) Saliva cortisol, testosterone and T/C ratio variations during a wrestling competition and during the postcompetitive recovery period. Int J Sports Med 20(2):109–113
Tietz NW (1995) Clinical guide to laboratory tests. WB Saunders Co, Philedelphia
Tremblay MS, Copeland JL, Van Helder W (2005) Influence of exercise duration on post-exercise steroid hormone responses in trained males. Eur J Appl Physiol 94(5–6):505–513
Urhausen A, Kindermann W (1987) Behaviour of testosterone, sex hormone binding globulin (SHBG), and cortisol before and after a triathlon competition. Int J Sports Med 8(5):305–308
Urhausen A, Gabriel H, Kindermann W (1995) Blood hormones as markers of training stress and overtraining. Sports Med 20(4):251–276
Viru AA, Viru M (2001) Biochemical monitoring of sport training: Human Kinetics
Wasserman K (1984) The anaerobic threshold measurement in exercise testing. Clin Chest Med 5(1):77–88
Yeh M, Gardner R, Adams T, Yanowitz F, Crapo R (1983) “ Anaerobic threshold”: problems of determination and validation. J Appl Physiol 55(4):1178–1186
Zitzmann M, Nieschlag E (2001) Testosterone levels in healthy men and the relation to