RELATIONSHIPS AMONG ACCESS TO BUS RAPID TRANSIT, URBAN FORM,
AND HOUSEHOLD TRANSPORTATION OUTCOMES: EVIDENCE FROM A
QUASI-LONGITUDINAL STUDY IN BOGOTÁ, COLOMBIA
Tabitha S. Combs
A dissertation submitted to the faculty of the University of North Carolina at Chapel Hill
in partial fulfillment of the requirements for the degree of Doctor of Philosophy in the
Department of City and Regional Planning
Chapel Hill
2013
ABSTRACT
TABITHA S. COMBS: Relationships among access to Bus Rapid Transit, urban form, and household transportation outcomes: Evidence from a quasi-longitudinal study in Bogotá,
Colombia
(under the direction of Daniel A. Rodríguez)
Bus Rapid Transit (BRT) has become popular as a means to provide reliable, non-automobile-based mobility and alleviate impacts of rising traffic congestion in cities around the world. To date, however, there is little empirical evidence supporting BRT’s potential to meet these objectives, and limited understanding of the urban form conditions necessary to support BRT. This research improves knowledge of BRT’s potential as an alternative to vehicle ownership at the household level and provides new evidence of the role of urban form in supporting transit investment.
households appears to be reversed in neighborhoods where urban form supports transit and non-motorized travel. This finding suggests the importance of a concerted effort to coordinate transit interventions with urban development policies that support those interventions, particularly in lower wealth neighborhoods.
ACKNOWLEDGEMENTS
I would like to express my profound gratitude to my adviser and mentor, Daniel
Rodríguez, for the generosity, patience, and support he has shown throughout my graduate school career. He has always been ready to share an idea or help me work through a puzzle, and always seemed to know when I needed a nudge. I am truly fortunate to have had the opportunity to work with him.
I would also like to thank my committee members, Todd BenDor, Philip Berke, Noreen McDonald, and Yan Song, for the feedback, encouragement, and genuine interest they showed in me and in my work. I’d also like to recognize my surrogate advisers in Bogotá, Arturo Ardila and Olga Lucía Sarmiento, as well as Germán Lleras, Carlos Pardo, and Diego Murcía, for their thoughtful suggestions and warm hospitality.
I am grateful for my friends and colleagues at UNC, who commented on draft after incoherent draft of my dissertation: Mary Donegan, Marc Howlett, Ward Lyles, Louis Merlin, Laura Sandt, and Danielle Spurlock. Without their help, this dissertation might have still happened, but it wouldn’t make a lick of sense.
TABLE OF CONTENTS
LIST OF TABLES ... ix
LIST OF FIGURES ... xi
Chapter I. INTRODUCTION ... 1
Research overview ... 6
Setting overview ... 8
II. HISTORY OF TRANSIT REFORM IN BOGOTÁ ... 14
Transit situation in Bogotá before TransMilenio ... 15
Reform attempts beginning in 1980 ... 17
Peñalosa’s vision: TransMilenio ... 25
Lessons... 32
III. ISSUES IN MEASURING THE BUILT ENVIRONMENT FOR TRAVEL BEHAVIOR RESEARCH ... 34
Research objectives ... 35
Measurement of the built environment ... 39
Contexts ... 46
Summary ... 48
IV. VEHICLE OWNERSHIP ... 49
Literature and empirical precedents ... 49
Research questions and conceptual approach ... 56
Research design ... 61
Data ... 67
Results ... 76
Discussion ... 97
Conclusions ... 100
V. MOBILITY OF LOW-INCOME, TRANSIT-CAPTIVE HOUSEHOLDS ... 101
Theoretical framework ... 108
Conceptual approach ... 113
Data ... 114
Analytical approach ... 117
Results ... 120
Discussion ... 132
Conclusions ... 136
VI. OVERALL CONCLUSIONS, LIMITATIONS, AND CONTRIBUTIONS TO SCHOLARSHIP ... 138
Review of findings ... 138
Limitations ... 142
Conclusions ... 154
APPENDIX I ... 159
APPENDIX II ... 163
LIST OF TABLES
Table
1. Distribution of surveyed households by year ... 61
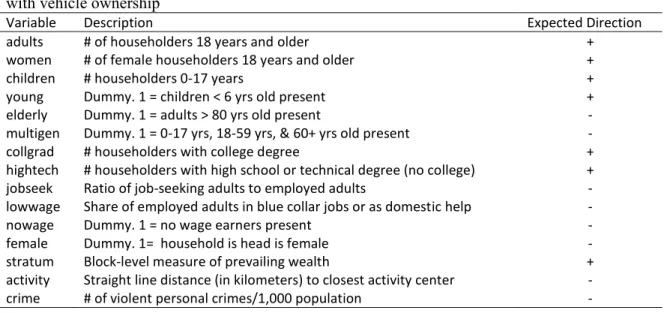
2. Descriptions of household characteristics variables and expected direction of relationship with vehicle ownership ... 70
3. Description of transit access variables and expected direction of association vehicle ownership ... 71
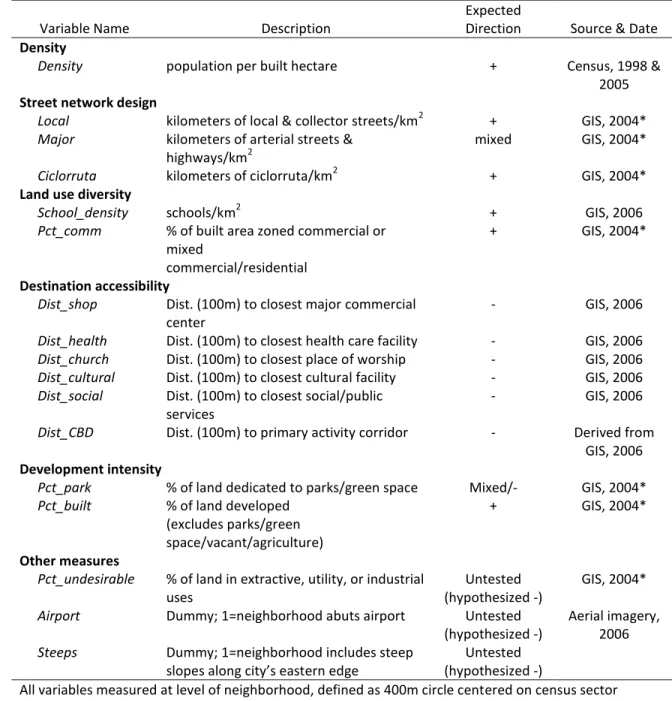
4. Description of built environment measures, expected relationship with vehicle ownership, and source ... 75
5. Percent of households with at least one vehicle ... 76
6. Summary statistics of household characteristics ... 77
7. Percent of difference, using standardized differences, between treatment and control groups for household characteristics covariates ... 79
8. Summary statistics for urban form measures ... 81
9. Results of exploratory factor analysis ... 82
10. Z-scores of urban form attributes ... 83
11. Logistic regression results for BRT access models, higher-wealth households ... 86
12. Adjusted associations between urban form and vehicle ownership; higher-wealth.... 87
13. Logistic regression results, BRT access & urban form, higher-wealth households ... 88
14. Full (un-interacted) model results, higher-wealth households ... 89
15 Logistic regression results for BRT access models, lower-wealth households ... 90
16. Adjusted associations between urban form and vehicle ownership; lower-wealth ... 93
17. Logistic regression results, BRT access & urban form, lower-wealth households ... 95
18. BRT access buffer definitions ... 116
19. Descriptive statistics of mobility measures for low-wealth, car-less households ... 12`
21. Count regression model of non-car tour frequency (Poisson) ... 126 22. Count regression model of discretionary tour frequency (negative binomial) ... 127 23. Generalized ordered logit regression of travel purpose diversity ... 128 24. Correlation coefficients (Pearson’s r) between proximity and variables loading
LIST OF FIGURES
Figure
1. Overarching conceptual framework ... 8
2. Study area and region ... 10
3. Timeline of transit reform initiatives ... 18
4. Net residential density & commercial activity, 2000 ... 31
5. Conceptual framework, analysis I... 57
6. Conceptual approach, analysis I-a ... 58
7. Conceptual approach, analysis I-b ... 61
8. Location of BRT service and surveyed households, by wealth segment ... 65
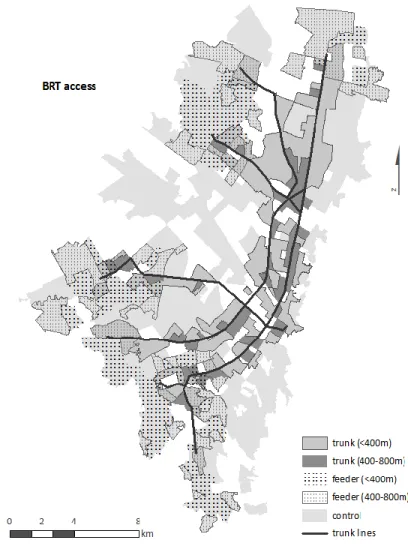
9. Trunk and feeder access by census sector ... 72
10. Predicted probability of vehicle ownership: higher-wealth households ... 86
11. Change in vehicle ownership rates among lower-wealth households from pre-test to post-test ... 92
12. Predicted probability of vehicle ownership; fully-interacted feeder access model for lower-wealth households ... 96
13. Common conceptualization of built environment/travel behavior relationship ... 105
14. Modified conceptualization of built environment/vehicle ownership/ travel behavior relationship... 106
15. Conceptual approach, analysis II ... 114
16. Predicted number of tours for a representative household, by feeder access and proximity to destinations ... 130
CHAPTER 1. INTRODUCTION
Constrained urban road space and poor traffic management have led to paralyzing congestion in the major cities of the developing world, even with relatively low levels of automobile ownership (Gwilliam, 2003; Pucher et al., 2007; Sam John, 2010). This severe
congestion has dramatically reduced the reliability and speed of traditional bus transport systems, and has, in a few cases, caused public transit to collapse altogether. Not surprisingly, a rapidly growing number of households in these situations are abandoning transit, opting for other forms of transportation such as taxis, motorcycles, and cars, and in some cases cutting their travel times by nearly one third (Willoughby, 2000; Creutzig and He, 2008).
For households that can afford it, vehicle ownership is the most promising and immediate means of closing the growing gap between the demand for and the supply of personal mobility (Barter et al., 2003; Chapman, 2007; Pucher et al., 2007).
Accordingly, motor vehicle ownership rates are skyrocketing across the developing world (Fajnzylber and Nash, 2009). Between 1990 and 2005, the number of registered vehicles in non-OECD1 countries more than doubled, from 100 million to 210 million (Dargay and Hanly, 2007). Some estimates have projected the total number of motor vehicles in the world will jump from 800 million in 2002 to two billion in 2030, with eighty percent of that growth occurring in the developing world (Dargay and Hanly, 2007; Lescaroux, 2010).
While motor vehicle ownership represents vast improvements in mobility and accessibility for households that can afford it, at the metropolitan level, vehicle ownership’s benefits give way to extraordinary social, environmental, and public health costs (Vasconcellos,
2001; Reddy, 2002; Chapman, 2007). Dozens of cities around the world are attempting to combat these consequences by overhauling their public transportation, most commonly in the form of Bus Rapid Transit (BRT) (Sam John, 2010). Whether BRT has the potential to temper the rise in vehicle ownership, however, is not yet understood.
The motorization problem
As vehicle ownership rates rise, vehicle use rises even more quickly, both in the number of motorized trips taken and the vehicle miles traveled by motorized households (Frank et al., 2006). This is in large part because when households acquire vehicles, they tend to rely heavily on them, even for trips for which other modes might have been easier, cheaper, or faster (Gärling et al., 2001; Böhler et al., 2006). This over-reliance leads to habituation; once a household becomes habituated to driving, alternative modes rarely enter the household’s mode-choice decision framework (Zhang, 2006; Chen and Lai, 2011). Car-owning households gradually spend more and more time in the car, making more and longer trips.
Developing cities are plagued with limited transportation infrastructure, and the increase in vehicle trips and vehicle miles traveled (VMT) quickly backfires, resulting in even more untenable congestion that lengthens commute times, marginalizes nonmotorized modes, and further undermines public transit. In short, while obtaining a motor vehicle can dramatically improve a household’s mobility, the rapid rise in vehicle ownership leads quite quickly to a rapid decline in mobility for the rest of the city (Ingram and Liu, 1999; Kitamura et al., 1999). The decline in mobility hits nonmotorized households hardest, and in many cities, those households must choose between diminished mobility (and access to jobs and opportunities) altogether or spending a growing percentage of their income to purchase and use a car or motorcycle themselves (Gwilliam, 2003; Creutzig and He, 2008).
In addition to increasing congestion and decreasing mobility, the rise in vehicle
injuries and deaths. The World Health Organization estimates that ninety percent of the nearly 1.2 million yearly deaths from traffic accidents occur in developing cities, and that the rate of traffic injuries and deaths in the developing world will rise disproportionately in the future.
Nonmotorized road users from lower socioeconomic groups make up the vast majority of these injuries and deaths (Peden et al., 2004).
Increased vehicle ownership has also been linked to a rapid increase in the prevalence of obesity and related diseases. Investigations on five continents – including in developing countries – have shown significant positive correlations between vehicle ownership and/or use and the likelihood of being obese (e.g., Frank et al., 2004; Bell et al., 2006; Lopez-Zetina et al., 2006; Bassett et al., 2008; Parra et al., 2009). Like the rise in motorization, the rise in obesity is more rapid in the developing world where the obesity rate tripled between 1980 and 2000 (Reddy, 2002; Caballero, 2007). Obesity-related diseases are also projected to rise in developing countries. For example, while the rate of type II diabetes is expected to double globally from 2000 to 2030, it will nearly triple in the developing world during the same period of time (Hossain et al., 2007).
Finally, the rapid rise in vehicle ownership, coupled with low-quality fuels and poor vehicle maintenance, has helped make transportation the largest and fastest-growing source of carbon and particulate matter emissions in developing cities (Chapman, 2007; Fajnzylber and Nash, 2009). Transportation is responsible for at least a third of urban air pollution in the
Challenges of slowing motorization without slowing mobility
Slowing the pace of motorization and reducing reliance on private motor vehicles is critical for social, environmental, and public health reasons. However, doing so without further limiting mobility and accessibility is proving to be a very difficult task, given the potential individual benefits motor vehicle ownership offers. Incentive-based approaches, such as
providing free bus passes to motorists, are costly and have seen only limited success (Thøgersen and Møller, 2008). Economic measures, such as the auctioning off of license plates and vehicle permits in Singapore and Shanghai and congestion charging in London, have been effective, but are also contentious and can have unintended negative impacts on low-income households (Willoughby, 2001; Santos and Shaffer, 2004; Cao and Xu, 2010; Hamilton, 2010). Similarly, regulatory schemes such as day-of the-week-based driving restrictions have been seen as heavy-handed and inequitable. In some cases, they have been found to induce households to purchase additional vehicles (Chapman, 2007; Davis, 2008), exacerbating congestion and air pollution. For example, license-plate-based driving restrictions in Mexico City were found to induce households to purchase additional vehicles and make more, rather than fewer, motorized trips (Eskeland and Feyzioglu, 1997; Davis, 2008). More recently, the expansion of peak-hour driving restrictions and incorporation of motorcycles in to the restriction scheme in Bogotá, Colombia appears to be generating a similar demand for additional vehicles there (El Tiempo, 2009).
By decreasing travel and wait times and improving safety and reliability over traditional bus transit systems, many cities around the world have witnessed dramatic increases in transit ridership upon implementing BRT (Darido and Cain, 2007). In a 2009 study of seventeen new BRT systems in North America, Europe, and Australia, the Federal Transit Administration reports that transit ridership increased in nearly all cases, and more than doubled in six cities after BRT implementation. Ridership gains may be even more impressive in some Asian and South American cities. For example, Beijing’s first BRT phase has 85,000 weekday boardings, and new systems in Guayaquil (Ecuador) and Pereira (Colombia) each boast 100,000 weekday boardings (FTA, 2009). Guangzhou’s (China) new BRT system reached 800,000 weekday boardings in its first month of service (Gunter, 2010), and Bogotá’s TransMilenio now has 1.5 million daily boardings (FTA, 2009).
Despite the impressive gains in transit ridership, however, very little is known about the potential impacts of BRT investment on motor vehicle ownership or long-term vehicle use decisions at the household level. There have been no empirical investigations of the relationship between BRT and household vehicle ownership, and thus far, there is little evidence that BRT investment is itself capable of influencing vehicle ownership or long-term use decisions.
BRT’s potential
Over the past several decades, studies of transit ridership have converged on a general conclusion: the effectiveness of transit, including BRT, is greatest when the system is
use a car for non-transit trips as well, reducing the likelihood that households become habituated to driving.
Thus, a transit-supportive environment could enable nonmotorized, within-neighborhood trips by providing a mix of land uses and destinations and a safe, pleasant, and productive walking environment. It can also enable more transit travel by improving access to transit stops and, through increased densities, promoting better, more cost-effective transit service. This is the basis for transit-oriented development strategies worldwide, and is backed up by empirical research on transit ridership (Gilat and Sussman, 2003; Cervero, 2007). Rail transit stations in dense, walkable neighborhoods with heavy mixing of land uses have consistently supported greater transit ridership than stations in more automobile-oriented locales (Frank and Pivo, 1994; Cervero, 2007); more recent research finds a similar relationship between station-area urban form and BRT ridership (Estupiñán and Rodríguez, 2008). However, empirical research on whether coordination of land use and transit is not simply inducing transit ridership, but actually
alleviating motorization pressure by improving mobility, is limited, and largely nonexistent in the developing world.
Before spending scarce resources on elaborate new transit systems, it is critical to understand whether they can bring about desired changes in mobility and travel behavior, and under what conditions. The objectives of this study are to improve our understanding of (a) BRT’s potential to alleviate pressures on households to own motor vehicles by expanding non-car mobility options, and (b) the role urban form plays in supporting that potential.
Research overview
Research questions
I focus on three research questions. The first two questions directly address the relationship between vehicle ownership and BRT:
2. Is the relationship between BRT and vehicle ownership influenced by or contingent upon the supportiveness of neighborhood-scale urban form?
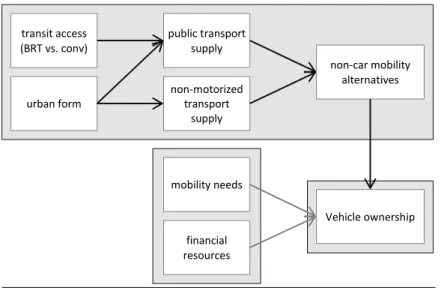
The third question takes a more nuanced approach to the potential impacts of BRT by examining the relationship between BRT access and a possible predictor of vehicle ownership: non-car mobility.
3. How does BRT access influence non-car mobility patterns of transit-dependent households?
Examining these research questions at the household level will help decision makers set realistic expectations for BRT investment and understand how to support that investment with appropriate land development policies.
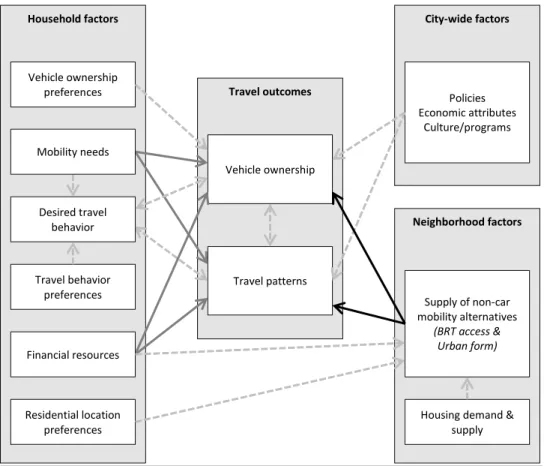
Conceptual approach
Figure 1. Overarching conceptual framework
Setting overview
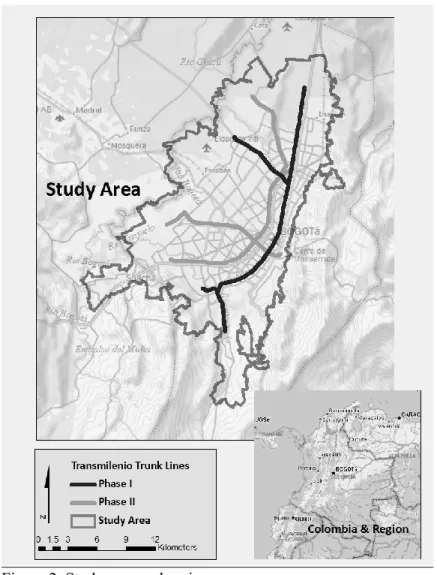
This research focuses on the TransMilenio BRT system, in Bogotá, Colombia. Bogotá is the capital and largest city in Colombia, with a population of nearly 7.5 million at the time of the 2005 census (DANE, 2007). Bogotá’s BRT system, TransMilenio, is one of the earliest and most successful wide-scale BRT systems in the world, and has often been held up as the gold standard in low-cost, sustainable urban transport solutions. The time period for this study is 1995 to 2005, from five years before construction began on TransMilenio’s first implementation phase until just after completion of the second.
Prior to TransMilenio’s opening, Bogotá’s transit riders were served by a complex, but loosely regulated system of private bus companies (route owners), bus owners, and bus drivers. By the early 1980s, hyper-competition in the transit market had led to dangerous, heavily
congested streets, high fares, and long travel times for transit riders (Rodríguez and Ardila, 2002). City-wide factors
Travel outcomes
Neighborhood factors Household factors
Vehicle ownership
Travel patterns
Residential location preferences Vehicle ownership
preferences
Supply of non-car mobility alternatives
(BRT access & Urban form)
Policies Economic attributes
Culture/programs
Housing demand & supply Travel behavior
preferences Desired travel
behavior
Simultaneously, the city was experiencing rapid private motorization: between 1991 and 1995, the number of cars registered in Bogotá increased by 75 percent (Echeverry et al., 2005). City officials had been working since the early 1980s to reform the transit network, but with limited success. The notion of a full-fledged bus rapid transit system was introduced in 1998 to combat the city’s sustained mobility crisis. Construction began within two years, with the first line opening in December 2001 (Ardila, 2004).
TransMilenio functions much like a metro rail system, but uses buses operating on surface streets. As of the end of the second phase of implementation in 2005, the system consisted of 84 kilometers of dedicated, physically-segregated busways (trunk lines) traversing the city from north to south, and a large network of feeder buses that collect passengers from sprawling areas beyond the ends of the trunk lines. The trunk system at the end of Phase II included 841 articulated buses (each with a capacity of 160 passengers) serving 104 covered, elevated boarding platforms at approximately 700-meter intervals. The boarding platforms are located in the middle of the road, accessed via pedestrian overpasses and protected street-level crossings. Fares are pre-paid using smart-cards and passengers enter the vehicles at-grade, facilitating rapid boardings and alightings and short dwell times. The feeder system has 344 smaller, green buses (capacity 80) covering 541 kilometers of local streets, collecting passengers from seven peripheral zones and bringing them, fare-free, into the trunk system. Feeder buses stop at approximately 300-meter intervals and are coordinated via satellite to minimize transfer times. Service is provided eighteen hours a day, with peak-time minimum trunk headways of two minutes and feeder headways of three minutes (Hidalgo, 2003, 2004; Echeverry et al., 2005; Hidalgo and Graftieaux, 2008).
In its first three years of operation, TransMilenio was credited with a 32 percent decrease in average commute times, a forty percent reduction in transport-related air pollution (Cervero, 2005), and an 88 percent drop in traffic-related deaths along the BRT corridors (UNEP, 2010). By 2009, TransMilenio had 1.5 million daily boardings, with an estimated nine percent of its
TransMilenio has been recognized worldwide in scholarly research and popular media as a low-cost, high-quality solution to rising levels of vehicle ownership and use worldwide
(Estupiñán and Rodríguez, 2008). Given the paucity of evidence regarding BRT’s impacts on motorization, and knowing that more than one hundred cities around the globe planning or building BRT systems, many of them based on the TransMilenio model, there is an urgent need to quantify and understand BRT’s potential impacts.
Study area
Figure 2. Study area and region
[2000-2003] and II [2003-2005]) are shown in Figure 2. The dedicated busway lines (“trunk” routes) are shown as solid lines. Feeder service areas surround the endpoints of each trunk line. Areas without trunk or feeder service are served by the conventional bus network.
History and accomplishments of TransMilenio
The planning and operations of TransMilenio is overseen by a public agency, TransMilenio S.A. The agency is also responsible for construction and maintenance of the system’s infrastructure. Private concessionaires own and operate vehicles in the system, and are contractually obligated to meet vehicle maintenance and performance standards laid out by TransMilenio S.A. Concessionaires are paid by TransMilenio S.A. according to the kilometers logged by their vehicles and the quality of service provided (Hidalgo, 2004).
Planning for Phase I began in 1998, with limited operations beginning in December 2000. Phase I was completed in early 2002, and consisted of 42 kilometers of trunk lines and feeder service covering 309 kilometers of peripheral surface streets (Hidalgo, 2004). Construction was overseen by the local Institute for Urban Development (IDU), and cost US $213 million (US $5.3 million per kilometer). Forty-six percent of the funds for Phase I came from a local fuel
surcharge, twenty-eight percent came from the partial privatization of the Bogotá Power Company, and twenty percent from the national government. The remaining six percent was financed through a loan from the World Bank (Hidalgo, 2004).
Construction on Phase II began in late 2000, with operations beginning in 2004. Phase II added three more trunk lines and 232 kilometers of feeder routes at a cost of US $545 million ($13.3 million per kilometer). The national government financed two-thirds of phase II, with the balance funded through local fuel taxes (Cain et al., 2006).
vehicles on Sundays and holidays) from 24 kilometers (in 1994) to 121 kilometers and introduced an annual city wide car-free day (Cervero et al., 2009). In 1998, Mayor Enrique Peñalosa also instituted pico y placa, a license-plate-based driving restriction scheme that keeps forty percent of privately owned vehicles off city streets on any given weekday (Ardila and Menckhoff, 2002). The city also undertook a massive effort to reclaim and revitalize public space, including bulldozing and converting into a park a sixty-acre slum in the center of town and reclaimed for public use sidewalk space that had been used illegally for years throughout the city as car parks (Peñalosa, 2011).
Ten months after TransMilenio’s initial opening in December 2001, the system was responsible for a 32 percent reduction in travel times for passengers. There were also substantial decreases in traffic accidents (from 26.5 per week in 2000 to 4.9 per week in 2001) and traffic-related injuries (from 18 per week to 4.5 per week) along the trunk corridors (Ardila and
Menckhoff, 2002). The replacement of older, conventional buses with new TransMilenio vehicles resulted in noticeable air quality improvements as well, with some neighborhoods seeing as much as a nine percent reduction in particulate matter pollution (Echeverry et al., 2005) within the first year of operations. At completion of phase I, the system carried 600,000 passengers per day (Ardila and Menckhoff, 2002), and in 2002, TransMilenio’s first full year of operations, the system carried 207 million passengers (Hidalgo, 2004). Eleven percent of Phase I passengers had come from previously private motorized modes, and the system had a 98 percent approval rating among users (Cervero, 2005). By the end of Phase II, the system was carrying nearly one quarter of the total travel demand in Bogotá, and had approximately 1.25 million boardings per day (Muñoz-Raskin, 2010).
prompting Mayor Gustavo Petro to temporarily suspend pico y placa (Hall, 2012). The original plan for TransMilenio had called for the construction of an additional 306 kilometers of trunk lines spread over sixteen years (Cain et al., 2006), but further expansions beyond phase II have been delayed due to funding shortfalls, resistance from conventional transit providers, and political wrangling over whether the city should instead be investing in heavy rail (Hutchinson, 2011). Nevertheless, TransMilenio’s ridership achievements are remarkable, and the system remains the gold standard for low-cost sustainable urban transport around the world. Whether TransMilenio’s successes translate to improved mobility and decreased dependence on private vehicles at household level, particularly for transit-dependent households, remains to be seen.
CHAPTER 2. HISTORY OF TRANSIT REFORM IN BOGOTÁ
TransMilenio was introduced in 1998 to combat a long-term, growing mobility crisis in Bogotá. As discussed in Chapter 1, the system was met with enormous initial success, and was popular and well-regarded at its outset. Since services began, ridership has continued to increase; the system today carries nearly 200,000 passengers per hour during peak travel times and nearly 1.7 million passengers per weekday (TransMilenio SA, 2012). Because of this success,
TransMilenio is often held up as the gold standard in low-cost, sustainable urban transport solutions for developing and developed cities around the world. However, since its early days, TransMilenio has also experienced protests over sub-par service levels and extreme
overcrowding. Funding shortfalls and political wrangling have delayed expansions repeatedly since the conclusion of Phase II, casting doubt on the system’s long-term viability in spite of the record-high ridership.
In this chapter, I step back and take a look at Bogotá’s recent history of mobility problems and attempted solutions leading up to TransMilenio. By broadening our lens, we can better understand why the system arose, and why it took its eventual form. For cities hoping to replicate Bogotá’s success, it is essential to understand the very unique political and institutional circumstances that motivated and shaped TransMilenio, as well as the nature and history of the mobility crisis TransMilenio was intended to address. Furthermore, we can start to understand why, despite skyrocketing ridership levels, TransMilenio has been so plagued since its early years by protests and delays.
up to the introduction of TransMilenio in 1998. Finally, I discuss the process through which TransMilenio arose and why TransMilenio succeeded when the efforts before it did not.
Transit situation in Bogotá before TransMilenio
Bogotá’s first organized public transit system was a mule-drawn streetcar service that began in 1884. The system was owned and operated by the U.S.-based Bogotá City Railway Company. Beginning in 1910, the system was gradually switched to electric vehicles. Following a boycott over service issues, the company transferred operations to the municipal government, which operated the system until 1951. In 1948, one quarter of the tram fleet was destroyed during riots; the system had already been losing steam and was being out competed by private bus service, which had begun in 1934. This bus service would eventually grow into Bogotá’s modern day conventional bus transit system (Sáenz, 2010).
With the dissolution of the tram service, the bus system became the city’s primary form of public transit. Transit service evolved into a complex, loosely regulated private enterprise, still in place in some parts of Bogotá today, wherein buses and routes are privately owned. Ownership of routes is awarded to bus companies by the city government, based on requests by the public or proposals put forth by the bus companies themselves. A route, once awarded, is guaranteed for life and is protected by law. Route owners generate revenue by contracting with bus owners to operate on their routes in exchange for set fees. Bus owners, in turn, hire drivers to ply those routes. Bus owners collect all farebox revenues, and pay their drivers commission based on the number of passengers picked up (Ardila, 2004).
By law, bus companies were required to own at least ten percent of the buses on their routes; in practice, they usually owned much fewer. Because of the structure of the transit system, bus companies had financial incentive to recruit more and more bus owners to their routes. Bus companies would maximize their recruiting power by lobbying the government for ownership of routes along the most heavily traveled corridors, regardless of the levels of service already present on those corridors (Ardila and Menckhoff, 2002). Lax enforcement allowed the unregulated entry of more and more buses, particularly along those most profitable corridors. From 1972 to 1978, the number of vehicles operating within the private bus network more than doubled, from 1,600 to 3,541 (Mohan, 1994). The influx of new buses meant stiffer competition for passengers, forcing bus drivers to race each other to collect fares (Echeverry et al., 2005). The aggressive tactics drivers used to compete for passengers made for chaotic roadway conditions, with extreme congestion and traffic accidents commonplace. This race for the next fare came to be known as the guerra del centavo, or the “penny war.”
In spite of the high levels of competition, subsidies and fare structures guaranteed bus owners a high rate of return on their bus investments, encouraging them to continue expanding their fleets. As the supply of buses rose, average occupancy plummeted. In order to maintain stable profits in the transit industry, the government was forced to allow increases in fares; from 1975 to 2004, average inflation-adjusted transit fares increased 400 percent (Echeverry et al., 2005).
four kilometers per hour in the central business district. The average one-way, ten-kilometer commute trip took seventy minutes (Echeverry et al., 2005).
Though congestion affects all road users, the flexibility of private cars enables them to navigate around and through traffic, giving private vehicle owners a decided travel time
advantage over conventional transit users under conditions of extreme congestion. As a result of increasingly poor and increasingly expensive transit service, vehicle ownership skyrocketed in Bogotá. From 1991 to 1995, the number of cars registered in the city jumped 75 percent (Echeverry et al., 2005), worsening congestion and intensifying the competition for transit passengers.
Nevertheless, by 1998 over 80 percent of the city’s population was still transit-dependent, and average travel time to work for transit users was nearing two hours (Ferro, 2011). The
growing gap in mobility between motorized and nonmotorized households (the average transit trip took 66.8 minutes, compared to 42.6 minutes for car trips) signaled that the problem was likely to worsen. In an effort to reverse the mobility crisis in Bogotá, Mayor Enrique Peñalosa introduced his plan to completely overhaul the public transit industry, reorganizing the chaos into a reliable, affordable, state-of-the-art bus rapid transit system, TransMilenio (Echeverry et al., 2005).
Reform attempts beginning in 1980
attempts at reform, discuss briefly why they failed (or did not stick) and why TransMilenio succeeded.2
Figure 3. Timeline of transit reform initiatives
Turbay’s Metro
In 1980, amid deteriorating mobility conditions, President Julio Turbay and his
appointee, Bogotá mayor Hernando Durán Dussán,3 commissioned a study to determine the best way to meet Bogotá’s projected travel demand over the next twenty years. The conclusion of that study was to invest in a mass heavy metro rail system. But before they could act on the results of the study, Turbay’s and Durán Dussán’s terms expired, leaving the task of implementing the plan for the metro to the next administration. However, the next administration was led by President Belisario Betancur, who wished to elevate the status of Colombia’s second-largest city, Medellín, relative to Bogotá. Betancur dropped the metro plan for Bogotá and instead focused the nation’s financial efforts on building a metro system for Medellín. This project would eventually be finished more than a decade later, with enormous cost overruns and amidst a controversy; the trouble in Medellín would also ultimately influence transit reform debates in Bogotá (Ardila, 2004).
Intermetro
President Virgilio Barco took office in 1986, and was determined to resurrect plans for a metro in Bogotá. Money was tight at the Federal level, however, so Barco and his appointed mayor, Julio Sánchez, proposed to cut costs by aligning the metro along existing freight rail corridors, even though those corridors aligned poorly with existing travel patterns. Barco and César issued an international request for proposals to build the system. Bids were received in 1998, by which time Barco and César had left office. The selection criteria favored low-cost plans, and resulted in the Italian firm Intermetro winning the contract, despite scoring poorly on technical quality, experience, and managerial capacity (Ardila, 2004).
Meanwhile, Medellín’s metro project was nearly out of funds, though nowhere near complete, and the idea of investing in another metro in Bogotá was beginning to lose favor at the
national level. Though the national government had already signed a contract with Intermetro to build Bogotá’s metro, Congress passed a law that shifted the burden of paying for construction of metro systems largely to local governments. This law limited the Federal government’s
contribution to construction of metro systems to twenty percent of the construction costs, and became known as the twenty percent law. The municipal government did not have the required eighty percent of the necessary to funds, so then-Mayor Andrés Pastrana (the first elected mayor in the history of Bogotá) backed the city out of the contract (Ardila, 2004).
Juan Martín Caicedo won a two year mayoral term in 1990 and immediately reversed course, declaring that Bogotá would indeed pursue Intermetro’s project. However, then-President César Gaviria was committed to the completion of Medellín’s metro, despite skyrocketing costs. The Gaviria administration sought help from experts about how to handle the metro project in Bogotá. The consensus was that Intermetro’s plan was too vague, severely underestimated costs and overestimated demand, was based on untested alignments that lacked the density to support heavy rail, would be unable to cover its operating costs, and pulled too many financial resources away from potentially more efficacious social projects. As one expert noted, the “planning process started with a preconceived solution and not with the definition of the problem. As a result, it quickly turned into an effort to justify a predetermined solution” (Ardila, 2004, p. 233). Given these strong objections, the national government decided against supporting Caicedo’s metro plans; without the financial support – even at the twenty percent level – Caicedo was forced to abandon the Intermetro plan once again.
Avenida Caracas Busway
sought the advice of transportation policy expert Jorge Acevedo, who had since 1986 been working on a plan to implement a busway corridor, to be serviced by public and private buses, along one of Bogotá’s main corridors, Avenida Caracas. Acevedo’s plan was based on successful busways in Brazil and had the added bonus that it could be completed within Pastrana’s mayoral term. On Acevedo’s advice, Pastrana punted on the metro plan and went forward with the Avenida Caracas busway (Ardila, 2004).
Acevedo had also identified a lack of institutional capacity as a primary obstacle to Bogotá having a successful transit system. In addition to the physical (roadway) changes needed to implement the busway, Acevedo recommended changes to the organizational structure of transit provision along the corridor, replacing the penny war system with a more rationalized system. He also proposed requirements that the buses operating in the new busway be equipped with doors on the left, so that passengers boarded and alighted in the median, rather than the side of the road. This second component meant existing bus owners would have to scrap and replace their vehicle fleets in order to participate in the new busway, which, without guaranteed
protection from competition (something the city was unable to provide given the legal rights to route ownership granted by the national government), they were reluctant to do. Given the short timeframe (the goal was to complete the busway within Pastrana’s two-year mayoral term), expedience was more important than reform, and the city moved forward with a simplified version of Acevedo’s original plan, limited to the southern portion of Avenida Caracas. The result involved widening the roadway and installing eight kilometers of dedicated bus lanes, to be served by existing large-capacity buses. Smaller buses were relocated onto parallel routes (Ardila, 2004).
Operations began on the Avenida Caracas busway in 1989. Though the institutional changes called for in the busway plan were nominal at best, the system was considered a success due to ridership levels in excess of 35,000 passengers per direction per hour – numbers
finish the northern half of the Avenida Caracas busway after Mayor Pastrana left office. Though this half would prove more complicated than the southern half – the northern half of the corridor went through the downtown and through wealthier (middle-class) neighborhoods than the southern half – it was eventually completed in 1992 under then-Mayor Jaime Castro (Ardila, 2004).
Significance of the Avenida Caracas busway
The Avenida Caracas busway was both a learning experience and a test case. It had definite drawbacks: the system relied on old, dirty buses with on-board fare payments and above-grade boardings. The penny war was still in effect, and initial improvements in speed and service eroded as drivers continued to compete for passengers. Despite its inadequacies and
shortcomings, the Av. Caracas busway demonstrated that, by segregating buses from regular traffic, transit volumes could be increased in a way that it was previously thought only rail could achieve. Thus, what the Av. Caracas busway lacked in service, it made up for in volume (Ardila and Rodríguez, 2000).
Metrobus
choice up to the bidders elevated awareness of the potential of bus-based solutions, shifting, at least temporarily, the bus vs. metro debate firmly in favor of buses.
In 1994, the concession was awarded to Metrobus, an international consortium that included trade associations representing some of the bus companies and bus owners in Bogotá. The Metrobus proposal included a two-phase busway system, and was chosen in large part because it would not require subsidies. Metrobus was set to begin work on its first corridor in 1996, but because of disagreements with the government over fare structures, the consortium was unable to secure financial backing for the project (Ardila, 2004; Montezuma, 2005). Furthermore, the bus companies and owners began to oppose the project, despite their representation in the consortium via trade associations, over concerns about loss of routes and having to replace their buses. Because of the institutional organization of the existing transit system, without buy-in of bus companies and owners, the venture was deemed too risky an investment. Ultimately, the consortium collapsed and the city cancelled the contract (Ardila, 2004).
IBS and the Transportation Master Plan
Though the Metrobus contract fell through, the idea of a metro for Bogotá was still strong at the national level. Locally, however, the metro had few supporters.4 Ernesto Samper had campaigned for the presidency on a platform that included finally making good on Bogotá’s metro, and when he came into office in 1994 he was a strong supporter of the metro project. In contrast, Mayor Antanas Mockus, who entered office shortly after Samper, was unconvinced of the project’s merits, and wanted evidence that the metro was the best possible solution to Bogotá’s mobility crisis, and not just a political tool. Because of the twenty percent law, Samper was unable to move forward on a metro without the city’s help, so he agreed to work with Mockus. In 1996, the two leaders hired IBS, a multi-firm international consortium, to conduct a
study of the feasibility of a metro system and to plan, estimate costs, and predict impacts of the city’s first metro line. IBS completed their investigation in 1997. The metro plan they presented, however, was based on outdated development projections and fit poorly into Bogotá’s current spatial structure. Mockus, now fully convinced that the solution to Bogotá’s mobility problems lay in busways, rejected IBS’s plan (Ardila, 2004).
Meanwhile, President Samper had directed staff at the National Planning Department (DNP) to begin work on a Transportation Master Plan for the city. The planning process took a year and a half, finishing in December 1996. The Master Plan, financed by the Japan International Cooperation Agency, proposed 67 elements spread over 24 years, with a total price tag of US $7 billion. Notably, the plan called for roadway widening and decking of primary arterials. In the short term, it also called for reorganizing the city’s bus routes into a trunk and feeder system, changing the fare structure so that fares increased with distance, building busways along the city’s main transportation corridors, and restructuring the management of the bus companies. The busways would be converted to rail over time as demand increased. Mayor Mockus was
dissatisfied with the plan – particularly the decked arterials elements – and decided against codifying the Master Plan into law. The busways element, however, he kept, though in effect it would be little more than an expansion of the Avenida Caracas busway, without organizational or structural changes (Ardila, 2004).
Peñalosa’s vision: TransMilenio
Enrique Peñalosa entered the mayor’s office in August 1997, having campaigned on a platform that included getting Bogotá a fair shake from the national government with respect to funding for a metro system. In his eyes though, the metro was not a solution to Bogotá’s mobility crisis; rather, it was an economic development tool. He would address the mobility crisis through a massive urban planning effort that included reclaiming public space, building a world-class network of bicycle and pedestrian paths, restricting the use of private vehicles, and overhauling the transit industry into a state-of-the-art bus rapid transit system. He envisioned not just an expansion of the Avenida Caracas busway (as Mockus had proposed), but rather a transformed BRT system that functioned much like a metro rail, with specialized large-capacity buses operating on dedicated, restricted-access busways covering all the city’s main arterials and the feeder network at the fringe.
The metro plan would eventually be tabled again due to a lack of funding, and the local and national governments would throw their weight behind the BRT, which would become known as TransMilenio. In June 1998, the city council enacted the plan for TransMilenio into law. Construction for the first phase would cost US $240 million (in 2000 dollars), with funding from a twenty percent gas tax that Peñalosa pushed through, transfers from the national
governments, and partial privatization of the city-owned power company. The system would begin limited operations on December 18, 2000 – twelve days before Peñalosa’s mayoral term ended (Ardila, 2004).
ridership of 35,000 passengers per direction surpassed that of most of the world’s metro systems at the time, with a per-kilometer infrastructure cost of less than ten percent of the average metro. Further, farebox revenues covered operations and capital costs, a rarity among transit systems worldwide (Ardila, 2004).
Changes needed to ensure TransMilenio’s success
After having witnessed the failures of the previous twenty years of attempts to solve Bogotá’s mobility crisis, Peñalosa understood that several critical things needed to happen in order for TransMilenio to succeed. These included structural changes to the way transit was operated and regulated in Bogotá and getting the existing transit industry to buy in to the new system.
Changing the operating structure and regulatory mechanisms governing public transit required the creation of a new public agency, TransMilenio S.A. This agency was charged with planning and implementing the BRT plan and regulating service delivery. After several months of debate, the city council passed a law creating TransMilenio S.A. in February, 1999 (Ardila, 2004). Through TransMilenio SA, Peñalosa would also create a concession system, in which potential transit providers would bid for contracts to operate within the BRT system.
Concessionaires would be required to purchase new, specialized buses and to meet strict service, performance, and maintenance standards (Hidalgo, 2004).
Peñalosa also saw that the compensation structure of the conventional transit system had to be reformed. In the conventional transit system, bus owners and drivers made money according to the number of passengers carried, while bus companies made money based on the number of buses plying their routes. As previously discussed, this arrangement led to an oversupply of vehicles and chaotic traffic conditions as drivers competed amongst each other for passengers. In the TransMilenio system, vehicles would be owned by the concessionaires, who would be
employed by the concessionaires and paid a salary, rather than a commission, with their wages and working conditions regulated by TransMilenio S.A. (Ardila, 2004; Echeverry et al., 2005).
Together, these structural changes were meant to end the “penny war” by rationalizing the supply of transit vehicles. Rather than competing for individual passengers (competing in the market), potential TransMilenio concessionaires would be competing for the ability to operate within the system (competing for the market) (Ardila, 2007).
Mayor Peñalosa also understood that, without the support of the existing transit providers in Bogotá, TransMilenio would be politically infeasible. The transit industry was a major
employer and had strong legal protections provided by the national government. Further, until TransMilenio was fully built-out, the conventional transit industry would still be the primary transit provider operating in many parts of the city. Without the industry’s support, neither the city nor the national governments was likely to support the project either. Peñalosa had also witnessed an example of a similarly sweeping transit overhaul in Quito, Ecuador, several years earlier, in which military tanks had to be deployed to fend off a blockade of that city’s new electric bus system by existing transit operators, who had been excluded from participation in the new system (Ardila, 2004).
Making these changes happen simultaneously, and in a short window of time, was no small feat. It likely would not have been possible without strong planning, political power, and (to a fairly great extent) fortuitous timing.5 To begin with, Mayor Peñalosa assembled a strong planning team in TransMilenio S.A.. With the assistance of experienced consulting firms, the planning team made significant strides toward incorporating the key players in the transit industry as stakeholders in TransMilenio. Initially, the conventional transit industry was opposed to the TransMilenio project. Participation in TransMilenio meant transit companies would have to shoulder substantial financial risk: rather than affiliating buses with their routes like in the
conventional system, transit companies would have to purchase their own buses, brand new and custom-made for the TransMilenio system, and they would have to make this investment in a very short time frame. They feared a loss of stake in the new system, as they would be out-competed by international firms that could better afford the up-front costs of participation. Because the plans called for the TransMilenio network to eventually cover the entire city, the conventional transit companies saw it as a move to push them out of the transit market altogether (Ardila, 2004).
The planning team Peñalosa assembled took a multi-pronged approach, employing a range of planning theories and techniques to bring the members of the conventional transit industry in as stakeholders in the TransMilenio planning process. In so doing, the planning team was not only able to better understand and address the transit industry’s fears, but also to reduce the power they wielded over political and planning processes in the city. Further, the city council (which had long been thought to be in the transit industry’s pocket), introduced important stipulations in the law that created TransMilenio, S.A.. The first stipulation eliminated the possibility that the agency could participate as an operator in the TransMilenio system. The second stated that prior experience as a transit operator in Bogotá must be taken into account in the process of evaluating bids. This stipulation effectively guaranteed that international investors could not participate in the TransMilenio system unless they partnered with existing transit companies. Four groups submitted bids; 58 of the original 63 transit companies were included as shareholders in those four groups. All four won contracts, signed in spring 2000, to operate in TransMilenio’s first phase (Ardila, 2004).
Through interviews with members of Peñalosa’s planning team and other advisers, Ardila writes that the general impression was that Peñalosa had a very inflexible notion of what needed to be done, and contrary opinions were considered a waste of precious time and were rarely tolerated (Ardila, 2004, pp 331, 357). Ironically, Peñalosa’s goal for TransMilenio – and indeed, the bulk of his political agenda – was to improve the quality of life and sense of belonging for all Bogotanos, but he believed that in order to accomplish his goals, they needed to be pushed through with a powerful, authoritarian hand.6
TransMilenio also benefitted from good timing: the beginning of the planning process coincided with one of the worst economic periods in Colombia’s history. Fuel prices rose
substantially (through deregulation and an increase in local fuel taxes), and new car sales dropped sixty percent from 1998 to 1999 (Ardila and Menckhoff, 2002). Concurrently, the introduction of pico y placa (the driving restriction scheme that kept forty percent of the city’s cars off the street during peak travel hours) and the Peñalosa administration’s massive effort to reclaim sidewalk space from parked cars forced a decline in the utility of car ownership (Ardila and Menckhoff, 2002; Peñalosa, 2011). At the same time, the city introduced an annual car-free day, expanded the weekly ciclovía program, and invested in a 350-kilometer bikeway network. The combined pressures on vehicle use and expansion of alternative travel modes resulted in heavy patronage of the new BRT system. Eleven percent of TransMilenio’s passengers had switched from private motorized modes, and the system boasted a 98 percent approval rating among users (Cervero, 2005). The system’s popularity and high ridership levels ensured continued political and financial support for the project, even after the end of Peñalosa’s mayoral term (Turner et al., 2012).
Finally, Peñalosa had to secure financial support from both the national and municipal governments. TransMilenio was the first proposal over the previous two decades that was
supported by both the national and municipal governments. It was also the first busways proposal not overshadowed by efforts to get a metro. However, at the beginning of Peñalosa’s term, this was not the case. When Peñalosa entered office, the national government (of President Samper) and, to a lesser extent, Peñalosa himself, were still pushing for a metro, even while planning efforts for TransMilenio were underway. However, cost projections for the metro kept rising, and the national government was becoming increasingly constrained fiscally. By the time Samper’s term expired in 1998, the national government was on the edge of fiscal crisis. Andrés Pastrana succeeded Samper as president, and his advisers began recommending the national government withdraw support for the metro and shift their available funding to the BRT, already underway. Ultimately, the projected cost of the metro resulted in its downfall, and in TransMilenio’s rise. The estimated cost for the first metro line (infrastructure, capital costs, and financing) was estimated at US $6.5 billion (1999 dollars) – roughly twenty times more per kilometer than the first phase of the BRT (Ardila, 2004).
Importance of route placement
TransMilenio’s initial success was also due in part to location. As shown in Figure 4, the main trunk line of Phase I was aligned along the Avenida Caracas, linking the high density, lower-wealth neighborhoods in the city’s south and the more affluent neighborhoods to the north with destinations located in the heart of the city’s primary commercial corridor.
First, maximizing potential ridership was critical to gaining the support of transit operators, who would be making significant capital investments in the system, and were therefore invested in the system’s overall success.
Figure 4. Net residential density & commercial activity, 2000
Finally, Peñalosa recognized the difficulty of placing the busway along such a heavily traveled – and heavily built-up – corridor, and believed that if he did not tackle Avenida Caracas, neither would his predecessors. Indeed, he felt that the only way to ensure the plan would get off the ground at all was to start with the most logistically challenging one (Ardila, 2004).
TransMilenio today
In sum, the system got off the ground in large part because it had strong champions that were able to convince a wide range of stakeholders of the project’s merit and urgency. Since its bright beginnings, however, the system has experienced growing pains, and has seen some of its former champions begin to lose faith. In the years since the grand opening of Phase I,
TransMilenio has faced massive overcrowding and deteriorating infrastructure, leading to delays and declining service levels. Walkouts and boycotts over poor service and rising fares have been fairly routine since 2004.
TransMilenio’s original plan called for an additional 306 kilometers of trunk lines (Cain et al., 2006), but further expansions beyond phase II were delayed repeatedly due to funding shortfalls, resistance from conventional operators (still serving the majority of Bogotá’s transit demand), and political wrangling over whether the city should instead be investing in heavy rail (Ardila, 2007; Hutchinson, 2011). June 30th, 2012, marked the opening of the first new BRT line since the completion of Phase II (in 2005), with limited service linking Bogotá’s international airport to the city center. Future expansion plans beyond Phase III (currently underway) remain uncertain.
of Bogotá. While the technology underlying BRT may be viable solution or partial solution to a broad range of mobility challenges, BRT’s success probably depends as much on the
appropriateness of the process as on the technology itself.
Integral to the process of TransMilenio was the identification and participation of stakeholders – in particular, the key players in the existing conventional transit industry. The previous twenty years of transport reform attempts showed how, without the vital participation of these stakeholders from the beginning of the planning process, reform efforts would ultimately crumble. By studying the failed efforts of his predecessors, Peñalosa and his planning team understood not only the importance of including the existing transit operators, but also how to get them to buy in to TransMilenio.
Peñalosa’s planning team also realized the necessity of getting the support of
neighborhood and community groups. Compared to the transit industry, which was brought into the planning process at ground level, the public’s participation in the planning process came late, and was seemed designed more to garner political support than to seek meaningful input.
Peñalosa would have preferred a more egalitarian planning process, but argued that the narrow window of opportunity necessitated a heavy-handed approach. He also doubted that, if he did not get TransMilenio running before the end of his term in office, his successors would be able to finish the task (Ardila, 2004, pp. 287-290).
While Peñalosa did succeed in getting TransMilenio running, are there longer-term consequences to the rapid, heavy-handed approach? Today, TransMilenio’s record ridership figures are overshadowed by abysmal approval ratings and violent and costly protests over service inadequacies. This paradox underlies one of the central questions driving this research: What is the difference between the success of a transport system, measured in terms of its
CHAPTER 3. ISSUES IN MEASURING THE BUILT ENVIRONMENT FOR
TRAVEL BEHAVIOR RESEARCH
The built environment – or more broadly, urban spatial structure – and travel behavior are tightly interwoven. In the traditional mono centric city, households choose a residential location that maximizes utility by trading off costs of travel to employment opportunities with the amount of housing they can afford. Thus, the city is shaped by individual trade-offs between low
transportation costs and high housing costs close to the center, and the low housing costs and high transportation costs at the urban fringe (Alonso, 1964). As transportation infrastructure
investments, such as highways or transit systems, improve access to peripheral areas, more households are expected to settle farther from the center (Mohring, 1961).
However, as urban growth patterns become increasingly decentralized, the usefulness of the monocentric model for understanding the land-use and transportation interactions has diminished, leading to a long and sometimes heated academic and political debate over the nature, strength, and even the existence of the connection between billed form and travel
behavior. Numerous lengthy reviews of this debate present a mixed picture of several decades of empirical research. Representative works include those by Badoe and Miller (2000), Crane (2000), Frank (2000), Handy (2005), and Ewing & Cervero (2010). The general conclusion is that while the existence of a relationship between travel behavior and the built environment is still intact, issues of the nature and strength of that relationship are far from resolved.
the travel behavior/environment discussion. This chapter also provides background information to explain and support the variables and methodological approaches used in this dissertation.
Research objectives
As described by Krizek (2003a) and Clifton, et al (2008), investigations into the relationship between travel behavior and the built environment are conducted for a wide variety of reasons. Research objectives guide the selection of outcome and explanatory variables; they also influence the way the built environment is measured and operationalized (Frank and Engelke, 2005). Studies have aimed at informing policy focus on stemming congestion, informing air quality, and increasing opportunities for active transport, just to name a few. For each of these areas of interest, a variety of dimensions of travel is relevant. For example, in addressing congestion issues, one might focus on vehicle miles traveled or commute mode choice. For improving air quality, we might be interested in relationships between urban form and automobile trip generation and cold starts (Frank et al., 2006). If our interest is increasing
physical activity, we may focus on factors that lead to increased odds of using nonmotorized modes for given types of trips. If our aim is to understand how to improve access to opportunities for nonmotorized households, we might focus on the relationship between nonmotorized trip frequency in the conditions of the walking and bicycling environments (Saelens et al., 2003).
In this study, I examine how characteristics of the built environment – including access to BRT – affect motorization pressures. In Chapter 4, the outcome of interest is vehicle ownership, a close, but not perfect, approximation of motorization pressures. Vehicle ownership is a simple, readily-available measure with relatively straightforward policy implications. However, it is not perfect in that vehicle ownership is expected to lag behind actual motorization pressures; the length of the lag is subject to the household’s financial resources and the psychosocial motorization pressures it experiences.
In Chapter 5, I address the lag issue by examining mobility patterns of households without vehicles. Specifically, I assess the extent to which the built environment enables
nonmotorized households to conduct their daily travel without using a car. This is a new approach to measuring travel behavior, and the literature offers little evidence to guide the selection of outcome variables. Thus, one of the challenges of this research is to develop readily available measures of travel that are clear and consistent indicators of mobility. Based on theoretical frameworks discussed in Chapter 5, I examine three potential indicators: the number of round trips – starting and ending in the same location – completed by household members on a given day (tour frequency), the diversity of travel purposes fulfilled without the use of private motorized modes (e.g., car, motorcycle, or taxi) by household members on a given day (travel purpose diversity), and whether or not household members are able to complete all their travel on a given day without having to resort to private motorized modes (vehicle independence).
Unit of analysis
The unit of analysis employed in travel behavior research has implications for the
At the regional level, a number of cross-sectional studies have found that the greater a city or region’s overall density, the higher the transit ridership and lower the automobile ownership, especially among developing country cities (e.g., Newman and Kenworthy, 1991, 1996; Kenworthy and Laube, 1999; Cameron et al., 2003; Lyons et al., 2003; Sinha, 2003). Although such studies are useful for understanding and predicting global and regional trends, they often reflect historical development patterns rather than conscious policy decisions about how to grow and move around in cities. Furthermore, by relying on metropolitan-wide generalizations, regional studies mask neighborhood-level variation within cities, and unlike neighborhood- and household- or individual-scale studies, offer little insight into how urban policies that have localized, spatially dependent impacts (e.g., changes in transit service) might affect personal or household mobility and motorization patterns.
Neighborhood-level studies allow for more nuanced examinations of smaller-scale environmental measures. Studies that use the transit station area as the unit of analysis are quite common, particularly in developing settings where household-level data are often difficult to obtain, and offer much greater policy relevance than city or regional scale analyses. For example, Estupiñán and Rodríguez (2008) found that BRT boardings in Bogotá were significantly higher in station areas with more support for walking, more barriers to car use, and greater supply of transit. Similarly, Ryan and Frank (2009) found a modest but significant positive relationship between walkability and light rail boardings in San Diego neighborhoods.
the current research is to improve understanding of how policy interventions, such as BRT investment, influence travel and vehicle ownership decisions; thus, the unit of analysis must be the travel and vehicle ownership decision maker.
That decision-maker is often assumed to be the individual traveler, particularly in studies focusing on mode choice for specific trip purposes and on frequency and duration of transport physical activity. For example, Winters, et al. (2010) studied the odds that individual travelers chose to cycle (rather than drive) for work trips in Montreal; in Boston, Zhang (2004) examined travelers’ odds of walking or using transit for specific work and non-work trips, and Rodríguez and Joo (2004) evaluated the likelihood commuters in North Carolina choose nonmotorized modes for the journey to work. A number of studies (e.g., Frank et al., 2007; Cervero et al., 2009) aimed at understanding how to increase physical activity have examined the relationships
between the built environment and time spent engaged in nonmotorized travel by individuals as well. A common theme of these studies is that they examine characteristics – i.e., mode and duration – of a trip that was likely to have been made anyway.
As explained above, the outcomes of interest in this research are vehicle ownership and non-car mobility – the degree to which households fulfill their daily travel needs without the use of a vehicle. Thus, I am interested not just in how a trip was made, but whether it was made at all. Implicit in these outcomes is that the household is the travel and vehicle ownership decision-making unit. The rationale for this choice is well defended in the literature, and can be summarized as follows: the demand for travel is largely believed to be a derived demand, meaning that travel is a reflection of fulfillment of a traveler’s need to participate in out-of-home activities.7 While this activity participation can serve both individual and household needs, activities performed on behalf of the household (e.g., earning money, shopping for groceries) tend to take precedent over more individual-oriented activities (e.g., socializing or shopping for
discretionary purchases). Thus, when household members make decisions about travel, they are usually making those decisions on behalf of household travel needs (Adler and Ben-Akiva, 1979; Limanond et al., 2005; Buliung and Kanaroglou, 2007).
Furthermore, individual travel decisions are subject to household-level constraints, especially in limited-mobility settings, such as the need to share limited travel resources (vehicles, transit fare, etc), to escort children, or to stay home and care for family members or household property (Dissanayake and Morikawa, 2002). The opportunity cost of one household member’s decision to travel may be the inability of another household member to make a trip (Yagi and Mohammadian, 2008).
Finally, when households (or individual household members) make decisions about vehicle ownership, those decisions are based primarily on the household’s financial resources and travel needs (Cao et al., 2007a). Especially when the vehicle in question is the household’s first vehicle purchase, its primary (if not sole) purpose is the fulfillment of household travel needs (Dissanayake and Morikawa, 2002).
Measurement of the built environment
Like travel behavior, the built environment is multi-faceted, and researchers have taken a range of approaches to measuring it. There are three key components to quantifying the built environment: what dimensions to measure, how to measure them, and at what scale.
What to measure
There are virtually unlimited numbers of built environment attributes that may, in certain contexts, be relevant to different dimensions of travel behavior. In a meta-analysis of research on the travel behavior/built environment relationship from 1996 to 2009, Ewing & Cervero (2010) categorized the most commonly measured attributes along five (sometimes overlapping)