Taxol-resistant epithelial ovarian tumors are
associated with altered expression of specific
beta-tubulin isotypes.
M Kavallaris, … , M Haber, S B Horwitz
J Clin Invest.
1997;
100(5)
:1282-1293.
https://doi.org/10.1172/JCI119642
.
The treatment of advanced ovarian cancer with taxol is hindered by the development of drug
resistance. The cellular target for taxol is the microtubule that is stabilized by the drug. Taxol
preferentially binds to the beta subunit of tubulin of which there are six distinct isotypes in
mammalian cells. We have used highly specific oligonucleotides and polymerase chain
reaction to analyze expression of all six beta-tubulin genes. Human lung cancer cells
(A549) were selected in 12 and 24 nM taxol resulting in cell lines that were 9- and 17-fold
resistant, respectively. These cells displayed an altered ratio of classes I, II, III, and IVa
beta-tubulin isotypes. Ovarian tumors, seven untreated primary and four taxol- resistant
tumor-bearing ascites, displayed significant increases (P < 0.005) in classes I (3.6-fold), III
(4.4-fold), and IVa (7.6-fold) isotypes in the taxol-resistant samples as compared with untreated
primary ovarian tumors. The increased expression appears to be related to the resistance
phenotype, as the basal levels of the class III and IVa isotypes in the untreated tumors were
extremely low. This is the first report of altered expression of specific beta-tubulin genes in
taxol-resistant ovarian tumors and we propose that the latter may play a role in clinical
resistance to taxol.
Research Article
Find the latest version:
J. Clin. Invest.
© The American Society for Clinical Investigation, Inc. 0021-9738/97/09/1282/12 $2.00
Volume 100, Number 5, September 1997, 1282–1293 http://www.jci.org
Taxol-resistant Epithelial Ovarian Tumors Are Associated with Altered Expression
of Specific
b
-Tubulin Isotypes
Maria Kavallaris,* Dennis Y.-S. Kuo,‡ Catherine A. Burkhart,* Donna Lee Regl,* Murray D. Norris,§ Michelle Haber,§ and Susan Band Horwitz*
*Department of Molecular Pharmacology and ‡Department of Obstetrics and Gynecology, Division of Gynecological Oncology, Albert
Einstein College of Medicine and Montefiore Medical Center, Bronx, New York 10461; and §Children’s Cancer Research Institute, Sydney
Children’s Hospital, Randwick, New South Wales, 2031, Australia
Abstract
The treatment of advanced ovarian cancer with taxol is hin-dered by the development of drug resistance. The cellular target for taxol is the microtubule that is stabilized by the
drug. Taxol preferentially binds to the b subunit of tubulin
of which there are six distinct isotypes in mammalian cells. We have used highly specific oligonucleotides and
poly-merase chain reaction to analyze expression of all six b
-tubu-lin genes. Human lung cancer cells (A549) were selected in 12 and 24 nM taxol resulting in cell lines that were 9- and 17-fold resistant, respectively. These cells displayed an
al-tered ratio of classes I, II, III, and IVa b-tubulin isotypes.
Ovarian tumors, seven untreated primary and four taxol-resistant tumor-bearing ascites, displayed significant
in-creases (P , 0.005) in classes I (3.6-fold), III (4.4-fold), and
IVa (7.6-fold) isotypes in the taxol-resistant samples as compared with untreated primary ovarian tumors. The in-creased expression appears to be related to the resistance phenotype, as the basal levels of the class III and IVa iso-types in the untreated tumors were extremely low. This is
the first report of altered expression of specific b-tubulin
genes in taxol-resistant ovarian tumors and we propose that
the latter may play a role in clinical resistance to taxol. (J.
Clin. Invest. 1997. 100:1282–1293.) Key words: drug
resis-tance • carcinoma • microtubules • lung • polymerase chain
reaction
Introduction
Ovarian cancer is the leading cause of death from gynecologi-cal malignancies in the United States (1). The majority of pa-tients present with advanced stage disease, and after cytore-ductive surgery, chemotherapy remains the most effective treatment. Despite significant initial response rates for ad-vanced ovarian carcinoma using platinum-based combination chemotherapy, many patients relapse and , 15% will be long-term survivors (2). Overall, chemotherapy is relatively
ineffec-tive due to the emergence of a broad cross-resistance pattern that is either intrinsic to the tumor or acquired after chemo-therapy (3). An important clinical advance has been the en-couraging use of taxol in combination with cisplatin in first-line therapy in advanced stage ovarian carcinoma (4). Taxol has also proven effective in the treatment of other drug refractory human cancers such as breast (5) and non–small cell lung can-cer (6).
Despite the success of taxol as an antitumor agent, clinical drug resistance poses a major impediment to the successful use of this agent in the treatment of cancer. Due to the hydropho-bic nature of taxol, resistance to this drug has been associated with the induction of the multidrug resistance (MDR)1
pheno-type and overproduction of P-glycoprotein (7). Taxol was first isolated from the bark of the western yew, Taxus brevifolia, and was shown to be cytotoxic to a wide range of murine neo-plasms (8). It is an antimitotic agent that binds to microtu-bules, thereby stabilizing them against depolymerization and inhibiting cell replication by disrupting normal mitotic spindle formation (9). Tubulin is a heterodimer that consists of a- and
b-tubulin subunits that constitute the microtubule. The genes that encode tubulin have been highly conserved throughout evolution, and even within species multiple a- and b-tubulin genes encode distinct tubulin gene products. Direct photoaf-finity labeling has demonstrated that taxol binds preferentially to the b subunit of the microtubule (10). To date, mutations or changes in the expression of b-tubulin in human tumor cells have been poorly defined. One of the difficulties encountered in the study of tubulin in human taxol-resistant cells is the presence of multiple tubulin isotypes that are encoded by a large multigene family consisting of both functional and non-functional genes (11, 12). The greatest diversity between the
b-tubulin isotypes occurs in the carboxy-terminal variable re-gion sequence and to a lesser extent in the amino-terminal variable domain. Sullivan and Cleveland (13) used the carboxy-terminal region of individual isotypes to devise a classification system to distinguish the isotypes in vertebrates, since this re-gion is conserved across species. In humans, six b-tubulin iso-types have been identified which display a distinct pattern of tissue expression. Their classification is as follows (Roman merals represent the tubulin protein class, while Arabic nu-merals represent the gene): class I, HM40; class II, Hb9; class III, Hb4; class IVa, H5b; class IVb, Hb2; class VI, Hb1 (13, 14). In mammalian cells expression is as follows: class I and IVb isotypes are constitutively expressed; class III and IVa are restricted to brain; class II is found predominantly in brain and at low levels in a broad range of tissues; and class VI is
re-Address correspondence to Susan Band Horwitz, Department of Mo-lecular Pharmacology, Albert Einstein College of Medicine, 1300 Mor-ris Park Ave., Bronx, NY 10461. Phone: 2163; FAX: 718-430-8922; E-mail: [email protected]
Received for publication 28 January 1997 and accepted in revised form 16 June 1997.
stricted to hematopoietic tissues. Although the tissue distribu-tion of each isotype has been well characterized for chicken and mouse, limited data are available on b-tubulin isotype gene expression in normal human tissues (15–17).
Whether differential expression of specific isotype classes can alter the functional characteristics of microtubules and the response of a cell to taxol is not clear. In vitro studies have demonstrated that the b-tubulin subunit composition can alter the growing and shortening dynamics of microtubules (18), and that low levels of taxol can alter microtubule dynamics (19, 20). Furthermore, b-tubulin class III–depleted microtu-bules display increased sensitivity to taxol-induced polymer-ization in vitro, compared with unfractionated tubulin (21). We have previously described a taxol-resistant murine J774.2 cell line with increased expression of the class II b-tubulin iso-type, Mb2 (22). To examine the effect of taxol on human ma-lignant cell populations, we have selected non-small cell lung cancer cells for low level resistance to taxol and developed spe-cific oligonucleotides for gene expression analysis of the six human b-tubulin isotypes. Altered gene expression of specific
b-tubulin isotypes was associated with increasing resistance to taxol. To examine tubulin changes associated with clinical re-sistance to taxol, untreated primary and taxol-resistant ovarian epithelial tumors were examined for alterations in b-tubulin isotype composition. Significant increases in b-tubulin gene expression were observed for HM40, Hb4, and H5b isotypes in taxol-resistant tumors, compared with untreated primary tu-mors. This is the first report of altered expression of specific
b-tubulin genes in taxol-resistant ovarian tumors and indicates that clinical resistance to taxol may be associated with en-hanced expression of specific b-tubulin isotypes.
Methods
Patient samples.Tissue samples were obtained from patients with primary ovarian carcinoma undergoing surgical staging, and pre- and postmenopausal patients with benign pathologic conditions undergo-ing hysterectomy at the Weiler Division of the Albert Einstein Col-lege of Medicine and Montefiore Medical Center. All material for this project was obtained with the approval of the internal review board at the Montefiore Medical Center. Samples were snap-frozen in liquid nitrogen and stored at 2708C. Taxol-resistant tumor cells were obtained by pelleting the cells from tumor-bearing ascites fluid. Briefly, removal of contaminating red blood cells was achieved by di-luting the pellet (1:4) in sterile red blood cell lysing solution (160 mM ammonium chloride, 12 mM sodium bicarbonate, 0.1 mM EDTA, pH 7.3) and incubating at room temperature for 3 min. Tumor cells were then pelleted and the lysis step was repeated. Pelleted tumor cells were then resuspended in RPMI 1640 and cell counts were performed before the isolation of total RNA. Isolated tumor cells were exam-ined under phase-contrast microscopy and viable cells were counted using trypan blue exclusion dye. In addition, all ascites fluid samples were independently examined by a pathologist and found to be repre-sentative of tumor cells obtained from the primary tumor. Ovarian tumors were defined as taxol-resistant if they progressed during or re-curred within 6 mo of receiving taxol treatment.
Selection of taxol-resistant cell lines. Human lung carcinoma cells, A549, together with their taxol-resistant derivatives, were maintained in RPMI 1640 containing 1% penicillin-streptomycin (Gibco Labora-tories, Grand Island, NY) and 10% FBS. Human non-small cell lung cancer cells (A549) were selected for resistance to taxol in a stepwise manner essentially as described (23, 24). A549 cells were initially ex-posed to 1.5 nM of taxol (Drug Development Branch, National Can-cer Institute, Bethesda, MD) and once normal growth was achieved,
cells were maintained at this concentration before the drug dose was increased in multiples of two. A549-T12 and A549-T24 were main-tained at a final concentration of 12 and 24 nM taxol, respectively.
Growth inhibition assays. Exponentially growing cells were re-suspended in either drug-free medium (A549) or in the presence of 12 nM (A549-T12) or 24 nM (A549-T24) taxol. The resistant cells re-quire taxol to maintain normal cell proliferation. Cells were seeded at a density of 104 cells/ml (A549) or 3 3 104 cells/ml (A549-T12 and
A549-T24) in triplicate 6-well plates and allowed to attach for 24 h, before the addition of the indicated drug concentrations. After a 72-h incubation, cells were trypsinized and counted (counter model ZF0031; Coulter Electronics Inc., Hialeah, FL).
Protein analysis of tubulin. Cells were lysed in ice-cold RIPA buffer (150 mM NaCl, 1% NP-40, 0.5% sodium deoxycholate, 0.1% SDS, 50 mM Tris, pH 7.5) containing a cocktail of protease inhibitors (at a final concentration of 1 mg/ml leupeptin, antipain, chymostatin, and pepstatin A) for 30 min at 48C. After lysis, samples were centri-fuged at 48C for 10 min at 10,000 g. The supernatant was collected and the protein content of the cell lysate was quantitated using the Bio-Rad protein assay reagent (Bio-Rad, Hercules, CA). Total cellu-lar proteins (10 mg) were resolved using 12% SDS-PAGE and trans-ferred to nitrocellulose membranes by standard methods (25). Nitro-cellulose blots were probed with mAb to either a-tubulin (1:1,000, T-9026; Sigma Chemical Co., St. Louis, MO) or b-tubulin (1:1,000, T-4026; Sigma Chemical Co.) before exposure of the membrane to anti–mouse horseradish peroxidase–linked IgG antibody (Transduc-tion Laboratories, Lexington, KY) and developed using the ECL chemiluminescence procedure (Amersham, Arlington Heights, IL). Blots were then exposed to Hyperfilm-ECL film (Amersham). The relative amount of each protein was determined by densitometry. Equal loadings and efficient transfer of proteins were confirmed by staining the membrane with ponceau S red before immunodetection.
Partial DNA sequencing of hematopoietic-specific b-tubulin iso-type, Hb1. Since no nucleotide sequence for the human class VI iso-type was available, a DNA clone (pHindIII subclone in pUC8) of the gene corresponding to the class VI isotype, Hb1, was kindly provided by Dr. N. Cowan and Dr. S. Lewis. Sequencing of plasmid DNA was per-formed using the fmol DNA sequencing System (Promega, Madison, WI). Sequence analysis of the DNA clone was obtained with a degen-erate consensus antisense primer (59 -GTGCACGATYTCNCKCAT-39) designed using a conserved region of the b-tubulin gene family.
Reverse transcription-PCR (RT-PCR) analysis of b-tubulin iso-types.Total RNA was isolated from normal ovary and ovarian tumor samples as described by Chomczynski and Sacchi (26) with minor modifications (27). For cell lines and tumor-bearing ascites samples, total RNA was isolated using TRI Reagent™ (28) (Molecular Re-search Center, Inc., Cincinnati, OH). Contaminating genomic DNA was removed from total RNA by treating samples extensively with RNase-free DNase (Boehringer Mannheim, Indianapolis, IN).
available from GenBank. Primer sequences used for Hb9 expression have been described previously (31). Sequence data for Hb1 were ob-tained as described in the preceding section. Both target (b-tubulin) and control (b2-microglobulin) gene sequences were coamplified in
the same tube unless otherwise stated. Full-length DNA and cDNA clones of all six human b-tubulin isotypes were used to confirm the specificity of the primer pairs. DNA clones for HM40, Hb9, H5b, Hb2, and Hb1 were generously provided by Dr. N. Cowan and Dr. S. Lewis, and the Hb4 cDNA clone was kindly provided by Dr. D. Cleveland. To confirm the specificity of each primer set, the PCR product for each of the b-tubulin isotypes amplified from a given b-tubulin–harboring plasmid was subjected to direct cycle sequencing (fmol DNA Sequencing System; Promega) with the oligonucleotide primers used for amplification. For the determination of MDR1 ex-pression, a competitive PCR reaction with b2-microglobulin was
per-formed as described previously (29). The expected product size for the MDR1 primers, based on published sequence data, is 167 bp. PCR products (10 ml) were resolved using 10% PAGE and then stained with ethidium bromide, before visualization and Polaroid photography on an ultraviolet transilluminator. Photographic nega-tives were subjected to densitometry and a ratio for the target gene and the b2-microglobulin PCR product, for each cDNA sample, was
obtained by dividing the densitometric volume of the target gene electrophoretic band by that of the b2-microglobulin band (30, 32).
Between three and six independent PCR reactions were performed for each sample and analyzed in this way.
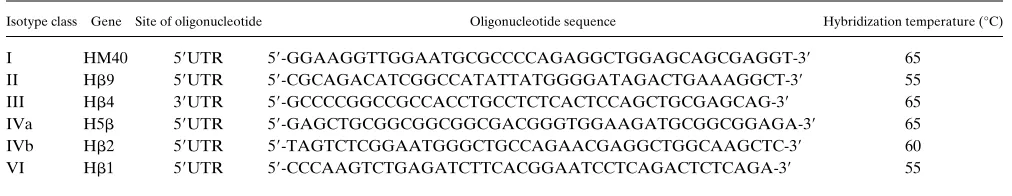
Southern analyses of plasmids. Plasmid DNA (250 ng), each har-boring the human b-tubulin gene encoding an individual isotype, (HM40, Hb9, Hb4, H5b, Hb2, or Hb1), was electrophoretically sepa-rated in a 0.8% agarose gel using 13 TBE (90 mM Tris-HCl; 90 mM boric acid; 2 mM EDTA, pH 8.3) followed by alkaline Southern transfer onto nylon membrane as described previously (33). Isotype-specific oligonucleotide probes for HM40, Hb4, H5b, and Hb2 were designed based on sequences obtained from GenBank, or from se-quencing DNA clones of Hb9 and Hb1 (Table II). Blots were
hybrid-ized using ExpressHyb solution (Clonetech, Palo Alto, CA) at appro-priate temperatures (Table II) for 1 h with g-32P-end-labeled probes,
washed in 23 SSC/0.05% SDS for 40 min at room temperature fol-lowed by a wash in 0.13 SSC/0.1% SDS for 30 min at the hybridiza-tion temperature. The blots were visualized by exposure to Kodak X-Omat film.
Northern analysis. Total cellular RNA (30 mg) was subjected to electrophoresis on 1% agarose gels containing 13 20 mM morpholi-nopropanesulfonic acid/5 mM sodium acetate/1 mM EDTA buffer, pH 7.0, and 6% formaldehyde (34). After electrophoresis, gels were transferred onto nylon membrane using 103 SSC as the transfer solu-tion. Hybridization and autoradiography were as described for South-ern analysis.
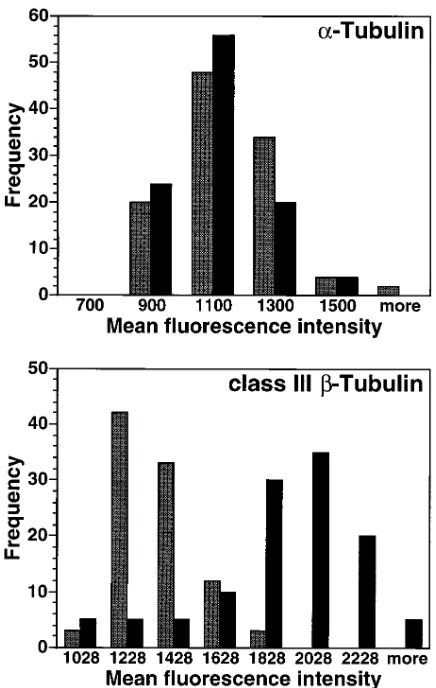
Immunofluorescence and digital scanning.A549 and A549-T24 cells were grown to subconfluency on glass coverslips. Cells were rinsed in PBS before extraction for 4 min with 0.5% Triton X-100 in microtu-bule stabilizing buffer PEM (100 mM Pipes, pH 6.8; 2 mM EGTA; 2 mM MgCl2). PEM-washed cells were then fixed in 3% formaldehyde
for 30 min at room temperature before rinsing in PEM buffer. Non-specific binding was blocked by incubating cells with 5% BSA in PBS for 1 h at 378C. After PBS washing, cells were incubated for 1 h at 378C with mAb to a-tubulin (Sigma 1:200 dilution; 1% BSA in PBS) or mAb to class III b-tubulin (Sigma 1:50 dilution; 1% BSA in PBS). PBS-rinsed cells were incubated with Cy3-conjugated anti–mouse IgG (1:1,000; Amersham) for 1 h before mounting in 30% glycerol/ PBS containing 1 mg/ml b-phenylenediamine (Sigma). Fluorescence was imaged with an Olympus IX70 inverted microscope. Images were digitized with a Photometrics PXL camera and analyzed using Iplab Spectrum software (Signal Analytics Corp., Vienna, VA). Individual cells were traced and the mean fluorescence intensity and area of at least 100 cells for each staining were measured. Immunofluorescence experiments were performed three times and similar results were ob-tained each time.
[image:4.612.56.554.77.213.2]Statistical analysis. Differences between samples or groups of samples in terms of their PCR ratios for a given b-tubulin isotype
Table I. b-Tubulin Oligonucleotide Primers Used for PCR Amplification
Isotype class Gene Site of forward primer
Nucleotide sequence
Product size
Forward Reverse
bp
I HM40 59UTR 59ACCTCGCTGCTCCAGCCTCT39 59CCGGCCTGGATGTGCACGAT39 154
II Hb9 Coding region 59CGCATCTCCGAGCAGTTCAC39 59TCGCCCTCCTCCTCCTCGA39 208
III Hb4 39UTR 59CTGCTCGCAGCTGGAGTGAG39 59CATAAATACTGCAGGAGGGC39 141
IVa H5b 59UTR 59TCTCCGCCGCATCTTCCACC39 59CCGGCCTGGATGTGCACGAT39 114
IVb Hb2 59UTR 59GAGCTTGCCAGCCTCGTTCT39 59CCGATCTGGTTGCCGCACTG39 215
VI Hb1 59UTR 59ACAGTGTGTTGGCTCACACC39 59CCGATCTGGTTGCCGCACTG39 142
b2M Coding region 59ACCCCCACTGAAAAAGATGA39 59ATCTTCAAACCTCCATGATG39 120
Table II. Isotype-specific Oligonucleotide Probes Used for Southern and Northern Hybridization
Isotype class Gene Site of oligonucleotide Oligonucleotide sequence Hybridization temperature (°C)
I HM40 59UTR 59-GGAAGGTTGGAATGCGCCCCAGAGGCTGGAGCAGCGAGGT-39 65
II Hb9 59UTR 59-CGCAGACATCGGCCATATTATGGGGATAGACTGAAAGGCT-39 55
III Hb4 39UTR 59-GCCCCGGCCGCCACCTGCCTCTCACTCCAGCTGCGAGCAG-39 65
IVa H5b 59UTR 59-GAGCTGCGGCGGCGGCGACGGGTGGAAGATGCGGCGGAGA-39 65
IVb Hb2 59UTR 59-TAGTCTCGGAATGGGCTGCCAGAACGAGGCTGGCAAGCTC-39 60
[image:4.612.54.560.638.736.2]gene were determined by Student’s t tests using two-sided P values (Statview; Abacus Concepts, Inc., Berkeley, CA).
Results
Cross-resistance of cell lines. Drug sensitivity of the
taxol-resistant cell lines to a range of cytotoxic agents was deter-mined using 72-h cytotoxicity assays. A549 cells were highly sensitive to taxol, with an ID50 of 2 nM. The A549-T12 and
A549-T24 sublines, maintained continuously in the presence of 12 and 24nM of taxol, respectively, displayed their highest level of resistance to the selecting drug (Table III). The fold resistance was determined by dividing the ID50 of the resistant
cells by the ID50 of parental A549 cells. Taxol-selected cells,
A549-T12 and A549-T24, were 9- and 17-fold resistant to taxol, respectively. Significant cross-resistance was also ob-served to another taxane, taxotere, in both A549-T12 (4-fold) and A549-T24 (10-fold). The resistant cell lines demonstrated very little, if any, cross-resistance to adriamycin, bleomycin, or to the antimicrotubule agents vinblastine and colchicine.
Analysis of MDR1 gene expression by RT-PCR.To
deter-mine the role, if any, of P-glycoprotein in mediating resistance in A549-T12 and A549-T24 cells, RT-PCR was performed to determine MDR1 gene expression. Detectable expression of
MDR1 was not observed in either the parental A549 cells or in the taxol-resistant A549-T12 cells (Fig. 1). In contrast to the P-glycoprotein–positive cell line, SKVLB (kindly provided by Dr. V. Ling), which expresses high levels of MDR1 (27), low levels of MDR1 transcript were detected in A549-T24 cells. These data are consistent with a recent observation that there is no significant difference in [3H]taxol accumulation between
the parental (A549) and drug-resistant cell lines A549-T12 and A549-T24 (Yang, C.-P.H., and S.B. Horwitz, personal commu-nication).
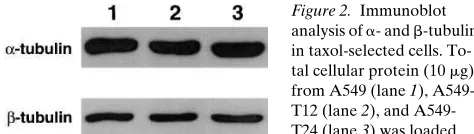
Analysis of a- and b-tubulin in taxol-resistant cell lines.
Protein levels of a- and b-tubulin in parental and taxol-resis-tant cells were determined by immunoblotting of total cell ly-sates (Fig. 2). No significant change in either a- or b-tubulin concentration was detected in the taxol-resistant cells com-pared with the parental cells. These data do not exclude the possibility that individual isotype classes are altered.
Partial sequence of class VI b-tubulin isotype gene. The dis-tribution of specific b-tubulin isotypes has been well character-ized in both chicken and mouse, however, this has not been the case for human tissues where expression data and tissue distri-bution of specific isotypes have been determined primarily us-ing human tumor cell lines (15–17). To date, it has been diffi-cult to characterize the gene expression of all six human
b-tubulin isotypes due to the lack of available nucleotide se-quence data. The mammalian class VI isotype, which shares the lowest amino acid homology (78%) to the other isotypes, is restricted in expression to hematopoietic tissues such as plate-lets, bone marrow, and spleen (17). To generate PCR oligonu-cleotide primers and gene-specific oligonuoligonu-cleotide probes to the human class VI gene, a Hb1 DNA clone was partially se-quenced (Fig. 3). A degenerate antisense oligonucleotide primer and cycle sequencing was used to obtain data in the 59UTR region of Hb1. Sequence was obtained for 106 nucle-otides of the 59UTR and 57 nucleotides coding for the 19 amino acids of exon 1. Confirmation that the sequence was that of Hb1 was obtained by identifying the unique amino acid substitution, isoleucine, at position nine (16, 17). In the other five isotypes, the ninth amino acid of exon 1 is alanine.
Analysis of b-tubulin isotype expression in taxol-resistant
cell lines. The coding regions of the b-tubulin genes have
highly conserved sequences making the design of isotype-spe-cific primers for RT-PCR within these regions difficult. Previ-ously, we described a strategy for designing oligonucleo-tide-specific primers in nonconserved UTR regions of mouse
b-tubulin genes (22). PCR screening of plasmids harboring
ei-Table III. Drug Sensitivity of A549 and Taxol-resistant Cell Lines
ID50 (nM)*
Cell line Taxol Taxotere Vinblastine Colchicine Adriamycin Bleomycin
A549 2 1.75 0.775 32.5 33.3 125
A549-T12‡ 18 (9)§ 7.38 (4.2) 1.15 (1.5) 33 (1) 56.5 (1.7) 98.5 (0.8)
A549-T24i 34.5 (17.3) 17.75 (10.1) 1.05 (1.4) 43 (1.3) 71 (2.1) 171 (1.4)
*ID50, drug concentration that inhibits cell division by 50% after 72 h. ‡Cells were maintained in 12 nM taxol during cross-resistance experiments.
iCells were maintained in 24 nM taxol during cross-resistance experiments. §Numbers in parentheses, ratio of ID
50 for resistant cell line to that for
[image:5.612.57.554.77.153.2]A549.
Figure 1. RT-PCR de-termination of MDR1 gene expression was performed on drug-sen-sitive A549 (lane 1), taxol-selected A549-T12 and A549-T24 (lanes 2 and 3), and SKVLB (lane 4), an MDR cell line included as a positive control. Competitive RT-PCR, involving coamplification of MDR1 (167 bp) and control b2-microglobulin
(120-bp) gene sequences, was subjected to 30 cycles and the products were separated on 10% PAGE followed by ethidium bromide stain-ing. Lane 5, water control.
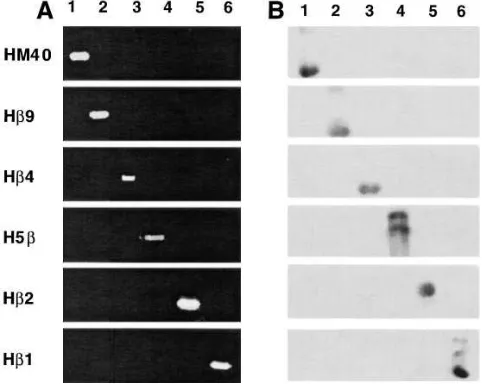
[image:5.612.313.550.639.706.2]ther DNA or cDNA clones of the six human b-tubulin genes demonstrated the high specificity of these isotype-specific primer pairs (Fig. 4 A). In addition, 40-bp synthetic oligonucle-otides were designed based on the 59UTR region of HM40, Hb9, H5b, Hb2, and Hb1, and the 39UTR region for Hb4, for use in Southern and Northern analyses (Table II). The abso-lute specificity of these oligonucleotides was confirmed by probing Southern blots containing plasmid DNA of all six
b-tubulin isotypes (Fig. 4 B).
After confirmation of the specificity of the oligonucleotide primers, b-tubulin gene expression was initially determined in parental and taxol-resistant sublines. Competitive PCR involv-ing the coamplification of a control gene, b2-microglobulin,
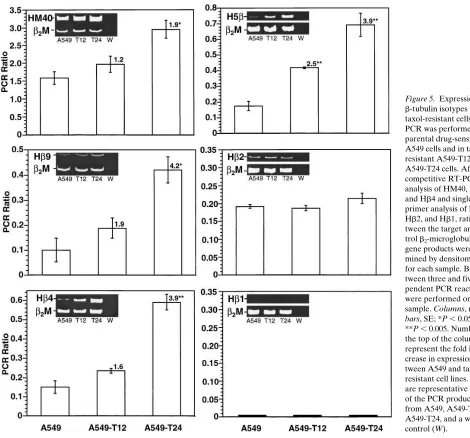
with a specific b-tubulin isotype was used for gene expression analysis. This assay has proven useful for the semiquantitative analysis of genes in both cell lines and tumor samples (30, 32). Expression of b-tubulin isotypes HM40, Hb9, and Hb4, was found in the A549 cells and their taxol-resistant derivatives (Fig. 5). However, no product was observed for H5b, Hb2, and Hb1 after competitive PCR. To improve the sensitivity of the assay for these three isotypes, the PCR was repeated in the ab-sence of primers for b2-microglobulin. Under these conditions,
products were observed for H5b and Hb2. The hematopoietic specific isotype, Hb1, for which we obtained for the first time a partial sequence, was not expressed in either the A549, A549-T12, or A549-T24 cells.
Densitometric analysis of expression levels of each of the isotypes was quantitated relative to the expression of the con-trol gene, b2-microglobulin, by determining the ratio between
the target and control gene PCR products (Fig. 5). The mean PCR ratio for the most abundant isotype, HM40, was in-creased 1.9-fold in the most resistant cell line, A549-T24 (P ,
0.05). In contrast, Hb9, Hb4, and H5b, all expressed at low lev-els in A549 cells, increased approximately two- and fourfold in A549-T12 and A549-T24 cells, respectively. This increase cor-responds to a concomitant increase in taxol resistance in these two sublines. Consistent with the PCR results, Northern analy-sis revealed an increase in expression of the Hb4 gene in both A549-T12 and A549-T24 cells compared with the A549 cells (Fig. 6). Although there was an increase in Hb9 gene expres-sion, the overall levels of this gene remained relatively low as demonstrated by both the PCR ratio and the representative picture of the PCR products. Expression levels of Hb2 and Hb1 remained unaltered between parental and taxol-resistant cells (Fig. 5).
[image:6.612.57.298.409.601.2]To determine whether an increased gene expression level of a specific tubulin isotype correlated with an increase at the protein level, A549 and A549-T24 cells were stained with an antibody to either a-tubulin or class III b-tubulin and visual-ized with a fluorescent secondary antibody (Fig. 7). No change in the level of expression of a-tubulin was seen between the two cell lines. In contrast, there is a clear increase in fluores-cence intensity as determined by digital microscopy of the class III b-tubulin isotype in the A549-T24 cells compared with the drug-sensitive A549 cells. The class III b-tubulin isotype is the gene product of the Hb4 gene which was found to be increased by both PCR (Fig. 5) and Northern analysis (Fig. 6) in the taxol-resistant cells.
Figure 3. Partial sequence of b-tubulin gene Hb1. (A) Schematic representation of the position of the partial sequence of Hb1 in relation to exon 1. The horizontal arrow represents the ATG start site of exon 1 (nucleotides 1–57). (B) Sequence of the first 106 nucleotides in the 59UTR and the 57 nucleotides of the coding sequence of exon 1. The ATG start site is underlined and the amino acids corresponding to the nucleotide sequence of exon 1 are indi-cated.
Figure 4. Specificity of (A) PCR primers and (B) oligonucleotide probes for the study of each of the six human b-tubulin genes. (A) Plasmids harboring sequences to human b-tubulin HM40 (lane 1), Hb9 (lane 2), Hb4 (lane 3), H5b (lane 4), Hb2 (lane 5), and Hb1 (lane 6) genes were subjected to 35 cycles of PCR and the products (5 ml) were separated by 10% PAGE before visualization by ethidium bromide staining. Gene-specific PCR primers for each reaction mix are listed in Table I. (B) Plasmid DNA (250 ng) was electrophoreti-cally separated on 0.8% agarose gels, then alkaline-transferred to ni-trocellulose membranes. Membranes were hybridized for 1 h with g-32P–labeled oligonucleotide probes at the appropriate temperature
Analysis of resistance mechanisms in primary and
taxol-resistant tumors.To investigate the mechanisms of clinical
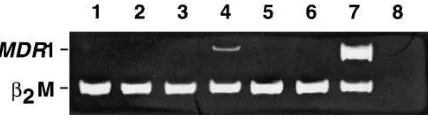
re-sistance to taxol, we examined primary and taxol-resistant ova-rian and peritoneal epithelial tumors. Samples of normal ovary from pre- and postmenopausal women were included as con-trols. The stage, histology, and post–taxol treatment sampling times are listed in Table IV. Due to the hydrophobic nature of taxol that induces overproduction of P-glycoprotein, all tu-mors were initially examined for expression of the MDR1 gene (Fig. 8). None of the untreated tumors expressed MDR1. Of the four taxol-resistant tumors, only one, OTR3, had detect-able MDR1 gene expression. The level of expression was similar to that found for A549-T24 cells (Fig. 1) and was significantly lower than SKVLB cells. Unfortunately, no pretreatment tu-mor material was available from this patient to determine whether MDR1 expression was intrinsic to the tumor or ac-quired after treatment. In one instance, tumor cells were avail-able for analysis from the same patient both before (OT11) and after (OTR11) therapy. The untreated sample did not ex-press MDR1 and despite extensive chemotherapy with the
MDR-associated drugs, VP-16 and taxol, no MDR1 was de-tected (Fig. 8).
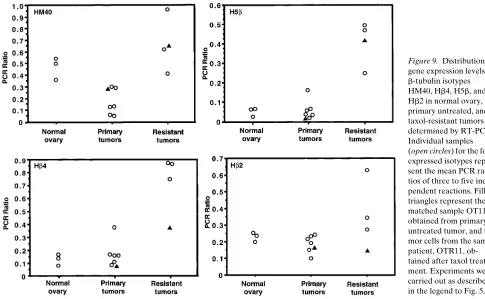
[image:7.612.59.529.57.495.2]b-Tubulin expression of each of the six isotypes was ana-lyzed in normal ovary, untreated primary, and taxol-resistant ovarian tumors by RT-PCR. Fig. 9 depicts the mean PCR ra-tios of individual samples of normal ovary, primary, and taxol-resistant epithelial tumor cells for HM40, Hb4, H5b, and Hb2.
Figure 5. Expression of b-tubulin isotypes in taxol-resistant cells. RT-PCR was performed in parental drug-sensitive A549 cells and in taxol-resistant A549-T12 and A549-T24 cells. After competitive RT-PCR analysis of HM40, Hb9, and Hb4 and single primer analysis of H5b, Hb2, and Hb1, ratios be-tween the target and con-trol b2-microglobulin
gene products were deter-mined by densitometry for each sample. Be-tween three and five inde-pendent PCR reactions were performed on each sample. Columns,mean;
bars, SE; *P , 0.05; **P , 0.005. Numbers at the top of the columns represent the fold in-crease in expression be-tween A549 and taxol-resistant cell lines. Insets are representative gels of the PCR products from A549, A549-T12, A549-T24, and a water control (W).
Figure 6. Northern blot analy-sis of b-tubulin isotype expres-sion. Total RNA (30 mg/lane) was subjected to electrophore-sis in a 1% agarose gel under denaturing conditions. After transfer onto nitrocellulose membranes, hybridization was performed as described for Fig. 4. Lane 1, A549; lane 2, A549-T12; and lane 3, A549-T24. In the top panel, hybridization was performed with a g-32P–labeled
One of the untreated samples, OT11, has a matched sample, OTR11, which was clinically resistant to taxol. Significant in-creases in expression of HM40 (P , 0.05), Hb4 (P , 0.05), and H5b (P, 0.005) were observed in the taxol-resistant sample compared with the untreated sample. In contrast to the taxol-resistant A549 cells described in the preceding section, levels of expression of Hb9 remained low and unchanged in the hu-man tissue samples (data not shown). Gene expression of the hematopoietic specific isotype Hb1 was detected in some of the samples, but interpretation of these results was difficult due to the variable levels of blood contamination in some of the samples (data not shown).
Samples were then grouped and differences in expression of the isotypes HM40, Hb4, H5b, and Hb2 between normal ovary, primary untreated ovarian, and taxol-resistant tumors were determined (Fig. 10). The level of gene expression for the individual b-tubulin isotypes did not differ significantly be-tween normal ovary and primary untreated tumors. The one exception was HM40, the gene that encodes the class I isotype, which was significantly lower in primary tumors compared
with normal ovary (2.6-fold decrease, P , 0.005). Further-more, expression of this isotype significantly increased in resis-tant tumors compared with primary tumors (3.6-fold, P ,
0.005). Significant increases in gene expression were also ob-served for Hb4 and H5b (4.4- and 7.6-fold, respectively, P ,
0.005) and interestingly, both of these isotypes were expressed at very low levels in normal ovaries.
Expression of the Hb2 isotype was consistent between nor-mal ovary (mean PCR ratio 0.230), primary (mean PCR ratio 0.187), and taxol-resistant ovarian tumor cells (mean PCR ra-tio 0.232 for OTR11, OTR4, and OTR5). One of the taxol-resis-tant samples, OTR3, expressed high levels of Hb2 compared with normal ovary or primary tumors (mean PCR ratio 0.784). This level of expression was similar to that obtained for an ovarian carcinoma cell line, OVCAR, which was also very high compared with normal ovary (mean PCR ratio 0.778; data not shown).
Discussion
An increase in the use of taxol in the treatment of a number of human cancers and in combination with platinum as first-line therapy for advanced ovarian carcinoma, has highlighted the need to understand the mechanisms responsible for the devel-opment of resistance to this drug. Taxol resistance is most likely due to a variety of mechanisms including increased ex-pression of the MDR1 gene. Alterations in both the expression levels of the target molecule, tubulin (7, 35), and in the electro-phoretic mobility of tubulin subunits in taxol-resistant cells have been reported (36–38). To examine the contribution of individual b-tubulin isotypes to taxol resistance, we have de-signed gene-specific oligonucleotides for all six human b -tubu-lin genes including the hematopoietic isotype, Hb1, for which we determined a partial sequence. By developing a highly spe-cific PCR procedure we were able to examine the expression of individual b-tubulin genes in both sensitive and taxol-resis-tant lung cancer cell lines. Moreover, we demonstrated for the first time that clinically derived taxol-resistant ovarian epithe-lial tumor cells display increased expression of specific b -tubu-lin genes compared with primary untreated tumors.
Due to the high sequence and amino acid identity of the
b-tubulin isotypes, careful selection of oligonucleotide se-quences for RT-PCR was required. PCR screening of plasmids harboring the genes encoding the various isotypes established the specificity of the primer pairs. Similarly, when oligonucle-otide probes were radioactively labeled and hybridized to in-tact plasmid DNA harboring the b-tubulin genes, no cross-reactivity of the probes was observed. Therefore, these primer pairs and oligonucleotide probes provide valuable tools for the study of b-tubulin expression in human cell lines and tissues. Furthermore, the highly sensitive PCR assay is extremely use-ful for the analysis of gene expression where limited material is available, such as clinical samples.
Taxol-resistant human lung cancer cells, selected in the presence of low levels of taxol, did not express MDR1, thereby excluding MDR as a significant mechanism of resistance. Al-though there was no significant change in total levels of tubulin in the resistant cell lines, this did not exclude the possibility that the relative levels of the individual b-tubulin isotypes were altered. In previous analyses of low-level taxol-resistant cell populations there also had been no increase in overall
[image:8.612.56.274.57.401.2]bulin expression reported (37, 39). There is evidence to suggest that an increase in total tubulin may not be compatible with cell viability (40, 41). However, RT-PCR analysis demon-strated increased expression of specific b-tubulin genes in these taxol-resistant cells. HM40, which encodes the class I iso-type, was increased almost twofold in A549-T24. This gene is expressed to varying levels in a wide range of tissues (12) and appears to be the most abundant isotype in A549 cells. In-creased expression also was observed for the gene encoding the class II isotype, Hb9, which is most highly expressed in brain and to a lesser extent in lung tissue (17). Despite an ap-proximately fourfold increase in the most resistant subline, the overall expression of this isotype remained relatively low. Pre-viously, we reported increased expression of the murine class II isotype, Mb2, in highly taxol-resistant cells (22). In addition to Hb9, two brain-specific isotypes, Hb4 and H5b, which were expressed at very low levels in the parental A549 cells, in-creased significantly with increasing taxol resistance. Inin-creased expression of Hb4 (class III) and H5b (class IVa) also has been reported in both taxol-selected human leukemia cells and es-tramustine-resistant human prostate carcinoma cells (31, 42).
Having demonstrated that specific b-tubulin changes are associated with taxol resistance in laboratory-derived cell lines, it was important to determine whether similar changes in expression occurred in taxol-refractory ovarian tumors. We were able to demonstrate specific b-tubulin alterations in a range of histological subtypes of both untreated epithelial and taxol-resistant ovarian tumors. Two of the b-tubulin isotype genes, Hb4 and H5b, increased significantly in the taxol-resis-tant tumors compared with the primary untreated tumors. Based on the following two observations, the increased expres-sion of these two isotypes could be of importance in taxol resis-tance. First, increased expression of these isotypes was ob-served in both taxol-resistant cell lines and taxol-resistant tumors. Second, these two isotypes are brain specific and
nor-mally are not expressed to significant levels in tissues of non-neuronal origin.
[image:9.612.57.569.78.270.2]HM40 gene expression was significantly higher in the taxol-resistant tumors (3.6-fold) than in the primary untreated tu-mors. Except for HM40, gene expression in normal ovary was not significantly different from that observed in primary tu-mors. Human ovaries are covered by a surface epithelium and 90% of all ovarian cancers are epithelial in origin (43). How-ever, the ovary is a complex organ made up of a number of cell types, and cells of nonepithelial origin may be contributing to the increased expression of HM40 found in normal ovary. Limited information is available on the tissue and cell type dis-tribution of b-tubulin isotypes in normal human tissues with most of the information being deduced from human cell lines (44). The other constitutively expressed b-tubulin gene, Hb2, did not differ significantly between primary and taxol-resistant tumors. However, one of the resistant samples, OTR3, ex-pressed high levels of Hb2 (PCR ratio 0.628). This sample was obtained from a patient with rapid disease progression as re-flected by the number of days after taxol treatment that the tu-mor cells were collected. Whether this increase is a reflection of the aggressiveness of the disease, or whether it reflects an
Table IV. Ovarian Tumor Data
Sample Stage* Differentiation Histology‡
Tumor-bearing ascites fluid collection (days after taxol treatment)
OC2 — — Normal premenopausal ovary —
OC3 — — Normal postmenopausal ovary —
OC4 — — Normal postmenopausal ovary —
OT3 I Low malignant potential Serous —
OT48 I Low malignant potential Mucinous —
OT47 I Well Endometrioid —
OT11§ III Poorly Serous —
OT6§ III Poorly Serous —
OT49 IV Poorly Serous —
OT9 IV Poorly Papillary serous —
OTR3i III Poorly¶ Serous 19
OTR4i III Moderately¶ Serous 73
OTR5§i III Poorly¶ Serous 120
OTR11§i** III Poorly¶ Serous 33
*FIGO (International Federation of Gynecology and Obstetrics), 1988 criteria. ‡Based on WHO 1973 criteria. **OTR11 is the matched
drug-resis-tant sample of OT11, which was obtained at diagnosis. iRepresents samples obtained from tumor-bearing ascites fluid. Treatment regimens for each
of the patients were as follows: OTR3 (taxol/carbo, CTX/CDDP 33, ADR 32, HMM 32, taxol 36), OTR4 (taxol/CDDP 34, taxol/carbo 32, ADR/ CTX 32), OTR5 (CTX/CDDP 36, carbo/VP-16 31, carbo 32, taxol/carbo 36) and OTR11 (CTX/CDDP 36, carbo/VP-16 36, taxol 35). Carbo, carboplatin; CDDP, cisplatin; CTX, cytoxan; ADR, adriamycin; VP-16, etoposide; and HMM, hexamethylmelamine. §Epithelial tumors derived from
peritoneum. ¶Differentiation status of primary tumor.
Figure 8. MDR1 expression in taxol-resistant ovarian tumors. RT-PCR was performed on the following samples: OC3 (lane 1), OT11 (lane 2), OTR11 (lane 3), OTR3 (lane 4), OTR4 (lane 5), OTR5 (lane
[image:9.612.317.532.623.682.2]increase as a result of the taxol treatment per se, is difficult to establish. Direct observation of changes that occur as a result of treatment can greatly contribute to our understanding of re-sistance mechanisms. Of the epithelial tumors analyzed in this
[image:10.612.56.541.58.357.2]study, one matched pair was obtained before, OT11, and after, OTR11, treatment with taxol. A very large increase (42-fold) was observed for H5b in the taxol-resistant sample, although accurate quantitation was difficult due to the barely detectable
Figure 9. Distribution of gene expression levels of b-tubulin isotypes HM40, Hb4, H5b, and Hb2 in normal ovary, primary untreated, and taxol-resistant tumors as determined by RT-PCR. Individual samples (open circles) for the four expressed isotypes repre-sent the mean PCR ra-tios of three to five inde-pendent reactions. Filled triangles represent the matched sample OT11, obtained from primary untreated tumor, and tu-mor cells from the same patient, OTR11, ob-tained after taxol treat-ment. Experiments were carried out as described in the legend to Fig. 5.
Figure 10. b-Tubulin gene expression in taxol-resistant ovarian tumors. Mean PCR ratios for in-dividual samples of nor-mal ovary, primary untreated, and taxol-resistant tumors were pooled and differences between the primary un-treated and taxol-resis-tant tumors were deter-mined. Columns, means;
[image:10.612.59.508.441.741.2]levels of this gene in the untreated sample. The predominant
b-tubulin isotype in platelets is Hb1 (17), and by RT-PCR high expression of this isotype was found in human platelets and to a much lesser extent in placenta (Kavallaris, M., and S.B. Hor-witz, unpublished observations). This isotype shares the lowest degree of amino acid identity with the other b-tubulin isotypes and is thought to have a specialized function for the assembly of marginal bands in certain hematopoietic lineages. The cell type distribution of this isotype is thought to follow a similar pattern to that found in murine tissues, although data on the tissue-specific expression of this and other b-tubulin isotypes in human tissues and tumors are again limited (17). Although some low level Hb1 gene expression was detected by noncom-petitive RT-PCR for ovarian tumors, results were difficult to interpret due to low level blood contamination of some of the samples.
The increased expression of the same specific b-tubulin iso-types in both taxol-selected tumor cell lines and clinically de-rived taxol-resistant populations suggests that this alteration may be involved in the resistance phenotype. It had been sug-gested previously that the role of different tubulin isotypes may be to bind distinct microtubule-associated proteins (MAPs) and in effect add to microtubule functional variability (17, 45, 46). Most differences among the isotypes are clustered in the carboxy-terminal region, an area involved in MAP binding (47). Posttranslational modifications of b-tubulin occur in the carboxy-terminal domain and interestingly, the four isotypes that demonstrated altered expression associated with taxol re-sistance, HM40, Hb9, Hb4, and H5b, can be glutamylated (48– 50). Glutamylation increases the acidity of an already acidic domain of the tubulin molecule and this region is functionally important due to its interaction with various MAPs. The class III b-tubulin isotype can also be phosphorylated and this post-translational modification is thought to be involved in regulat-ing in vivo microtubule assembly (51). While increased ex-pression of specific b-tubulin isotypes in response to taxol treatment could be due to gene amplification in the taxol-resis-tant cell lines and tumors, translational and posttranslational modifications seem more likely.
Increased expression of the MDR1 gene is a mechanism that has been associated with taxol resistance (7). However, untreated ovarian carcinoma generally expresses low (29, 52, 53) to undetectable levels (54) of the MDR1 gene. Although increased MDR1 expression has been reported in some ova-rian tumors treated with MDR-associated drugs (55), other factors are likely to contribute to drug resistance in this carci-noma. In our cohort of samples from both untreated and taxol-resistant tumors, MDR1 expression did not appear to be a significant mechanism of resistance. Only one of the taxol-resistant tumors displayed MDR1 gene expression and this was at a level similar to that observed for the A549-T24 cells. Furthermore, ovarian tumors which are resistant to the MDR-associated drug adriamycin are often responsive to taxol (56), indicating that mechanisms responsible for resistance in these tumors are not common to both drugs. In another gynecologi-cal malignancy, endometrial carcinoma, we have found that
MDR1 expression was not involved in the drug-resistance phe-notype of these tumors (27). To date, cells expressing high lev-els of the MDR-associated protein (MRP), display either no resistance or low level resistance to taxol (57, 58).
Ovarian tumors used in this study were defined as taxol-resistant if they had disease recurrence or progression within
6 mo of taxol-based therapy. All patients for whom tumor cells had been obtained had received multiple treatment modalities. The taxol-resistant samples had been obtained from patients that had been treated with five cycles or more of either taxol/ platinum-based combination therapy or taxol alone. All four patients had been treated with at least one other MDR-associ-ated drug apart from taxol. However, taxol is the only drug whose cellular target is the microtubule. Although we cannot exclude the possibility that other chemotherapeutic drugs in-fluenced the expression of specific b-tubulin isotypes, this pos-sibility is unlikely based on available data on the mode of ac-tion and resistance mechanisms of the other drugs used in ovarian cancer therapy (59). Furthermore, clinically derived taxol-resistant ovarian tumor cells displayed similar b-tubulin alterations to the A549 cells selected solely in the presence of taxol.
Altered expression of distinct isotypes could modify tubu-lin/microtubule dynamics or stability of microtubules in such a way that the action of taxol is diminished. Selection of less sta-ble isotypes could offer cells a survival advantage when ex-posed to a stabilizing drug such as taxol. Panda et al. (18) dem-onstrated that in vitro microtubule dynamics can be regulated by the tubulin isotype composition. In vitro, increased taxol-induced polymerization was observed in b-tubulin class III– depleted microtubules compared with nondepleted microtu-bules (21). Convincing evidence that alterations in b-tubulin isotype composition may modulate taxol resistance came from a recent study using purified b-tubulin isotypes (60). Microtu-bules composed of class III and class IV b-tubulin isotypes were found to be 7.4- and 7.2-fold less sensitive, respectively, to the effects of bound taxol than microtubules assembled from unfractionated tubulin. This strongly suggests that de-pending on the composition of b-tubulin isotypes, taxol can differentially modulate microtubule dynamics. Expression of both the class III (Hb4 gene product) and class IVa (H5b gene product) was increased in our taxol-resistant cell lines and taxol-resistant ovarian tumors, corresponding with a reduced sensitivity of these isotypes to taxol.
With increasing use of taxol in the treatment of ovarian cancer, mechanisms responsible for resistance to this drug need to be elucidated. Drug resistance is often a multifactorial process and although we cannot exclude the possibility that mechanisms distinct from b-tubulin isotype changes are con-tributing to taxol resistance, we provide evidence that expres-sion of b-tubulin isotypes HM40, Hb4, and H5b is increased in taxol-resistant cell lines and human tumors. This strongly sug-gests that this alteration is contributing to the resistance phe-notype. Furthermore, the mechanism by which two of the iso-types, Hb4 and H5b, which are not usually expressed in lung or ovary, are regulated in taxol-resistant cells warrants further investigation. Improved understanding of the way in which
b-tubulin isotype expression is altered, and the effect it has on microtubule dynamics in response to taxol treatment in human tumors could assist in the development of strategies to circum-vent resistance.
Acknowledgments
Ein-stein College of Medicine and Montefiore Medical Center, Bronx, New York) for her support and help in obtaining the tumor samples, and Michael Cammer and the Analytical Imaging Facility, Albert Einstein College of Medicine, for assistance with the immunofluores-cence analysis.
This study was undertaken during the tenure of a Research Train-ing Fellowship awarded by the International Agency for Research on Cancer (M. Kavallaris). C.A. Burkhart was supported by National In-stitute of General Medical Sciences Training Program in Pharmaco-logical Sciences grant 5T32 GM07260. This research was supported in part by US Public Health Service grant CA39821 (S.B. Horwitz) and Cancer Core support grant CA13330.
References
1. Parker, S.L., T. Tong, S. Bolden, and P.A. Wingo. 1996. Cancer Statistics, 1996. CA Cancer J. Clin. 46:5–27.
2. Cannistra, S.A. 1993. Cancer of the ovary. N. Engl. J. Med. 329:1550– 1559.
3. Johnson, S.W., R.E. Ozols, and T.C. Hamilton. 1993. Mechanisms of drug resistance in ovarian cancer. Cancer. 71:644–649.
4. McGuire, W.P., W.J. Hoskins, M.F. Brady, P.R. Kucera, E.E. Partridge, K.Y. Look, D.L. Clarke-Pearson, and M. Davidson. 1996. Cyclophosphamide and cisplatin compared with paclitaxel and cisplatin in patients with stage III and stage IV ovarian cancer. N. Engl. J. Med. 334:1–6.
5. Holmes, F.A., R.S. Walters, R.L. Theriault, A.D. Forman, L.K. Newton, M.N. Raber, A.U. Buzdar, D.K. Frye, and G.N. Hortobagyi. 1991. Phase II trial of taxol, an active drug in the treatment of metastatic breast cancer. J. Natl.
Cancer Inst. 83:1797–1805.
6. Murphy, W.K., F.V. Fossella, R.J. Winn, D.M. Shin, H.E. Hynes, H.M. Gross, E. Davilla, J. Leimert, H. Dhingra, M.N. Raber, et al. 1993. Phase II trial of taxol in patients with untreated advanced non-small-cell lung cancer. J. Natl.
Cancer Inst. 85:384–387.
7. Horwitz, S.B., D. Cohen, S. Rao, I. Ringel, H.J. Shen, and C.P. Yang. 1993. Taxol: mechanisms of action and resistance. J. Natl. Cancer Inst. Monogr.
15:55–61.
8. Wani, M.C., H.L. Taylor, M.E. Wall, P. Coggon, and A.T. McPhail. 1971. Plant antitumor agents VI. The isolation and structure of taxol, a novel antileu-kemic and antitumor agent from taxus brevifolia. J. Am. Chem. Soc. 93:2325– 2327.
9. Schiff, P.B., and S.B. Horwitz. 1980. Taxol stabilizes microtubules in mouse fibroblast cells. Proc. Natl. Acad. Sci. USA. 77:1561–1565.
10. Rao, S., G.A. Orr, A.G. Chaudhary, D.G.I. Kingston, and S.B. Horwitz. 1995. Characterization of the taxol binding site on the microtubule. J. Biol.
Chem. 270:20235–20238.
11. Cowan, N.J., and L. Dudley. 1983. Tubulin isotypes and the multigene tubulin families. Int. Rev. Cytol. 85:147–173.
12. Lewis, S.A., and N.J. Cowan. 1990. Tubulin genes: structure, expression, and regulation. In Microtubule Proteins. J. Avila, editor. CRC Press, Inc., Boca Raton, FL. 37–66.
13. Sullivan, K.F., and D.W. Cleveland. 1986. Identification of conserved isotype-defining variable region sequences for four vertebrate b tubulin polypeptide classes. Proc. Natl. Acad. Sci. USA. 83:4327–4331.
14. Sullivan, K.F. 1988. Structure and utilization of tubulin isotypes. Annu.
Rev. Cell Biol. 4:687–716.
15. Burgoyne, R.D., M.A. Cambray Deakin, S.A. Lewis, S. Sarkar, and N.J. Cowan. 1988. Differential distribution of b-tubulin isotypes in cerebellum.
EMBO (Eur. Mol. Biol. Organ.) J. 7:2311–2319.
16. Cowan, N.J., S.A. Lewis, S. Sarkar, and W. Gu. 1987. Functional versa-tility of mammalian b-tubulin isotypes. In The Cytoskeleton in Cell Differentia-tion and Development. R. Maccioni and J. Arechaya, editors. ICSU Press, Mi-ami, FL. 157–166.
17. Wang, D., A. Villasante, S.A. Lewis, and N.J. Cowan. 1986. The mam-malian b-tubulin repertoire: hematopoietic expression of a novel heterologous
b-tubulin isotype. J. Cell Biol. 103:1903–1910.
18. Panda, D., H.P. Miller, A. Banerjee, R.F. Luduena, and L. Wilson. 1994. Microtubule dynamics in vitro are regulated by the tubulin isotype composi-tion. Proc. Natl. Acad. Sci. USA. 91:11358–11362.
19. Derry, W.B., L. Wilson, and M.A. Jordan. 1995. Substoichiometric bind-ing of taxol suppresses microtubule dynamics. Biochemistry. 34:2203–2211.
20. Jordan, M.A., R.J. Toso, D. Thrower, and L. Wilson. 1993. Mechanism of mitotic block and inhibition of cell proliferation by taxol at low concentra-tions. Proc. Natl. Acad. Sci. USA. 90:9552–9556.
21. Lu, Q., and R.F. Luduena. 1993. Removal of bIII isotype enhances taxol induced microtubule assembly. Cell Struct. Funct. 18:173–182.
22. Haber, M., C.A. Burkhart, D.L. Regl, J. Madafiglio, M.D. Norris, and S.B. Horwitz. 1995. Altered expression of Mb2, the class II b-tubulin isotype, in a murine J744.2 cell line with a high level of taxol resistance. J. Biol. Chem. 270:
31269–31275.
23. Roy, S.N., and S.B. Horwitz. 1985. A phosphoglycoprotein associated with taxol resistance in J774.2 cells. Cancer Res. 45:3856–3863.
24. Greenberger, L.M., L. Lothestein, S.S. Williams, and S.B.H. Horwitz. 1988. Distinct P-glycoprotein precursors are overproduced in independently isolated drug-resistant cell lines. Proc. Natl. Acad. Sci. USA. 85:3762–3766.
25. Towbin, H., T. Staehelm, and J. Gordon. 1979. Electrophoretic transfer of proteins from nitrocellulose sheets: procedure and some applications. Proc.
Natl. Acad. Sci. USA. 76:4350–4354.
26. Chomczynski, P., and N. Sacchi. 1987. Single-step method of RNA isola-tion by acid guanidinium thiocyanate-phenol-chloroform extracisola-tion. Anal.
Bio-chem. 162:156–159.
27. Kuo, D.Y.-S., S. Mallick, H.-J. Shen, C. DeVictoria, J. Jones, A.L. Fields, G.L. Goldberg, C.D. Runowicz, and S.B. Horwitz. 1996. Analysis of MDR1 expression in normal and malignant endometrium by reverse transcrip-tion-polymerase chain reaction and immunohistochemistry. J. Clin. Cancer Res.
2:1981–1992.
28. Chomczynski, P. 1993. TRI Reagent: RNA, DNA, Protein Isolation Re-agent. Manufacturer Protocol, Molecular Research Center, Inc., Cincinnati, OH.
29. Noonan, K.E., C. Beck, T.A. Holzmayer, J.E. Chin, J.S. Wunder, I.L. Andrulis, A.F. Gazdar, C.L. Willman, B. Grifith, D.D. Von Hof, and I.B. Ron-inson. 1990. Quantitative analysis of MDR1 (multidrug resistant) gene expres-sion in human tumors by polymerase chain reaction. Proc. Natl. Acad. Sci. USA. 87:7160–7164.
30. Gilbert, J., M.D. Norris, M. Haber, M. Kavallaris, G.M. Marshall, and B.W. Stewart. 1993. Determination of N-myc gene amplification in neuroblas-toma by differential polymerase chain reaction. Mol. Cell. Probes. 7:227–234.
31. Jaffrezou, J.-P., C. Dumontet, W.B. Derry, G. Duran, G. Chen, E. Tsuchiya, L. Wilson, M.A. Jordan, and B.L. Sikic. 1995. Novel mechanism of re-sistance to Paclitaxel (Taxol‚) in human K562 leukemia cells by combined selec-tion with PSC 833. Oncol. Res. 7:517–527.
32. Bordow, S.B., M. Haber, J. Madafiglio, B. Cheung, G.M. Marshall, and M.D. Norris. 1994. Expression of the multidrug resistance-associated protein (MRP) gene correlates with amplification and overexpression of the N-myc on-cogene in childhood neuroblastoma. Cancer Res. 54:5036–5040.
33. Chomczynski, P., and P.K. Qasba. 1984. Alkaline transfer of DNA to plastic membrane. Biochem. Biophys. Res. Commun. 122:340–344.
34. Khandjian, E.W., and C. Meric. 1986. A procedure for northern blot analysis of native RNA. Anal. Biochem. 159:227–232.
35. Cabral, F., and S.B. Barlow. 1989. Mechanisms by which mammalian cells acquire resistance to drugs that affect microtubule assembly. FASEB (Fed.
Am. Soc. Exp. Biol.) J. 3:1593–1599.
36. Cabral, F.R., R.C. Brady, and M.J. Schibler. 1986. A mechanism of cel-lular resistance to drugs that interfere with microtubule assembly. Ann. NY
Acad. Sci. 466:745–756.
37. Ohta, S., K. Nishio, N. Kubota, T. Ohmori, Y. Funayama, T. Ohira, H. Nakajima, M. Adachi, and N. Saijo. 1994. Characterisation of a taxol-resistant human small-cell lung cancer cell line. Jpn. J. Cancer Res. 85:290–297.
38. Laferriere, N.B., and D.L. Brown. 1995. Effects of taxol on the polymer-ization and posttranslational modification of class III b-tubulin in P19 embryo-nal carcinoma cells. Biochem. Cell Biol. 73:687–694.
39. Minotti, A.M., S.B. Barlow, and F. Cabral. 1991. Resistance to antimi-totic drugs in Chinese hamster ovary cells correlates with changes in the level of polymerized tubulin. J. Biol. Chem. 266:3987–3994.
40. Weinstein, B., and F. Solomon. 1990. Phenotypic consequences of tubu-lin overproduction in Saccharomyces cerevisiae: differences between alpha-tubulin and beta-alpha-tubulin. Mol. Cell. Biol. 10:5295–5304.
41. Burke, D., P. Gasdaska, and L. Hartwell. 1989. Dominant effects of tu-bulin overexpression in Saccharomyces cerevisiae. Mol. Cell. Biol. 9:1049–1059.
42. Ranganathan, S., D.W. Dexter, C.A. Benetatos, A.E. Chapman, K.D. Tew, and G.R. Hudes. 1996. Increase of bIII- and bIVa-tubulin in human prostate carcinoma cells as a result of estramustine resistance. Cancer Res. 56:2584–2589. 43. Murdoch, W.J. 1996. Ovarian surface epithelium, ovulation and carcino-genesis. Biol. Rev. 71:529–543.
44. Lewis, S.A., M.E. Gilmartin, J.L. Hall, and N.J. Cowan. 1985. Three ex-pressed sequences within the human b-tubulin multigene family each define a distinct isotype. J. Mol. Biol. 182:11–20.
45. Lewis, S.A., W. Gu, and N.J. Cowan. 1987. Free intermingling of mam-malian b-tubulin isotypes among functionally distinct microtubules. Cell. 49: 539–548.
46. Lewis, S.A., M. Gwo-Shu Lee, and N.J. Cowan. 1985. Five mouse tubu-lin isotypes and their regulated expression during development. J. Cell Biol.
101:852–861.
47. Luduena, R.F. 1993. Are tubulin isotypes functionally significant? Mol. Biol. Cell. 4:445–457.
48. Alexander, J.E., D.F. Hunt, M.K. Lee, J. Shabanowitz, H. Michel, S.C. Berlin, T.L. Macdonald, R.J. Sunberg, L.I. Rebhun, and A. Frankfurter. 1991. Characterization of posttranslational modifications in neuron-specific class III
glutamy-lated. FEBS (Fed. Eur. Biochem. Soc.) Lett. 353:89–94.
50. Rudiger, M., U. Plessman, K.-D. Kloppel, J. Wehland, and K. Weber. 1992. Class II tubulin, the major brain b tubulin isotype is polyglutamylated on glutamic acid residue 435. FEBS (Fed. Eur. Biochem. Soc.) Lett. 308:101–105.
51. Khan, I.A., and R.F. Luduena. 1996. Phosphorylation of bIII-tubulin.
Biochemistry. 35:3704–3711.
52. Holzmayer, T.A., S. Hilsenbeck, D.D. Don Hoff, and I.B. Roninson. 1992. Clinical correlates of MDR1 (P-glycoprotein) gene expression in ovarian and small-cell lung carcinomas. J. Natl. Cancer Inst. 84:1486–1491.
53. Kavallaris, M., J.A. Leary, J.A. Barrett, and M.L. Friedlander. 1996. MDR1 and multidrug resistance-associated protein (MRP) gene expression in epithelial ovarian tumors. Cancer Lett. 102:7–16.
54. Bourhis, J., L.J. Goldstein, G. Riou, I. Pastan, M.M. Gottesman, and J. Benard. 1989. Expression of a human multidrug resistance gene in ovarian car-cinomas. Cancer Res. 49:5062–5065.
55. Bell, D.R., J.H. Gerlach, N. Kartner, R.N. Buick, and V. Ling. 1985. De-tection of P-glycoprotein in ovarian cancer: a molecular marker associated with multidrug resistance. J. Clin. Oncol. 3:311–315.
56. McGuire, W.P., E.K. Rowinsky, N.B. Rosenshein, F.C. Grumbine, D.S.
Ettinger, D.K. Armstrong, and R.C. Donehower. 1989. Taxol: a unique antineo-plastic agent with significant activity in advanced ovarian epithelial neoplasms.
Ann. Intern. Med. 111:273–279.
57. Zaman, G.J.R., M.J. Flens, M.R. van Leusden, M. de Haas, H.S. Mul-der, J. Lankelma, H.M. Pinedo, R.J. Scheper, F. Baas, H.J. Broxterman, and P. Borst. 1994. The human multidrug-resistance-associated protein MRP is a plasma membrane drug-efflux pump. Proc. Natl. Acad. Sci. USA. 91:8822–8826. 58. Cole, S.P.C., K.E. Sparkes, K. Fraser, D.W. Loe, C.E. Grant, G.M. Wil-son, and R.G. Deeley. 1994. Pharmacological characterisation of multidrug re-sistant MRP-transfected human tumor cells. Cancer Res. 54:5902–5910.
59. Van Der Zee, A.G.J., H.H. Hollema, H.W.A. De Bruijn, P.H.B. Willemse, H. Boonstra, N.H. Mulder, J.G. Aalders, and E.G.E. De Vries. 1995. Cell biological markers of drug resistance in ovarian carcinoma. Gynecol. On-col. 58:165–178.