DIET QUALITY TRANSITION OVER TIME AND ITS ASSOCIATION WITH CARDIOMETABOLIC RISKS AMONGADULTS IN CHINA
Zhihong Wang
A dissertation submitted to the faculty at the University of North Carolina at Chapel Hill in partial fulfillment of the requirements for the degree of Doctor of Philosophy in the
Department of Nutrition in the Gillings School of Global Public Health.
Chapel Hill 2016
Approved by:
Barry M. Popkin
Linda Adair
Penny Gordon-Larsen
Anna Maria Siega-Riz
ABSTRACT
Zhihong Wang: Dietary quality transition over time and its association with Cardiometabolic risks among adults in China
(Under the direction of Barry M. Popkin)
The expanding burden of obesity and associated cardiometabolic risk (CM) in Asian
populations is of particular concern given their higher CM risk at lower BMI level and at
younger ages relative to Western populations. An index-based diet quality approach is a
useful way to capture the complex interplay of dietary constituents and fully investigate the
overall diet - disease relationship. Many studies have shown that Alternative Healthy Eating
Index-2010(AHEI-2010), created based on Harvard Healthy Eating Pyramid (HEP), were
negatively associated with the risks of obesity, dyslipidemia, diabetes, some cancer and
mortality in US and European population.
Using the panel data of China Health and Nutrition Survey from 1991 to 2011, we
examined the association of index-based current diet quality (one time point of 2006 wave) or
long-term diet quality trends (from 1991 to 2006) and cardiometabolic risks among adults
aged 18 to 65 in China.
In Aim 1, we used Chinese dietary guidelines to create the China dietary quality index
(CDQI) and tailored the AHEI-2010 to match the Chinese diet (named as tAHEI). Then we
examined the association between the CDQI and tAHEI score in 2006 with risk of diabetes
and major CM risks in 2009. We found that the CDQI and tAHEI score showed similarly
negative associations with risk of low density lipoprotein cholesterol (LDL-C), whereas the
CDQI score was positively associated with elevated triacylglycerol risk in women. Aim 2
investigated socioeconomic disparity in 20-year diet quality transition. Results indicated that
distribution, with greater improvement in those starting with better diet quality. In Aim 3 we
evaluated the association of 15-year diet quality trends with diabetes biomarkers in 2009.
High baseline score and high increase in the score were independently associated with lower
Homeostasis Model of Insulin Resistance (HOMA-IR) and insulin but not related to fasting
glucose, hemoglobin A1c and defined diabetes with certain exception.
In conclusion, our findings suggest that diet consistent with Harvard HEP had beneficial
impact on improving insulin resistance and LDL-C. Future nutrition intervention and policy
should give priority to adults with poor diet quality who generally have lower incomes and
ACKNOWLEDGEMENTS
This work would not have been possible without the valuable input and great support of
many people.
To my advisor, Barry Popkin. Without him, I would not have this valuable opportunity
pursuing a PhD program in the top division of nutrition epidemiology worldwide. He have
checked through my dissertation with patience and given me instructive suggestions. Without
his insightful guidance and persistent help, I would not finish the research. I’ll never forget
his warm hug and thoughtful encouragement when I felt frustrated and stressful. He also
plays an important role in indicating a bright road in my professional career. I am so proud of
being his student.
To my committee members, Linda Adair, Penny Gordon-Larsen, Anna Maria Siega-Riz,
and Jianwen Cai. Special thanks to them. They have contributed their precious time and
valuable expertise to my research. Without their encouragement, thoughtful consideration and
great support to me, my dissertation would not have been possible. I am extremely honored
of having them as my committee members.
To Shufa Du, Guifeng Jin, Phil Bardsley, Shuwen Ng, Michelle A. Mendez, Fei Dong,
Bonnie Qin, Qi Ning, Zhaohui Cui, Pengcheng Xun, Xiaofan Zhang and Xiao Zhang. They
give me generous supports and helpful advices in my data analyses, defense presentation and
dissertation writing-up.
To all the Nutrition and Epidemiology professors and students I interacted with. They
carefully designed their courses and helped me understand the basic concepts, learn
theoretical application and practice, and hone high-level skills in nutritional epidemiology. I
They are easygoing, hardworking and caring. They gave me great help, thoughtful
encouragement and valuable advice in my PhD study. I enjoyed wonderful time studying with
them at UNC.
To my directors and all my colleagues in National Institute for Nutrition and Health,
Fengying Zhai, Bing Zhang, Gangqiang Ding, Weixing Yan, Huijun Wang, Jiguo Zhang,
Wenwen Du, Chang Su, Ji Zhang, Hongru Jiang, Feifei Huang, Xiaofang Jia, Yifei Ouyang
and others. Without their great supports, thoughtful understanding and warm accompanying,
I would not finally succeed in my PhD study.
To my best friends, Ailing Liu, Zhenyu Yang, Deqian Mao, Yan Li, Xia Xu, Yuanyuan
Zhang and others. I enjoyed happy time of delicious foods, coffee flavor, and romantic music
with them. I treasure our friendship.
To my parents, my older brother, my husband and my lovely daughter. I am immensely
grateful to them. They have been a constant source of love, concern, support and strength all
these years. My father got a stroke in 2010 when I studied at UNC and has been paralyzed
these years. My mother and older brother did not tell me the truth because they were worried
of my heavy learning tasks. My husband transferred his PhD program to the UNC and my
family stayed together and enjoyed the good time of happy life and study. Special thanks to
my daughter, she has always accompanied me for support these years, even giving up her
own study with the teachers and best friends that she likes in Beijing. The lovely girl is the
love of my life.
I also thank the funding source, the Fogarty NIH grant that have made my studies
TABLE OF CONTENTS
LIST OF TABLES ··· ix
LIST OF FIGURES ··· xi
LIST OF ABBREVIATIONS ··· xii
CHAPTER 1. INTRODUCTION ··· 1
Background ··· 1
Research Aims ··· 2
CHAPTER 2. LITERATURE REVIEW ··· 5
The rising epidemics and burden of chronic disease in China ··· 6
Rapid shifts in Chinese food consumption call for a way to capture multidimensional complexity of diet as a whole ··· 6
Index-based dietary patterns approach: an alternative way to fully investigate the overall diet - disease relationship ··· 6
Why use the Althernative Healthy Eating Index-2010 to access Chinese diet quality? ··· 6
Concerns about the discrepancy between Chinese dietary guidelines and Harvard Healthy Eating Pyramid ··· 8
Advanced statistical methods to evaluate longitudinal trends in overall diet quality in depth ··· 8
Why use the China Health and Nutrition Survey ··· 9
CHAPTER 3. DIET QUALITY AND THE PREVALENCE OF TYPE 2 DIABETES AND MAJOR CARDIOMETABOLIC RISK FACTORS AMONG ADULTS IN CHINA ··· 11
Overview ··· 11
Introduction ··· 12
Methods ··· 14
Discussion ··· 22
Tables and Figures ··· 27
CHAPTER 4. SOCIODEMOGRAPHIC DISPARITY IN THE DIET QUALITY TRANSITION AMONG CHINESE ADULTS, 1991 TO 2011 ··· 38
Overview ··· 38
Introduction ··· 39
Methods ··· 40
Results ··· 44
Discussion ··· 47
Tables and Figures ··· 52
CHAPTER 5.THE IMPACT OF FIFTEEN-YEAR TRENDS IN DIET QUALITY ON DIABETES PREVALENCE AMONG ADULTS IN CHINA ··· 63
Overview ··· 63
Introduction ··· 64
Methods ··· 66
Results ··· 71
Discussion ··· 73
Tables and Figures ··· 77
CHAPTER 6. SYNTHESIS ··· 87
Overview of Findings ··· 87
Limitations ··· 90
Strengths ··· 93
Significance and Public Health Impact ··· 95
Future Directions ··· 96
LIST OF TABLES
Table 3.1. Components of the CDQI and scoring methods according to
the CDG and CFGP ··· 27
Table 3.2. Tailoring method of the Harvard AHEI-2010 ··· 28
Table 3.3. Baseline Characteristics of participants according to sex-specific
quintiles of the CDQI scores, CHNS ··· 29
Table 3.4. Baseline Characteristics of participants according to sex-specific
quintiles of the tAHEI scores, CHNS ··· 31
Table 3.5. OR (95% CI) of prevalence of CM risk factors across the quintiles
of the CDQI and tAHEI scores in Chinese men, respectively, CHNS ··· 33
Table 3.6. OR (95% CI) of prevalence of CM risk factors across the quintiles of the
CDQI and tAHEI scores in Chinese women, respectively, CHNS ··· 34
Supplemental Table 3.1. Energy-level food intake recommended by the
2007 Chinese Dietary Guidelines ··· 35
Supplemental Table 3.2. Nutrient composition according to sex-specific quintiles
of the CDQI and tAHEI scores, respectively, CHNS ··· 36
Table 4.1. Components and scaling methods of tAHEI ··· 52
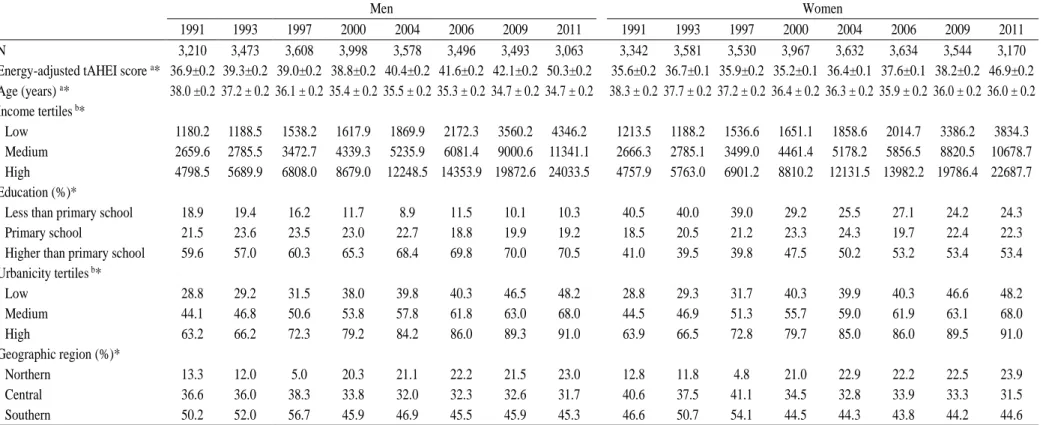
Table 4.2. Cross-sectional characteristics of the study sample in
the CHNS, 1991–2011 ··· 53
Table 4.3. Quantile regression results for 25th, 50th, 75th, 85th, and 95th
percentiles versus mixed-effect regression results in Chinese men ··· 54
Table 4.4. Quantile regression results for 25th, 50th, 75th, 85th, and 95th
percentiles versus mixed-effect regression results in Chinese women ··· 55
Table 4.5. Predicted tAHEI score by demographic and socioeconomic factors,
CHNS, 1991-2011 ··· 56
Supplemental Table 4.1. Distribution and mean (95% CI) of the unadjusted tAHEI scores among adult men and women
in the CHNS, 1991–2011 ··· 58
Table 5.1. Components and scaling methods of tAHEI ··· 77
Table 5.2. Components scores of the study population by levels of baseline tAHEI scores and levels of annual changes
in tAHEI score, CHNS ··· 79
Table 5.3. Demographic characteristics of the study population
Table 5.4. Diabetes and insulin markers in 2009 by levels of
baseline tAHEI score, CHNS ··· 81
Table 5.5. Association between levels of baseline score and
logarithm fasting glucose, HbA1c, insulin and HOMA-IR
in 2009 in Chinese adults ··· 82
Table 5.6. Association between levels of annual changes in tAHEI
scores and logarithm fasting glucose, HbA1c, insulin and HOMA-IR
in 2009 in Chinese adults ··· 83
Table 5.7. Association (OR and 95%CI) between baseline tAHEI scores or annual change of tAHEI scores and diabetes
LIST OF FIGURES
Figure 4.1. Shifts in distribution of the crude tAHEI scores among men (a)
and women (b), CHNS, 1991–2011 ··· 59
Figure 4.2. Estimated shifts in covariate-adjusted tAHEI component score among
men (a) and women (b) in China, CHNS, 1991–2011 ··· 60
Figure 4.3. Predicted tAHEI score across demographic and socioeconomic
LIST OF ABBREVIATIONS AND SYMBOLS
AHEI Alternative healthy eating index
BMI Body Mass Index
CDG Chinese dietary guidelines
CM Cardiometabolic
CVD Cardiovascular diseases
CHNS China Health and Nutrition Survey
CI confidence interval
DG Dietary guidelines
DGA Dietary guidelines for American
DGC Dietary guidelines for Chinese
DHA docosahexenoic acid
DQI Diet Quality Index
EPA eicosapntemacnioc acid
FCT food composition table
FFQ Food Frequency Questionnaires
FNDDS Food and Nutrient Database for Dietary Studies
HbA1c Hemoglobin A1c
HDL High-density Lipoprotein
HEI Healthy eating index
HEP Healthy Eating Pyramid
HOMA-IR Homeostasis Model of Insulin Resistance
LDL-C low-density lipoprotein cholesterol
NIH National Institutes of Health
NNDSR National Nutrient Database for Standard Reference
PA physical activity
PUFA polyunsaturated fatty acid
SES socioeconomic status
SSB sugar-sweetened beverage
TG Triglyceride
tAHEI tailored Alternative Healthy Eating Index
UNC-CH University of North Carolina at Chapel Hill
CHAPTER 1: INTRODUCTION Background
The rising epidemic of obesity, diabetes and associated cardiometabolic (CM) risks have
been public health concerns worldwide in the past decades. This is especially pertinent for
Asian countries given that these settings have faced very rapid socioeconomic and nutrition
transitions and Asians tend to have higher CM risks at lower BMI level and at younger ages
relative to the Western populations. It was shown that approximately 85% of Chinese adults
aged 40 years and older, and 33.2% of non-overweight Chinese adults had high levels of at
least one CM risk factor in 2009. The prevalence of diabetes in Chinese adults was 0.67% in
1984, 2.5% in 1994, and 9.7% in 2010 among adults in China. The diabetes mortality and
disability adjusted life years between 1990 and 2000 increased by 45.0% and 10.3%,
respectively. To curb the rising epidemic and disease burden, effective actions call for
evidence-informed, scientifically evaluated strategies and policies.
Diet has been playing a key role in preventing chronic diseased epidemics. Index-based
diet quality approach is a useful way to capture the complex interplay of dietary constituents
and fully investigate the overall diet - disease relationship. Many studies have shown that
Alternative Healthy Eating Index-2010 (AHEI-2010), created based on Harvard Healthy
Eating Pyramid (HEP), has the potentially beneficial effect of lowering risk of obesity,
dyslipidemia, diabetes, some cancer and mortality in many Western populations. However, it
remains unclear whether diet consistent with Harvard HEP plays similarly important role in
curbing disease epidemic in Asian population.
Chinese diet consumption has been characterized by a rapid decline in intake of coarse
decades. It is unknown how Chinese diet quality changed as a whole over time. Although
China issued Chinese dietary guidelines (CDG) in 2007, there is lack of an index based on its
diet recommendation to assess overall diet quality. Moreover, it deserves concerns of
potentially different health benefits due to many difference in the basis and recommendations
between Harvard HEP and CGG. We proposed to evaluate average index-based diet quality
transition, identify heterogeneous trajectories of diet quality, and related change patterns of
diet quality to major CM risks in Chinese population.
We used longitudinal data from the China Health and Nutrition Survey (CHNS). This
survey covers a wide range of high-quality longitudinal data including diet, sociodemographic
factors, anthropometrics, blood pressure, physical activity and smoking status between 1991
and 2011, as well as biomarker data obtained from fasting blood samples collected in 2009.
Thus, CHNS offers a unique opportunity to understand long-term diet quality transition and
the association between overall diet quality and the risk of diabetes and CM risks among
Chinese population.
Research Aims
Aim 1: Examine the association between diet quality in 2006 and prevalence of diabetes and major CM risks in 2009 in Chinese adults.
1a. Construct China dietary quality index (CDQI) based on diet-related recommendations of the 2007 Chinese dietary guidelines (CDG) and tailor the AHEI-2010 (named as tAHEI)
to match Chinese diet.
1b. Evaluate the association between each score (CDQI and tAHEI score) in 2006 and prevalence of diabetes and major CM risks over 3 y of follow-up including hemoglobin
A1c (HbA1c), blood pressure, and plasma lipids using mixed-effect random intercept
linear and logistic regression analysis.
CM risks among Chinese adults. The tAHEI would be a better predictor of health outcomes,
while CDG is Chinese-specific guidelines.
Aim 2: Investigate secular trends in diet quality and potential sociodemographic disparity from 1991 to 2011 in the Chinese adults using the tAHEI score to assess diet quality in Chinese adults.
We first used LMS method [the L curve (Yeo-Johnson to remove skewness), M curve
(median) and S curve (coefficient of variation)] to present gender-specific distribution
characteristics of overall diet quality assessed by the tAHEI score. Then we performed
longitudinal quantile regression models to investigate shifts in tAHEI scores at different
percentiles in comparison with average secular trend of diet quality. Finally, we used
mixed-effect linear random intercept regression to evaluate sociodemographic disparity in average
diet quality transition by considering potentially significant effect modification measure and
predicted sociodemographic specific tAHEI scores.
We hypothesized that the tAHEI score of Chinese adults would show non-linear
increasing trends with increased proportion of adults had higher scores and differential rate of
increase across the percentiles over time. Moreover, we hypothesized diet quality transition
would vary significantly across sociodemographic groups and the gaps in diet quality
between northern and southern adults would become widened over 20-year period.
Aim 3: Examine the impact of fifteen-year trends in diet quality from 1991 to 2006 on Diabetes Prevalence in 2009 among adults.
3a. Examine the association between baseline diet quality and diabetes-related biomarkers including fasting glucose, HbA1c, insulin, homeostasis model of insulin resistance
(HOMA-IR) and diabetes prevalence.
were independently associated with lower diabetes-related biomarkers and lower prevalence
CHAPTER 2: LITERATURE REVIEW
The rising epidemics and burden of chronic disease in China
The rising epidemic of obesity, diabetes and associated cardiometabolic (CM) risks have
been public health concern worldwide 1. This is especially pertinent for Asian countries given
that these settings have faced more drastic socioeconomic and nutrition transitions 2-4 and
Asians tend to pose higher CM risks at lower BMI level 5 and at younger ages relative to
western populations 6. It was shown that approximately 42% of Chinese children, 85% of
Chinese adults aged 40 years and older 7, 33.2% of non-overweight Chinese adults had high
levels of at least one CM risk factor in 2009 8. The prevalence of diabetes in Chinese adults
was 0.67% in 1984, 2.5% in 1994, and 9.7% in 2010 among adults in China. The diabetes
mortality and disability adjusted life years between 1990 and 2000 increased by 45.0% and
10.3%, respectively. To curb the rising epidemic and expanding burden of obesity and related
CM risks in China, effective actions call for evidence-informed, scientifically evaluated
strategies and policies. 4, 9
Rapid shifts in Chinese food consumption call for a way to capture multidimensional complexity of diet as a whole
Over the past two decades, China has experienced marked shifts in diet 10, 11 and PA 12, 13
along with its rapid economic growth and social changes and the concurrent shifts in disease
patterns11. Chinese food consumption has been characterized as rapid declines in intake of
coarse grains, vegetables, and legumes and increases in intake of edible oils and
food consumed in China. 10, 15 Considering the multiple dimensions of the changes in the
Chinese diet, the key issue is how to capture the dynamic complexity as a whole.
Index-based dietary patterns approach: an alternative way to fully investigate the overall diet - disease relationship
Recently, dietary patterns approach have gained extensive attention give its advantage of
capturing the overall complexity of the diet, interaction or highly correlated nature of dietary
consituents as oppossed to single nutrients, foods or food groups analysis. 16-21 Two common
approaches are used to describe dietary patterns: a posteriori using data-driven methods and a
priori using theory-defined methods. 9, 17, 19, 22Although data-driven dietary patterns have the
strengths of being related to actual dietary practices, they may not necessarily represent
‘healthy diet’ and their sample-specificity and lack of stability make it difficult to compare
results across the studies. 18, 20, 21 In contrast, diet index-based dietary patterns are developed
from current healthy dietary recommendations that allow for standardization of the scores and
comparability of results across studies from different populations.20 From the perspective of
public health, governments, many scholars and others prefer ‘healthy’ dietary guidelines to
enhance the overall diet quality by promoting directly eating certain ‘healthier’ foods and
reducing consumption of selected ‘bad or unhealthful’ foods 23.
Why use the Althernative Healthy Eating Index-2010 to access Chinese diet quality?
Healthy Eating Pyramid (HEP) that was developed by the Harvard School of Public
Health in 2005. 24 This Harvard guidance recommends using refined grains and red meat
sparingly, emphasizes type of fat, multivitamin use, healthy oils and healthy protein like fish,
beans or nuts, separates potatoes and French fries from vegetables, avoids sugar drinks and
limits milk and dairy24, 25. Harvard HEP was suggested as most popular healthy
recommendations by some researchers represent given its best available basis of global
The Alternative Healthy Eating Index (AHEI)26 and the most recent version of the
AHEI-2010 27 were developed from the recommendations of the Harvard HEP. The
AHEI-2010 incorporated current scientific evidence on diet and health27. Compared with the AHEI,
the AHEI-2010 add the components of sugar sweetened beverages and fruit juice and sodium,
use two single components red/processed meat and long-chain fats instead of the ratio of
white to red meat, whole grain instead of cereal fiber, percent of energy intake from PUFA
instead of the ratio of polyunsaturated to saturate fat and delete duration of multivitamin use
27.
Previous studies from the Nurses’ Health Study (NHS) and Healthy Professional’s
Follow-up Study (HPFS) indicated that the original AHEI was nearly twice as predictive of
overall chronic disease risks than was the original HEI in US adults 28-31 and was also
associated with decreased risk of type 2 diabetes32. However, there may be a potential
problem that some components of the original AHEI and the AHEI-2010, such as nuts,
vegetable, fruit, cereal and alcohol consumption, were on the basis of diet-disease
relationships in the same cohorts. With regard to this point, several studies have confirmed
the health effect of the AHEI in other populations. The other two studies in the British
population of the Whitehall II prospective cohort study suggested significant association of
the AHEI score with higher odds of reversal of the Metabolic syndrome, 33 and reduced risk
of mortality. 34 Also, the AHEI-2010 showed better prediction of chronic disease risk than
several other indices assessing adherence to the 2005 Dietary Guidelines for American in US
population, such as the HEI-2005. 27, 35 One recent Meta-analysis of cohort studies in US,
England and Europe population indicated that diets that score highly on the HEI, AHEI, and
DASH are associated with a significant reduction in the risk of all-cause mortality,
cardiovascular disease, cancer, and type 2 diabetes mellitus by 22%, 22%, 15%, and 22%,
chronic disease in many Western populations. However, it remains unclear whether the
Harvard HEP plays similarly health benefits in Asian population. One recent study showed
negative association of the AHEI-2010 with hip fracture among Singapore Chinese. 37
Concerns about the discrepancy between Chinese dietary guidelines and Harvard HEP
China has its own food-based Chinese dietary guidelines (CDG). The latest version was
released in 2007 with emphasis on promoting balanced diet. 38 There are a couple of
differences between CDG and Harvard HEP: the focus of chronic diseases prevention in
Harvard HEP versus the fight for double burden of under- and over-nutrition in most Asian
DGs; food-and nutrient-based Harvard HEP versus food-based Asian DGs; the basis of strong
global evidence of diet-chronic disease association from large-scale prospective studies for
Harvard HEP versus the basis of local dietary practices, nutritional status and general sense
about healthy diet for Asian DGs. Given better predictive of disease risk for AHEI-2010 or
AHEI than other indices due to inclusion of fat and carbohydrate subtypes5,27, potentially
diffential health effect of adherence to both guidance warrants further study.
Advanced statistical methods to evaluate longitudinal trends in overall diet quality in depth
Traditional linear regression requires independence with observations. However,
longitudinal repeated data violate this assumption given the correlation and dependence
across multiple measurement of diet for each subject. In contrast, mixed-effect linear or
logistic regression had the advantages of handing repeated measure, relaxing the assumption
of observation independence, dealing with unbalanced data, and controlling for the
Why use China Health and Nutrition Survey (CHNS)?
The CHNS is an over 20-year longitudinal study and designed to examine how the social
and economic transformation in China is affecting the health and nutritional status of its
population (Popkin et al. 2009). The CHNS, initiated in 1989, has been completed in nine
rounds (1989, 1991, 1993, 1997, 2000, 2004, 2006, 2009 and 2011).
The CHNS used a multistage, random cluster process to draw the sample from the nine
provinces of Heilongjiang (enrolled in 1997), Liaoning (not surveyed in 1997), Shandong,
Henan, Jiangsu, Hubei, Hunan, Guizhou, and Guangxi. The provinces vary substantially in
geography and economic development. Counties and cities in each province were stratified
by income and a weighted sampling scheme was used to randomly select four counties and
two cities (provincial capital and a lower income city) in each province. Villages/townships
within the counties and urban/suburban neighborhoods within the cities were selected
randomly as the primary sampling units. In each type of community, 20 households were
randomly selected and all individuals in each household were surveyed for all data in each
wave40.
China provides a valuable basis of evaluating health benefit of adherence to Asian
FBDG. The CHNS can capture the rapid sociodemographic, environmental and nutritional
transition that characterized Asian societies in the most recent decades41. It also offer a unique
opportunity to examine the efficacy of adherence to Harvard HEP and CDG in predicting CM
risks in depth.
The dietary intake information in the CHNS at each wave combined the individual
dietary intake collected by interview-administrated consecutive three-day 24-hour dietary
recalls, food frequency questionnaires on soft drink and alcohol consumption in the past year,
accurate foods consumption data and decrease intra-individual variation 42and perform
particularly well to evaluate usual diet intake based validation studies from the CHNS43, 44.
Therefore, diet data of the CHNS are very powerful to study Chinese long-term diet quality
transition and evaluate diet-disease relationship.
The CHNS has measured outcome data with good quality control. Repeatedly measured
anthropometric data and blood pressure avoid reporting bias of self-reported data45-47. The
lipid- and diabetes-biomarker data from the 2009 fasting blood sample allow us to evaluate
the association between dietary quality, continuous lipid profiles and dyslipidemia, and
continuous diabetes-markers and diabetes risk, which is of important implications given
dyslipidemia and diabetes thought as independent risk factors of CVD. Moreover, rich
time-varying covariates including sociodemographic factors, physical activity, smoking status, and
community urbanization contribute to good control for potential confounding and allow us
CHAPTER 3:DIET QUALITY AND THE PREVALENCE OF DIABETES AND MAJOR CARDIOMETABOLIC RISK FACTORS AMONG ADULTS IN CHINA Overview
Adherence to the Harvard indexes, the Alternate Healthy Eating Index (AHEI) and the most recent version AHEI-2010 have been inversely associated with risk of diabetes,
cardiovascular disease, cancer and related mortality in the US, England, and Europe
population. It remains unclear whether these associations are generalized to Asian population.
Besides, there is lack of the 2007 Chinese dietary guidelines (CDG)-based index to measure
Chinese diet quality and related association with disease risk. We developed China dietary
quality index (CDQI) from the diet recommendations of the 2007 CDG and tailored the
AHEI-2010 to match Chinese diet (named as tAHEI). Then we examined the association
between Chinese diet quality as assessed by the CDQI and tAHEI score with prevalence of
diabetes and major CM risk over 3 y of follow-up (2006-2009) among adults in China.
Participants aged 18 to 65 (n=4440) from the longitudinal China Health and Nutrition Survey (CHNS) with food consumption data from three consecutive 24-hour dietary recalls were
used to calculate adherence to both the tAHEI and CDQI. Multivariable logistic regressions
were performed to analyze the associations of each index score in 2006 with the prevalence
of diabetes and major CM risk factors in 2009. The baseline median CDQI scores and tAHEI
scores for both sexes were lower than 50.0 points, reflecting relatively poor dietary quality.
After adjustment for potential confounders, participants in the top compared with the bottom
quintile of the tAHEI scores showed 36% lower prevalence of high low-density lipoprotein
cholesterol (LDL-C) [odds ratio (OR): 0.64; 95% CI: 0.46, 0.90] in men and 33% lower
lower prevalence of high LDL-C in the top versus bottom quintile (OR: 0.65; 95% CI: 0.46,
0.92) in men only. Further, the CDQI scores indicated 55% lower prevalence of diabetes in
the top versus bottom quintile (OR: 0.45; 95% CI: 0.23, 0.87) in men only, whereas a null
association was observed for the tAHEI scores for both sexes. Higher CDQI score was
associated with 51% higher prevalence of elevated triacylglycerol (TAG) in the top versus
bottom quintile in women only. These suggest that diet quality that highly scored by the
CDQI and tAHEI showed similarly negative association with high LDL-C prevalence,
whereas only the CDQI score was negatively related to diabetes prevalence in men but
positively associated with elevated TAG prevalence in women.
Introduction
The rising epidemic of obesity, diabetes and associated cardiometabolic (CM) risks have
been public health concerns worldwide in the past decade 1. This is especially pertinent for
Asian countries given that these settings have faced very rapid socioeconomic and nutrition
transitions 2, 3, 48, 49 and Asians tend to have higher CM risks at lower BMI level 5 and at
younger ages relative to the Western populations 6. It was shown that approximately 85% of
Chinese adults aged 40 years and older 50, and 33.2% of non-overweight Chinese adults had
high levels of at least one CM risk factor in 2009 8.
Chinese diet consumption has been characterized by a rapid decline in intake of coarse
grains and increases in intake of edible oils, and animal-source foods over the past two
decades10. Many studies have suggested that dietary patterns approach is a good way to capture the overall complexity of the diet as well as to examine health effect of diet quality as
oppossed to using single nutrients, foods or food groups 16-20. Furthmore, diet index-based
dietary patterns are developed from current healthy dietary recommendations that allow for
standardization of the scores and comparability of results across studies from different
Harvard Healthy Eating Pyramid (HEP) is the most popular healthier diet guidance
given its best available basis of globally scientific evidence on diet-disease relationship24, 25,
51. The Alternative Healthy Eating Index (AHEI) 26 and the most recent version of the
AHEI-2010 27 were developed from the recommendations of the Harvard HEP. Previous studies
from the Nurses’ Health Study (NHS) and Healthy Professional’s Follow-up Study (HPFS)
indicated that the original AHEI was nearly twice as predictive of overall chronic disease
risks than was the original HEI in US adults 28-31 and was also associated with decreased risk
of type 2 diabetes32. The other two studies in the British population of the Whitehall II
prospective cohort study suggested significant association of the AHEI score with higher
odds of reversal of the Metabolic syndrome 33, and reduced risk of mortality 34. Also, the
AHEI-2010 showed better prediction of chronic disease risk than several other indices like
the HEI-2005 assessing adherence to the 2005 Dietary Guidelines for American in US
population27, 35. One recent Meta-analysis of cohort studies in US, England and Europe
population indicated that diets that score highly on the HEI, AHEI, and DASH are associated
with a significant reduction in the risk of all-cause mortality, cardiovascular disease, cancer,
and type 2 diabetes mellitus by 22%, 22%, 15%, and 22%, respectively36. These findings
suggested the key role of the Harvard HEP in combating major chronic disease in many
Western populations; however, it remains unclear whether the Harvard HEP plays similarly
important role in Asian population.
China has its own food-based Chinese dietary guidelines (CDG). The latest version was
released in 2007 with emphasis on promoting balanced diet 52. Given its basis of Chinese diet
practice, the diet recommendations from CDG may be Chinese-specific and adherence to
CDG may have the potential health benefit in preventing chronic disease. However, the basis
of general sense on healthy diet rather than Chinese-specific diet-disease relationship
2007 CDG and little is known about its association with CM risk in Chinese adults.
The present study was to construct China dietary quality index (CDQI) from the diet
recommendations of the 2007 CDG and to tailor the AHEI-2010 to match Chinese diet
(named as tAHEI). Then we examined the association between diet quality as assessed by the
CDQI and tAHEI score in 2006 with prevalence of type 2 diabetes, prediabetes, elevated
blood pressure (BP), and lipid-related CM risk in 2009 among Chinese adults aged 18 to 65
across 3 years of the China Health and Nutrition Survey (CHNS).
Methods
Study Population
All data used in this study were derived from the China Health and Nutrition Survey
(CHNS), an ongoing longitudinal study. The CHNS was initiated in 1989, with a focus on
assessing the relationships between the social and economic transformation in China and the
resulting effects on the health and nutritional status of the Chinese population49, 53. The
CHNS used a multistage, random cluster process to draw the sample from the original eight
provinces, and communities were selected randomly as the primary sampling units. In each
type of community, 20 households were randomly selected and all individuals in each
household were surveyed for all data in each wave. The sampling procedure has been
described in detail elsewhere10, 53. The CHNS have been completed in nine rounds (1989,
1991, 1993, 1997, 2000, 2004, 2006, 2009 and 2011). Fasting blood samples were collected
for the first time in 2009.
Our analysis linked the dietary intake and covariates measured in 2006 with CM risk
measured in 2009. Of 5,089 eligible subjects aged 18 to 65 who had complete diet data in
2006 and CM risk factor data in 2009, we excluded those having implausible energy intakes
kcal for women), pregnant or lactating women (n=70), and those having missing covariates
(n=102), those previously diagnosed by a doctor with diabetes, stroke, and myocardial
infarction (n=88), and those having missing BMI or waist circumference (WC; n=351). Our
final sample consists of 4,440 participants (2,062 males; 2,378 females).
The protocol of the survey was approved by the institutional review committees of the
University of North Carolina at Chapel Hill and the National Institute of Nutrition and Food
Safety, Chinese Center for Disease Control and Prevention. All subjects gave written
informed consent for their participation in the protocols.
Dietary Measurement
Dietary intake was assessed in 2006 using three consecutive 24-hour recalls for each
individual, combined with a household weighing inventory of all available foods over the
same period. The detailed diet data collection has been described elsewhere10, 49, 54. We linked
dietary intake data to the China Food Composition Table (FCT) 55. We additionally linked all
Chinese foods to the USDA Food and Nutrient Database for Dietary Studies (FNDDS) 56 and
National Nutrient Database for Standard Reference 57 to estimate fatty acid composition
which is unavailable from the China FCT. We used the 3-day average intake of total energy
intake (TEI), nutrients, and food/food groups to calculate the CDQI and AHEI scores in the
analyses.
Construction of the CDQI
The Chinese Dietary Guidelines (CDG), food-based national policy released in 2007,
aim to prevent both under-nutrition and chronic diseases 38, 52. This guidance provides ten
items of qualitative recommendations covering diet, physical activity (PA), alcohol use,
healthy weight, and food safety. Chinese Food Guide Pagoda (CFGP) represents six
foods 38. We referred to Chinese Dietary Recommendation Intake (CDRI)58 to determine
age-sex-specific energy requirement and related food intake recommendations for adults
(Supplement Table 3.1).
To investigate the independent association between diet composition and each CM risk
factor, we developed the CDQI based on only diet-related recommendations. The components
of the CDQI along with criteria for maximum and minimum scores and formula used to
calculate intermediate scores are presented in Table 3.1. Briefly, the CDQI consists of six
adequacy components [coarse grains, total vegetables (include proportion of dark-color
vegetables), fruits, nuts/soybeans/products, milk and products, and seafood] and four
moderate components (red meat and poultry, edible oil, salt and alcohol consumption). Each
component is scored on a continuous scale from 0 to 10. Therefore, the total CDQI score has
a possible range of 0-100, with higher score indicating better compliance with the dietary
guidelines. We used the following equation to calculate the intermediate score of each
component.
For adequacy components: component score = (Maximum score / (Amax-Amin))*(X-Amin);
For moderate components: component score = Maximum score - maximum score / (Amax
-Amin))*(X-Amin);
Amax is maximum amount of the component corresponding to recommended intake.
Amin is minimum amount of the component corresponding to recommended intake;
X: amount of each food group consumed by the individual.
Tailoring of the Harvard AHEI-2010 to match Chinese diet data
We tailored the Harvard AHEI-2010, developed from best and latest global evidence on food-
and nutrient-disease relationships27, to match our diet data and we named it as tAHEI. The
detailed methods were shown in Table 3.2. Major tailoring includes: (1) for several foods
and sugar-sweetened beverages (SSB) and fruit juice, we changed servings-unit into
grams-unit to scale these components; (2) we estimated usual intakes of alcohol and sugar
sweetened beverage (SSB) from a food frequency questionnaire over the past year to reduce
the potential underestimation of 24 h recall due to episodically consumption; (3) Given that
Chinese whole grain intakes, defined as carbohydrate to fiber ≤ 10:1 59 in the Harvard
AHEI-2010, were extremely low and lack of variation, we replaced it with cereal fiber component
which was chosen to develop the Harvard AHEI in 2002 by McCullough et al.30; (4) we
scaled only fresh red meat intake to increase the variation given that Chinese processed red
meat intake is extremely low (about 3.1% of total meat) and few adults consumed processed
meat higher than 64g 60; (5) we use the past year FFQ of alcohol consumption and change
grams of each type of alcohol (beer, wine and liquor) into oz and then calculated total number
of drinks accounting for different portion size of alcohol subtypes; (6) we omitted trans fat
component in the tAHEI given a lack of information on trans fat composition of all eaten
food in both China and USDA FCT. Due to the omission of trans fat component, the tAHEI
score ranged from 0 to 100, with higher score indicating better compliance with the dietary
guidelines.
Assessment of CM risk factors
In the 2009 CHNS, overnight fasting blood samples were collected with venipuncture by
trained experienced physicians, phlebotomist or nurses. Plasma and serum samples were then
frozen, and stored at -86°C for later laboratory analysis. All samples were analyzed in a
national central lab in Beijing with strict quality control. Laboratory analysis methods for the
CM biomarkers are described in detail elsewhere48.
Three BP measurements were taken in a seated position after at least 5 min of rest in a
followed a standardized procedure using regularly calibrated mercury sphygmomanometers.
Participants were advised to avoid cigarette smoking, alcohol, caffeinated beverages and
exercise for at least 30 min before the measurement. Systolic blood pressure (SBP) was
measured at the first appearance of a pulse sound (Korotkoff phase 1) and diastolic blood
pressure (DBP) at the disappearance of the pulse sound (Korotkoff phase 5)61.
We focused on elevated BP, impaired Hemoglobin A1c (HbA1c) and lipids-related risk
factors. We used International Diabetes Federation definitions 62 for elevated BP in adults (the
mean of SBP ≥130 or the mean of DBP ≥85 or taking anti-hypertension medication) , for
combined prediabetes and diabetes (HbA1c ≥5.6%, ), diabetes (HbA1c ≥6.5%), lipid-related
risk factors including elevated triacylglycerol (TAG >150 mg/dl), high low-density
lipoprotein cholesterol (LDL-C > 130 mg/dl), low high-density lipoprotein cholesterol
(HDL-C<40 mg/dl for men, < 50mg/dl for women). We choose HbA1c as indicator of glucose
control to capture long-term glycemic exposure in Chinese population63, 64.
Assessment of Covariates
Trained interviewers used standard questionnaires to collect information on annual
family income, individual education level, physical activity, smoking status and community
information. We categorized baseline age to 18- <35 years, 35- <50 years, 50-<65 years. We
calculated per capita annual family income by dividing annual family income by household
size, categorized by tertiles. We divided individual education level as less than primary
school, complete primary school and higher than primary school.
The community urbanicity index, a complex measure of urbanization, is based on 12
multidimensional components reflecting the heterogeneity in economic, social, demographic,
and infrastructural changes at the community level65. We categorized continuous urbanicity
southern provinces, due to different dietary intake shown in previous studies66, 67 .
Physical activity (PA) includes four domains: occupational, household chore, leisure
time, and transportation activities. All activities were reported in average hours per week
during the past year.13 We converted time spent in each activity into metabolic equivalent of
task (MET) hours per week based on the Compendium of Physical Activities68. The MET
hours per week measurement accounts for both the average intensity of each activity and the
time spent in each activity. We categorized total MET hours per week into tertiles (light,
moderate, and heavy).
We also considered smoking status (dichotomized as 1 = current smoker and 0 = former
or never smoker), baseline BMI, baseline waist circumference, and TEI as potential
confounders.
Statistical Analysis
All analyses were performed separately for men and women. We categorized all
participants into quintiles of baseline CDQI and tAHEI scores by gender, respectively, to
examine the association of different levels of adherence to each score with each CM risk. We
presented the median value and its range of each quintile of each score and used Wilcoxon
rank sum for significance test of gender difference. For baseline characteristics of the
participants, we used chi-square tests for categorical variables and general linear regression
for continuous variables to test differences and trends across quintiles of the CDQI and
tAHEI scores, respectively. We also calculated gender-specific Pearson’s correlation
coefficient between the two scores and did contingence table of quintiles of the CDQI score
by quintiles of the tAHEI score to see how differently the participants were classified by
them.
association of adherence to the CDQI and the tAHEI with each CM risk factor, adjusting for
all potential confounders and accounting for the clustering at the community level in the
estimation of variation using the cluster option in regression analyses. We also tested linear
trends by assigning median values to quintiles of the CDQI or tAHEI score and modeled this
variable as a continuous term.
We conducted all statistical analyses using SAS version 9.2 (SAS Institute Inc., NC) and
Stata version 12.0 (StataCorp., TX). All statistical tests were two-tailed and considered
significant at P < 0.05.
Results
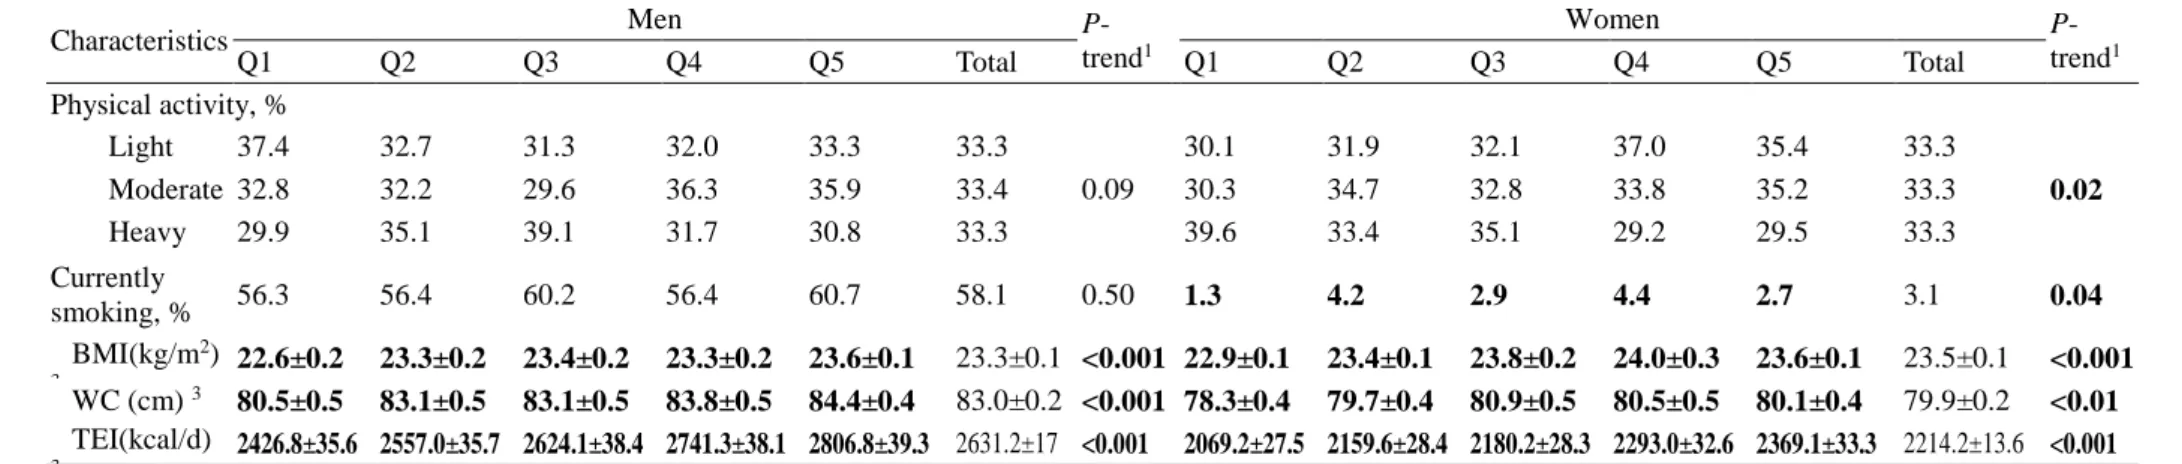
Baseline Characteristics
The baseline characteristics of participants across the quintiles of the CDQI and tAHEI
score by gender are summarized in Table 3.3 and 3.4. The baseline median CDQI scores of
men (38.5; range: 5.7, 82.1) was significantly lower than that of women (42.8; range: 8.1,
84.9) (p<0.0001), whereas the baseline median tAHEI scores of men (49.4; range: 13.0, 78.5)
was higher than that of women (45.2; range: 12.1, 74.2) (p<0.0001). Both median scores are
lower than 50 points, reflecting worse adherence in general.
The Pearson correlation between the CDQI and tAHEI scores was 0.48 (P<0.0001) in
men and 0.56 (P<0.0001) in women. As categorized into quintiles of the CDQI and the tAHEI
scores, about 31.1% of men and 35.2% of women were classified in the same quintiles (data
not shown here).
Men and women in higher quintiles of the CDQI scores tended to live in Northern
provinces and have lower daily TEI. Besides, there was higher proportion of women in the
30.7%), had light physical activity (41.5% vs. 30.7%) and lived in highly urbanized
community (38.3% vs. 31.4%)(Table 3.3).
In contrast, men and women in higher quintiles of the tAHEI scores tended to live in
Northern provinces but have higher daily TEI. Besides, in the top compared with bottom
quintile of the tAHEI scores, there was higher proportion of men who had high income (42.0%
vs. 29.1%) and had higher BMI and waist circumference and higher proportion of women who
had high income (41.7% vs. 28.0), lived in highly urbanized community (41.3% vs. 29.3%),
had light physical activity (35.4% vs. 30.1%) and had higher BMI and waist circumference
(Table 3.4).
Comparison of nutrient composition across the quintiles of the CDQI and tAHEI scores
As shown in supplement Table 3.2, most nutrients are significantly associated with both
scores, except the intakes of cholesterol and vitamin A in men for the CDQI score and the
intakes of vitamin A, vitamin C, vitamin E (women only) and selenium with the tAHEI score.
In men, higher CDQI score was associated with lower intakes of TEI, fat and sodium but
with higher intakes of carotene and calcium, whereas higher tAHEI score was associated with
higher intakes of TEI, fat, fiber, protein, vitamin E, potassium, calcium, iron, zinc and
phosphorus.
In women, higher CDQI score was associated with lower intakes of TEI, fat and sodium
but with higher intakes of fiber, vitamin C, potassium , calcium, iron, and phosphorus,
whereas higher tAHEI score was associated with higher intakes of TEI, fiber, cholesterol,
protein, potassium, calcium, iron, zinc and phosphorus.
In addition, the gap in sodium intake in the top compared the bottom quintile was much
wider for the CDQI scores than for the tAHEI scores (3000mg vs. 500mg) as opposed to
much wider gaps for the tAHEI scores than for the CDQI scores in the intakes of vitamin E
vs. 0.4mg) and selenium (17.7mg vs. 5.4mg) ) in adult men. Similar results were also found
in adult women.
Associations of the CDQI and tAHEI scores with selected CM risk factors
Table 3.5 shows the ORs of diabetes and major CM risk factors according to quintiles of the CDQI and tAHEI scores in Chinese men. After adjustment for all potential confounders,
adult men in the top compared with the bottom quintile of the CDQI score showed 55% lower
prevalence of diabetes [odds ratio (OR): 0.45, 95% CI: 0.23–0.87], whereas the tAHEI score
was not associated with diabetes prevalence significantly. The two indices were negatively
associated with prevalence of high LDL-C to a similar extent (OR for CDQI: 0.65, 95% CI:
0.46–0.92; p-trend <0.01; OR for the tAHEI: 0.64; 95% CI: 0.46–0.90; p-trend <0.01).
After adjustment for all potential confounders, women in the top compared with the
bottom quintile of the tAHEI score showed 33% lower prevalence of high LDL-C (OR: 0.67;
95% CI: 0.49–0.91), while women comparing extreme quintile of the CDQI score showed
51% higher prevalence of elevated TAG (OR: 1.51, 95% CI: 1.08–2.11), although none of
linear trend tests were statistically significant. Null associations of both scores were observed
with the prevalence of diabetes, prediabetes and diabetes, low HDL-C, and elevated BP in
women (Table 3.6).
All regression models for both CDQI and tAHEI scores were also performed adjusting
additionally for baseline BMI and waist circumference, respectively, and conclusion from the
results were not changed (data not shown).
Discussion
In this study we developed an a priori-defined diet index based on the diet-related
recommendations of the 2007 Chinese dietary guidelines and simultaneously investigated
Chinese diet quality as assessed by the CDQI and the tAHEI with the prevalence of type 2
were classified into the same quintiles of both index. The 2 indices reflected different nutrient
profiles to some extent, especially in terms of TEI, fat, percentage of energy from fat, and
some vitamins and minerals. Moreover, our study indicated that better adherence to the CDQI
scores was associated with a 55% lower prevalence of diabetes in Chinese men only, whereas
the tAHEI scores were not associated with diabetes prevalence in either gender. As for
lipids-related CM risks, higher CDQI score was lipids-related to about one third lower prevalence of high
LDL-C risk in men but higher prevalence of elevated TAG in women, whereas the tAHEI
score shows negative association with high LDL-C prevalence in men and women. Besides,
null associations were observed for the two indices and the prevalence of elevated BP,
prediabetes and diabetes together, and high HDL-C.
A previous study indicated a 31% and 33% lower risk of CHD and diabetes related to
higher AHEI-2010 scores in the Nurses’ Health and Health Professionals Follow-up cohorts27,
32. One recent Meta-analysis of cohort studies in US, England and Europe population
indicated that diets that score highly on the HEI, AHEI, and DASH are associated with a
significant reduction in the risk of type 2 diabetes mellitus by 22%36. However, our results do
not indicate consistent findings related to tAHEI in China population. There are several
possible reasons to explain our null findings for the tAHEI with diabetes prevalence. First,
adult men and women had lower median tAHEI score and narrow gaps across the quintiles,
which may fail to detect significant associations due to lack of enough variation. Second, the
AHEI-2010 was not based on Asian population-scientific evidence of diet-disease
relationship and the evidence-based threshold effect of each component of the AHEI-2010
may be population disparity. Jacobs’ study in the Hawaiian component of the multiethnic
cohort suggested that higher AHEI-2010 score related to a 13-28% lower risk of type 2
diabetes in white but not in Japanese-American and Native Hawaiian participants aged 45-75
interviewer-administered 3 consecutive 24 hour recall, which may be subject to under-estimate
episodically consumed foods in comparison of usual intake estimates from food frequency
questionnaires. In addition, we assessed the effect of 3 y follow-up, but those studies
investigated predictive of diabetes risk over 10 years follow-up. Finally, the tAHEI in our
study was not identical to the original Harvard AHEI-2010 27 due to several tailoring ways,
including the use of US nutrient database to estimate fatty acid intakes, the omission of trans
fat component and the use of dietary fiber component instead of whole grain. In addition, we
calculated the intake of insoluble fiber rather than total fiber from cereal given lack of soluble
fiber data in the China FCT. This may underestimate cereal fiber intake and consequently
lower its score. The aforementioned tailoring key components of the Harvard AHEI-2010
may have contributed to more strong prediction of disease risk27, 51. Studies have indicated a
positive association of trans fat with risk of diabetes 70, 71 and with increased LDL-C72, and a
negative association with risk of decreased HDL-C72. Mozaffarian suggested the definition of
whole grains with less than 10:1 ratio of total carbohydrate to fiber as the most healthful,
which was used in the Harvard AHEI-2010. Several comparative studies indicated that better
predictive capacity of the Harvard AHEI-2010 or the AHEI on disease risk may be due to its
additional dietary information including emphasis on increasing intake of whole grains,
reducing intake of sugar-sweetened beverages, and refining dietary fat quality 27, 28, 30, 32.
Our study is the first to create CDQI based on recommendations of the 2007 CDG 38, 52.
The 2007 CDG emphasizes promoting balanced diet on the basis of general sense on healthy
diet but lack of sufficient evidence on diet-disease relationship among the Chinese
population. Several relevant issues on the CDG need to be considered. First, the CDG should
not provide a single recommended intake of combined red meat and poultry given red meat
and poultry had differential impact on health outcomes; Second, coarse grains, defined as
was quite different from the whole grains in terms of health benefits. With regard to the
development of CDQI, refining the quality of total vegetables (light- or dark-color) and
considering age-sex-energy requirement-specific recommendation of relevant food intakes
may be advantageous to assess the overall dietary quality and improve the prediction of CM
risk. However, gender disparity of CDQI score related to prevalence of diabetes and elevated
TAG are not understood well and warrant further study.
Strengths of this study include the use of earlier dietary intake from the 2006 wave of
survey to estimate prevalence of multiple health outcomes in 2009, rigorous measurement of
diabetes ascertainment and lipid-related biomarkers, relative precise assessment of diet
quality using 24 hour recall methodology and the collection of three days of intake as was
shown in earlier research using the CHNS 42, 43, 46, and adjustment for a comprehensive range
of potential confounders. The prospective nature of ascertainment for diabetes has advantage
of clear temporality over cross-sectional design and reduces the possibility of reverse
causality. Type 2 diabetes and prediabetes were diagnosed using HbA1c, which has
advantage of assessing long-term glycemic exposure over a single measure of glucose and is
reliable for diabetes diagnosis in Chinese population63, 64 . Further, interviewer-administered
24-hour dietary recalls are a good way to assess adherence to healthy dietary
recommendations on a daily basis given its ability to capture extensive and complete
information on all foods and beverages consumed.
Our study also has limitations. First, only one time point of biomarker data in the 2009
CHNS makes it impossible to examine prospective associations between diet indexes and
incident CM risk factors except elevated BP. However, our analysis excluded those with
known diabetes, stroke and MI in 2006, which may reduce the possibility of changes in
dietary intake resulting from existing disease. Second, three consecutive 24-hour dietary
episodically consumed foods. Third, our analysis had a small number of incident cases of
type 2 diabetes in 3-year period and consequently limited our power to detect associations.
Further, the same total score may result from the sum of quite different component scores;
however, the nature of the predefined indexes is to assess overall diet quality. Further study to
identify the relevant individual components contributing to reduced risk may help
understanding diet-specific pathways for each CM risk.
In summary, this study had shown that the CDQI, which assesses adherence to CDG,
was inversely associated with the prevalence of diabetes and high LDL-C in men only and
the tAHEI was beneficially associated with the prevalence of high LDL-C in both men and
women. To the best of our knowledge, this is the first study to investigate simultaneously the
associations between adherence to CDQI and the tAHEI with diabetes and lipid-related CM
risk factors in the Chinese population. The association of adherence to tAHEI score with
decreased prevalence of high LDL has important health implications given its important role
on the context of rapidly increasing cardiovascular disease in the Chinese population. In the
future, longitudinal association between long-term follow-up diet quality and incident CM
27
Tables and Figures
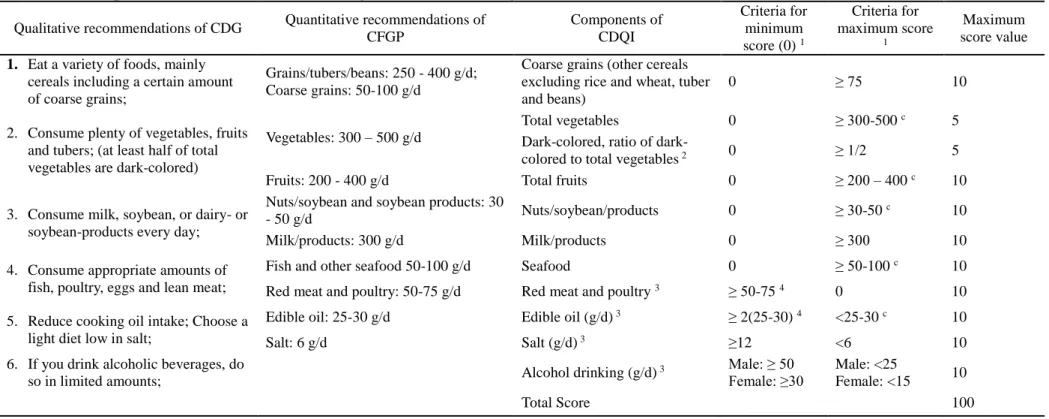
Table 3.1. Components of the CDQI and scoring methods according to the CDG and CFGP Qualitative recommendations of CDG Quantitative recommendations of
CFGP
Components of CDQI
Criteria for minimum score (0) 1
Criteria for maximum score
1
Maximum score value
1. Eat a variety of foods, mainly cereals including a certain amount of coarse grains;
Grains/tubers/beans: 250 - 400 g/d; Coarse grains: 50-100 g/d
Coarse grains (other cereals excluding rice and wheat, tuber and beans)
0 ≥ 75 10
2. Consume plenty of vegetables, fruits and tubers; (at least half of total vegetables are dark-colored)
Vegetables: 300 – 500 g/d
Total vegetables 0 ≥ 300-500 c 5
Dark-colored, ratio of
dark-colored to total vegetables 2 0 ≥ 1/2 5
Fruits: 200 - 400 g/d Total fruits 0 ≥ 200 – 400 c 10
3. Consume milk, soybean, or dairy- or soybean-products every day;
Nuts/soybean and soybean products: 30
- 50 g/d Nuts/soybean/products 0 ≥ 30-50
c 10
Milk/products: 300 g/d Milk/products 0 ≥ 300 10
4. Consume appropriate amounts of fish, poultry, eggs and lean meat;
Fish and other seafood 50-100 g/d Seafood 0 ≥ 50-100 c 10
Red meat and poultry: 50-75 g/d Red meat and poultry 3 ≥ 50-75 4 0 10
5. Reduce cooking oil intake; Choose a light diet low in salt;
Edible oil: 25-30 g/d Edible oil (g/d) 3 ≥ 2(25-30) 4 <25-30 c 10
Salt: 6 g/d Salt (g/d) 3 ≥12 <6 10
6. If you drink alcoholic beverages, do
so in limited amounts; Alcohol drinking (g/d)
3 Male: ≥ 50
Female: ≥30
Male: <25
Female: <15 10
Total Score 100
Abbreviations: CDQI=China Dietary Quality Index; CDG=Chinese Dietary Guidelines; CFGP=Chinese Food Guide Pagoda.
1 Participants with intakes between the maximum and minimum amount were assigned scores based on the formula: component score= (Maximum score / (A
max-Amin
))*(X-Amin) for adequacy components; component score = Maximum score - maximum score / (Amax-Amin))*(X-Amin) for moderate components; Amax is maximum amount of the
component corresponding to recommended intake. Amin is minimum amount of the component corresponding to recommended intake. X: amount consumed by the individual. 2 Dark-colored vegetables are defined as ≥ 500 mcg carotene /100 g of vegetables.
3Moderate components in CDQI. For the components edible oil, salt, and alcohol drinking, we chose twice of the recommended maximum intake as the criteria for 0 point to
increase the scoring variation.
28
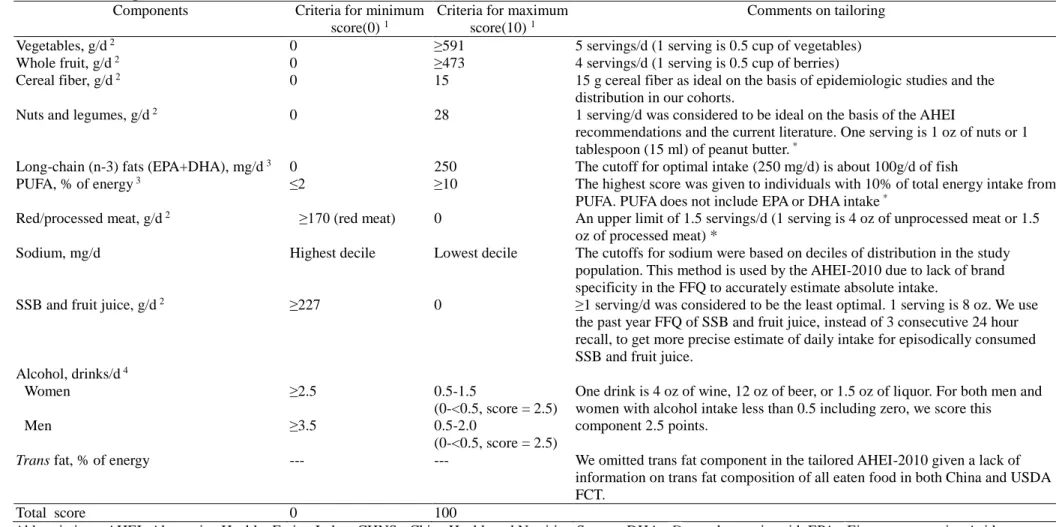
Table 3.2. Tailoring method of the Harvard AHEI-2010
Components Criteria for minimum score(0)1
Criteria for maximum score(10)1
Comments on tailoring Vegetables, g/d 2 0 ≥591 5 servings/d (1 serving is 0.5 cup of vegetables)
Whole fruit, g/d 2 0 ≥473 4 servings/d (1 serving is 0.5 cup of berries)
Cereal fiber, g/d 2 0 15 15 g cereal fiber as ideal on the basis of epidemiologic studies and the
distribution in our cohorts.
Nuts and legumes, g/d 2 0 28 1 serving/d was considered to be ideal on the basis of the AHEI
recommendations and the current literature. One serving is 1 oz of nuts or 1 tablespoon (15 ml) of peanut butter. *
Long-chain (n-3) fats (EPA+DHA), mg/d 3 0 250 The cutoff for optimal intake (250 mg/d) is about 100g/d of fish
PUFA, % of energy 3 ≤2 ≥10 The highest score was given to individuals with 10% of total energy intake from
PUFA. PUFA does not include EPA or DHA intake *
Red/processed meat, g/d 2 ≥170 (red meat) 0 An upper limit of 1.5 servings/d (1 serving is 4 oz of unprocessed meat or 1.5
oz of processed meat) *
Sodium, mg/d Highest decile Lowest decile The cutoffs for sodium were based on deciles of distribution in the study population. This method is used by the AHEI-2010 due to lack of brand specificity in the FFQ to accurately estimate absolute intake.
SSB and fruit juice, g/d 2 ≥227 0 ≥1 serving/d was considered to be the least optimal. 1 serving is 8 oz. We use
the past year FFQ of SSB and fruit juice, instead of 3 consecutive 24 hour recall, to get more precise estimate of daily intake for episodically consumed SSB and fruit juice.
Alcohol, drinks/d 4
Women ≥2.5 0.5-1.5
(0-<0.5, score = 2.5)
One drink is 4 oz of wine, 12 oz of beer, or 1.5 oz of liquor. For both men and women with alcohol intake less than 0.5 including zero, we score this
component 2.5 points.
Men ≥3.5 0.5-2.0
(0-<0.5, score = 2.5)
Trans fat, % of energy --- --- We omitted trans fat component in the tailored AHEI-2010 given a lack of information on trans fat composition of all eaten food in both China and USDA FCT.
Total score 0 100
Abbreviations: AHEI=Alternative Healthy Eating Index; CHNS= China Health and Nutrition Survey; DHA= Docosahexenoic acid; EPA=Eicosapntemacnioc Acid; FNDDS=Food and Nutrient Database for Dietary Studies; HEP=Healthy Eating Pyramid; PUFA=polyunsaturated fatty acid; SR=standard references; SSB=sugar-sweetened beverages. 1Intermediate intakes were scored between the minimum and the maximum according to the formula: component score= (Maximum score / (A
max-Amin))*(X-Amin)
for adequacy components; component score = Maximum score - maximum score / (Amax-Amin))*(X-Amin) for moderate components (red/processed meat, sodium, SSB and
fruit juice, and alcohol); Amax is maximum amount of the component corresponding to the recommended intake, while Amin is minimum amount of the component
corresponding to the recommended intake. X: amount consumed by the individual. 2 Serving units were transferred to grams to match the CHNS diet data. (1 cup = 236.59 g;
1 oz = 28.35 g); 3 We additionally linked all Chinese FCT foods to the USDA FNDDS and SR nutrient databases to estimate fatty acid composition which is unavailable from
29
Table 3.3. Baseline Characteristics of participants according to sex-specific quintiles of the CDQI scores, CHNS
Characteristics Men
P-trend1
Women
P-trend1
Q1 Q2 Q3 Q4 Q5 Total Q1 Q2 Q3 Q4 Q5 Total
N 412 413 412 413 412 2062 475 476 476 476 475 2378
Median2 24.2
(5.7, 29.4) 33.2 (29.5, 35.7) 38.5 (35.7, 42.0) 45.2 (42.0, 48.5) 53.9 (48.5, 82.1) 38.5 (5.7, 82.1) 28.8 (8.1, 33.3) 36.8 (33.4, 39.8) 42.8 (39.9, 45.7) 48.8 (45.7, 52.5) 57.4 (52.5, 84.9) 42.8 (8.1, 84.9) Age, %
18-<35y 15.0 17.7 14.3 17.4 14.8 15.9
0.49
11.2 12.8 11.1 15.1 11.6 12.4
0.56
35-<50y 39.6 41.6 39.3 38.5 39.1 39.6 43.6 43.5 44.7 45.8 43.8 44.3
50-<65y 45.4 40.7 46.4 44.1 46.1 44.5 45.3 43.7 44.1 39.1 44.6 43.4
Income, %
Low 32.8 33.2 33.7 37.5 29.4 33.3
0.20
33.3 37.4 31.9 36.3 27.6 33.3
0.01
Median 36.2 32.9 32.0 33.2 32.5 33.4 36.0 30.5 34.7 33.2 32.4 33.3
High 31.1 33.9 34.2 29.3 38.1 33.3 30.7 32.1 33.4 30.5 40.0 33.3
Education, %
< primary 11.9 10.7 10.7 9.0 10.2 10.5
0.20
29.7 30.5 30.7 30.0 25.1 29.2
0.35
Primary 19.4 18.2 18.4 18.9 25.2 20.0 23.6 21.4 18.9 20.2 21.3 21.1
> primary 68.7 71.2 70.9 72.2 64.6 69.5 46.7 48.1 50.4 49.8 53.7 49.7 Urbanicity index ,%
Low 28.2 27.4 28.9 41.9 40.8 33.4
<0.001
28.8 34.0 29.6 38.9 34.5 33.2
<0.001
Middle 43.7 37.0 36.2 27.1 22.8 33.4 40.4 35.9 33.8 34.0 24.0 33.6
High 28.2 35.6 35.0 31.0 36.4 33.2 30.7 30.0 36.6 27.1 41.5 33.2
Geographical region, %
North 10.0 11.9 17.5 28.8 41.3 21.9
<0.001
9.5 11.1 19.7 27.3 47.2 23.0
<0.001
Central 31.6 36.6 32.3 33.2 31.6 33.0 29.9 35.9 36.3 35.9 30.1 33.6