AUSTRALIAN JOURNAL OF BASIC AND
APPLIED SCIENCES
ISSN:1991-8178 EISSN: 2309-8414 Journal home page: www.ajbasweb.com
Open Access Journal
Published BY AENSI Publication
© 2017 AENSI Publisher All rights reserved
This work is licensed under the Creative Commons Attribution International License (CC BY).
http://creativecommons.org/licenses/by/4.0/
To Cite This Article: Abeer S. Desuky., Two Enhancement Levels for Male Fertility Rate Categorization Using Whale Optimization and Pegasos Algorithms. Aust. J. Basic & Appl. Sci., 11(7): 78-83, 2017
Two Enhancement Levels for Male Fertility Rate Categorization Using
Whale Optimization and Pegasos Algorithms
Abeer S. Desuky
Al-Azhar University, Mathematics Department, Faculty of Science, Cairo, Egypt.
Address For Correspondence:
Abeer S. Desuky, Al-Azhar University, Mathematics Department, Faculty of Science, Cairo, Egypt.
A R T I C L E I N F O A B S T R A C T Article history:
Received 18 February 2017 Accepted 5 May 2017
Available online 10 May 2017
Keywords:
Fertility Rate, Categorization, Artificial Intelligence, Whale Optimization Algorithm, Pegasos, SVM.
Background: Recently, diseases and health problems which were common only in the elderly, became common also among the youth. Some of these medical problems causes are behavioral, environmental and lifestyle factors. The decrease in fertility rates especially among the male population is one of those problems. Now, machine learning and artificial intelligence algorithms are an emerging methodology as computer aided decision systems in medical diagnosis and health problems. Objective: In this paper an incorporation of bio-inspired whale optimization algorithm (WOA) and Pegasos algorithm is used to enhance the male fertility rate categorization in two levels. Results: show that implementing WOA as second level of enhancement gives better accuracy than the first level of enhancement in Pegasos algorithm with prediction accuracy value of 90%. Conclusion: using two machine learning algorithms to categorize male fertility rate helped in overall improving for the proposed system performance to give results exceeded all recent researches results for fertility data.
INTRODUCTION
There has been a remarkable decrease in fertility over the last two decades and the global health community has recently concerned with the decline in male fertility. Studies showed that thirty percent of infertility is related to male factor. The evaluation of male fertility potential was based mainly on semen analysis which is the core of evaluating men for fertility or infertility, but late studies have proved that the test is not the only available way for predicting the fertility status of men reliably. Infertility has many causes including hormonal imbalances, psychological, environmental and behavioral factors (http://www.who.int/) (Barrat et al.,1998). To obtain a quick assessment of the seminal profile of the patients based on these factors, machine learning and artificial intelligence techniques have been applied as computer aided decision systems in medical diagnosis field. Such systems can be used for prior assessment of semen quality before more exhaustive, uncomfortable and costly tests are conducted on patients (Wang et al.,2014).
the performance and development of CAD classifiers (Barrat et al.,1998; Mazurowski et al.,2008; Raudys et al.,1991).
As is prevailing in medical data diagnosis (Mazurowski et al.,2008), most available male fertility rating data also have the class imbalance problem, where, the number of normal (negative) samples far exceeds the number of altered (positive) samples. Owing to this distorted distribution of data, many learning algorithms often perform inaccurately on the minority class (Wang et al.,2014; Jose et al.,2013). Some researchers have handled classification in the presence of these challenges. David Gil et al. (2012), proposed and compared three machine learning classifiers: multilayer perceptron (MLP), decision trees (DT) artificial and support vector machines (SVM) and the highest accuracy was 86% for SVM and MLP. In other work (Macmillan,2015), Artificial Neural Network (ANN) and Naïve Bayes (NB) classifiers presented for the characterization of seminal quality, based on environmental factors and life style habits, comparisons between the two classifiers showed that their accuracy rate was identical (80%). Particle Swarm Optimization (PSO) also proposed in (Puneet et al.,2015) and compared to another three learning algorithms. PSO showed the highest performance accuracy (88 %) whereas, SVM and MLP showed less performance accuracy (85%) and DT had the much less accuracy (84%).
The objective of this paper is to enhance the categorization of male fertility rate by considering some environmental and behavioral factors. Due to complexity of the problem itself, the data imbalance and its impact on categorization accuracy, two levels of enhancement will be applied using Pegasos algorithm as the first enhancement level and the bio-inspired whale optimization algorithm as the second enhancement level.
MATERIALS AND METHODS
Fertility Data Set:
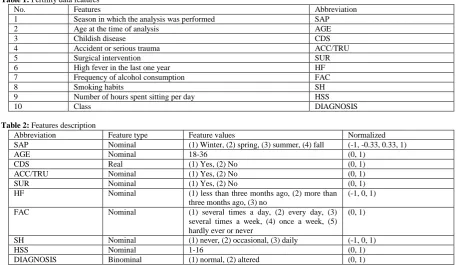
The dataset contains 100 instances, which obtained from semen samples taken from 100 volunteers and analyzed according to WHO (World Health Organization) 2010 criteria (http://www.who.int/). The volunteers were asked to fulfill nine survey about health status and life habits. According to the answers of the survey, nine features are determined to form this dataset which are: season in which the analysis was performed, age, childish disease, accident/trauma, high fever in the last one year, surgical intervention, alcohol consumption frequency, smoking habits and number of hours spent sitting per day plus the class which has two values (normal and altered fertility rate). The data were collected and shared in 2013 by the department of Biotechnology of University of Alicante (David et al.,2012). The data features and description are represented in Table 1 and Table 2
respectively.
Table 1: Fertility data features
No. Features Abbreviation
1 Season in which the analysis was performed SAP
2 Age at the time of analysis AGE
3 Childish disease CDS
4 Accident or serious trauma ACC/TRU
5 Surgical intervention SUR
6 High fever in the last one year HF
7 Frequency of alcohol consumption FAC
8 Smoking habits SH
9 Number of hours spent sitting per day HSS
10 Class DIAGNOSIS
Table 2: Features description
Abbreviation Feature type Feature values Normalized
SAP Nominal (1) Winter, (2) spring, (3) summer, (4) fall (-1, -0.33, 0.33, 1)
AGE Nominal 18-36 (0, 1)
CDS Real (1) Yes, (2) No (0, 1)
ACC/TRU Nominal (1) Yes, (2) No (0, 1)
SUR Nominal (1) Yes, (2) No (0, 1)
HF Nominal (1) less than three months ago, (2) more than
three months ago, (3) no
(-1, 0, 1) FAC Nominal (1) several times a day, (2) every day, (3)
several times a week, (4) once a week, (5) hardly ever or never
(0, 1)
SH Nominal (1) never, (2) occasional, (3) daily (-1, 0, 1)
HSS Nominal 1-16 (0, 1)
DIAGNOSIS Binominal (1) normal, (2) altered (0, 1)
The Whale Optimization Algorithm:
they swim within a shrinking circle and along a spiral-shaped path simultaneously around the prey (small fishes) to form distinctive bubbles along a 9-shaped path.
The mathematical simulation of this behavior in WOA, is given as follows:
1. Shrinking encircling preys: In WOA, the prey (target) and the other hunting whales (search agents) try to update their positions towards it is assumed as the currently best candidate solution. This is represented by the following equations:
𝐷 = |𝐶 . 𝑊∗(𝑡) − 𝑊(𝑡)| (1)
𝑊(𝑡 + 1) = 𝑊∗(𝑡)– 𝐴 . 𝐷 (2)
Where: t is the current iteration, W*(t) is the historically best position vector of a whale, W(t) is a whale
position vector and A, D are coefficient vectors which are calculated as follows:
𝐴 = 2 . 𝑎 . 𝑟 − 𝑎 (3)
𝐶 = 2 . 𝑟 (4)
where a is a variable linearly decreased from 2 to 0 over the course of iterations and r is a random vector uniformly distributed in [0,1].
2. Spiral bubble-net maneuver: To mimic the helix-shaped movement of whales, a spiral equation between the position of whale and prey is used as follows:
𝑊(𝑡 + 1) = 𝑒 𝑏𝑘. 𝑐𝑜𝑠(2 𝜋 𝑘). 𝐷՛ + 𝑊∗(𝑡) (5)
𝐷՛ = |𝑊∗(𝑡) − 𝑊(𝑡)| (6)
where b is a constant for defining the shape of the logarithmic spiral, and k is a random number uniformly distributed in [1,1].
When A is greater than 1 or less than 1, in order to have a global optimizer, the search agent is updated according to a randomly chosen search agent instead of the best search agent avoiding local optima:
𝑊(𝑡 + 1) = 𝑊𝑟𝑎𝑛𝑑 – 𝐴 . 𝐷՛՛ (7)
𝐷՛՛ = |𝐶 . 𝑊𝑟𝑎𝑛𝑑 – 𝑊(𝑡)| (8)
where Wrand is selected randomly from hunting whales in the current iteration (Mirjalili et al.; Kaveh et al.; Hongping et al., 2016).
Pegasos: Primal Estimated sub-GrAdient SOlver for SVM:
Pegasos is a simple and effective stochastic sub-gradient descent algorithm described by Shalev Shwartz et.al. (2007) for solving the optimization problem cast by Support Vector Machines (SVM).
Given a training set (xi, yi)(i = 1, …, n), where x is a d-dimensional feature vector and yi= ±1 is class label, linear support vector machines aim to find a classifier in the form of
ℎ𝑤,𝑏(𝑥) = 𝑠𝑖𝑔𝑛(𝑤𝑇𝑥 + 𝑏) (9)
where w and b are parameters. By introducing a dummy feature of constant value 1s, and ignore the parameter b. Then the parameter w can be learnt from the training set (Charu et al.,2015).
Unlike other algorithms which formulate SVM as constrained optimization problem, Pegasos algorithm relies on the following unconstrained formulation of SVM:
minw=
λ
2𝑤𝑤
𝑇+1
𝑛∑ 𝑙(𝑤, (𝑥𝑖, 𝑦𝑖)) 𝑛
𝑖=1 (10)
where
𝑙(𝑤, (𝑥𝑖, 𝑦𝑖)) = max{0, 1 − 𝑦𝑖𝑤𝑇𝑥𝑖} (11)
In each iteration Pegasos aims to update the weight vector w by using k training examples through the following approximate objective function (Shalev et al. ,2007; Charu et al.,2015):
𝑓(𝑤, 𝑖𝑡) = λ
2𝑤𝑤
𝑇+1
𝑘∑𝑖𝜖𝐴𝑡𝑙(𝑤, (𝑥𝑖, 𝑦𝑖)) (12)
Proposed Method:
In this paper, we use WOA algorithm to optimize Pegasos algorithm performance. The mechanism of WOA helps us to obtain the optimal w-parameter which is the core of Pegasos algorithm. Applying WOA to Pegasos is considered as applying two levels of optimizations to SVM since, Pegasos algorithm described mainly for solving the optimization problem cast by Support Vector Machines. In our proposed algorithm, WOA is used to promote population of candidate solutions which represent the w-parameter for attributes. The W* is the best candidate w -parameter which is the one getting the highest fitness function (minimum classification error) used in Pegasos classifier. The detailed steps are described as follows:
1) Initialize the population for N hunting whales’ positions (the w-parameter individuals) randomly. Assume that, the number of attributes for the w-parameter individual is d. A single whale position is Wi = {xi,j, j = 1,2,...,d},
where xi,j is jthw-parameter for the ith individual. For each individual, the value of the w-parameter is vector of random numbers in the range from -10 to 10 with length d.
2) Initialize the parameters C, A and k.
3) Calculate the corresponding fitness function for each hunting whale and select the best whale (leader) position and store it as W*.
4) The fitness function is calculated from the classification mean squared error which is obtained by Pegasos classifier (first level of optimization) to differentiate the normal and altered fertility rate correctly.
𝐹itness 𝑚𝑖𝑛 = MSE (13)
MSE =1
𝑛∑ (𝑌̂ − 𝑌)
2 𝑛
𝑖=1 (14)
where, 𝑌̂ is a vector of n predictions, and Y is the vector of observed values corresponding to the inputs to the function that generated the predictions.
5) Spiral equation (5) between the position of whale and prey and equations (6 -8) are used to update the positions of other whales.
6) Update parameters C, A, and k.
7) Go to step 3 if t is less than maximum number of iterations.
8) Return the position of W* which is the individual vector of best w-parameter vector and return the associated performance measures (second level of optimization).
Results:
The experiments were conducted in the Matlab R2015a platform on computer equipped with 2.20GHZ core i7 processor and 6GB RAM. Since classification Accuracy alone is typically not enough information to validate algorithms performance, different performance measures such as Sensitivity, Precision, F Measure are used for validating our method. Measures which are used for the validation of the data are defined as (Lamiaa and Abeer,2015; Namita et al., 2012):
Accuracy: It is the number of correct predictions made divided by the total number of predictions.
𝐴𝑐𝑐𝑢𝑟𝑎𝑐𝑦 = (𝑇𝑃+𝑇𝑁)
(𝑇𝑃+𝑇𝑁+𝐹𝑃+𝐹𝑁)
(15)
Sensitivity: It is also called the Recall or true positive rate (TPR)
Sensitivity = TP/(TP + FN) (16)
Precision: It is also called the Positive Predictive Value (PPV).
Precision = 𝑇𝑃/(𝑇𝑃 + 𝐹𝑃) (17)
F Measure: It is also called F Score and it conveys the balance between the precision and the recall.
𝐹𝑀𝑒𝑎𝑠𝑢𝑟𝑒 = 2 xPrecision x Recall
Precision+ Recall (18)
Table 3: Performance Measures for Pegasos classifier with and without WOA algorithm F Measure Sensitivity Precision Accuracy Method 93.05 98.86 87.88 88.00 Pegasos 94.63 100 89.80 90.00 WOA/Pegasos
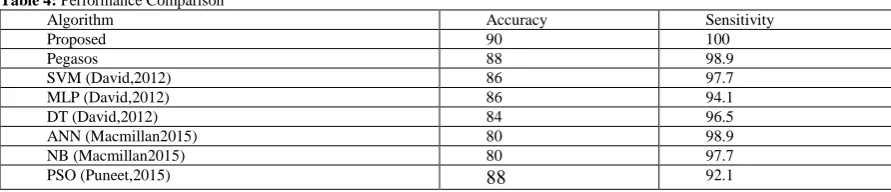
Fertility data is a new data set, became available for use by researchers in 2013, so only few researches worked on it. Table 4, presents a comparison between the performance of our proposed algorithm and some algorithms implemented recently on the fertility data.
Table 4: Performance Comparison
Sensitivity Accuracy Algorithm 100 90 Proposed 98.9 88 Pegasos 97.7 86 SVM (David,2012) 94.1 86 MLP (David,2012) 96.5 84 DT (David,2012) 98.9 80 ANN (Macmillan2015) 97.7 80 NB (Macmillan2015) 92.1 88 PSO (Puneet,2015)
From the experiment results shown in Table 4, we can see that the classification accuracy of first enhancement
level (Pegasos algorithm) is increased by 2 % than classification accuracy obtained by SVM in (David et al.,2012) while the increment in the classification accuracy was 4% after applying the second enhancement level (WOA algorithm). Generally, the results showed that the results achieved by the proposed method are higher than other algorithms implemented on fertility data.
Conclusion:
Fertility dataset is highly imbalanced data and biased towards the ‘Normal’ class so, two enhancement levels have been implemented using two machine learning algorithms in order to categorize male fertility rate. Primal Estimated sub-GrAdient SOlver for SVM (Pegasos) and Whale Optimization Algorithm (WOA) are used for first and second levels of enhancement respectively. experimental results showed that using (WOA) as second level of enhancement for Pegasos algorithm helped in overall improving for the proposed algorithm performance to give results exceeded all recent researches results for fertility data.
REFERENCES
Barrat, C.L., S. Clements, E. Kessopoulou, 1998. Semen Characteristics and fertility tests required for storage of spermatozoa, Human Reproduction (Oxford, England), 13(2): 1-7.
Charu, C., Aggarwal, 2015. Data Classification: Algorithms and Applications, CRC Press, pp: 707.
David Gil, Jose Luis Girela, Joaquin De Juan, M. Jose Gomez-Torres, and Magnus Johnsson, 2012, Predicting seminal quality with artificial intelligence methods, Expert Systems with Applications, 39(16): 12564-12573.
Hongping Hu, Yanping Bai, Ting Xu, 2016, A whale optimization algorithm with inertia weight, WSEAS TRANSACTIONS on COMPUTERS, 15: 319-326.
Jose, L. Girela, David Gil, Magnus Johnsson, María José Gomez-Torres, Joaquín De Juan, 2013. Semen Parameters Can Be Predicted from Environmental Factors and Lifestyle Using Artificial Intelligence Methods, Bio Reprod, 88 (4): 99, 1-8. doi: 10.1095/biolreprod., 112: 104653.
Kaveh, A. and M. Ilchi Ghazaan, 2016. Enhanced Whale Optimization Algorithm for Sizing Optimization of Skeletal Structures, Mechanics Based Design of Structures and Machines, DOI: 10.1080/15397734.2016.1213639 Lamiaa, M. El Bakrawy, Abeer S. Desuky, 2015. A hybrid classification algorithm and its application on four real-world data sets, International Journal of Computer Science and Information Security (IJCSIS), 13: 10.
Macmillan Simfukwe, Douglas Kunda and Christopher Chembe, 2015. Comparing Naive Bayes Method and Artificial Neural Network for Semen Quality Categorization, IJISET - International Journal of Innovative Science, Engineering & Technology, 2(7): 689-695.
Mazurowski, M.A., P.A. Habas, J.M. Zurada, J.Y. Lo, J.A. Baker, G.D. Tourassi, 2008.Training neural network classifiers for medical decision making: The effects of imbalanced datasets on classification performance, Neural Networks, 21: 427-436.
Mirjalili, S., and A. Lewis, 2016. The whale optimization algorithm, Advances in Engineering Software, vol. 95, Elsevier Ltd., pp: 51-67.
Namita Aggarwal, R.K. Agrawal, 2012. First and Second Order Statistics Features for Classification of Magnetic Resonance Brain Images, Journal of Signal and Information Processing, 3: 2.
using Particle Swarm Optimization, International Journal of Bio-Science and Bio-Technology, 7: 1.
Raudys, S.J., A.K. Jain, 1991. Small sample size effects in statistical pattern recognition: recommendations for practitioners, IEEE Transactions on Pattern Analysis and Machine Intelligence, 13: 252-264.
Shalev-Shwartz, Shai, Yoram Singer, and Nathan Srebro, 2007. Pegasos: Primal estimated sub-gradient solver for SVM, Proceedings of the 24th international conference on Machine learning, pp: 807-814, ACM .
Wang, H., Qingsong Xu and Lifeng Zhou, 2014. Seminal Quality Prediction Using Clustering-Based Decision Forests, Algorithms, 7(3): 405-417, doi:10.3390/a7030405