Abstract
Anticoagulation with warfarin is characterized by a wide inter-individual variations in dose requirements and INR (International Normalised Ratio) stability, as there are evidences that warfarin response variability is associated with CYP2C9 (cytochrome P450, family 2, subfamily C, polypeptide 9) and VKORC1 (Vitamin K epoxide reductase complex1) genetic polymorphisms. Carriers of CYP2C9*2 and VKORC11639G>A variant alleles are at greater risk of unstable anticoagulation therapy. Objectives: This retrospective case control study was directed to analyze the impact of genetic and non-genetic factors on warfarin therapy in Sudanese patients who were on long term warfarin therapy. Method: 118 Sudanese out-patients receiving warfarin treatment for at least six months, were interviewed for their non-genetic factors that included age, sex, indication for warfarin therapy, compliance, Vitamin K rich foods intake and concomitant drug therapy, in addition to their blood samples which were taken for DNA extraction and genotyping of CYP2C9*2 and VKORC11639G>A gene
polymorphisms to study the genetic factors. INR stability % index was calculated, accordingly patients were classified
into 2 groups, stable and unstable groups. Results: The frequencies of VKORC11639G>A alleles in Sudanese out-patients who were on long term warfarin therapy were 70.3% and 29.7% for the VKORC1/G and VKORC1/A alleles respectively. The frequencies of CYP2C9*2 alleles in Sudanese out-patients were 92.4% and 7.6% for CYP2C9*1 and CYP2C9*2 alleles respectively. Variables associated with low INR stability were VKCOR1/AA genotype (p-value = 0.028) and sex (p = 0.017). Variables that showed no association with INR stability were age (p-value = 0.259), compliance (p-value = 0.058). Vitamin K rich foods intake (p- value = 0.743), and mean stable warfarin dose (p-value = 0.439). Conclusion: Polymorphism in warfarin drug target gene VKORC1-11639G>A and sex are important elements of INR stability in Sudanese out- patients on long term warfarin therapy.
Keywords: CYP2C9*2, INR Stability, VKORC11639G>A, Warfarin
Genetic and Non-Genetic Factors Association with
Warfarin Long Term Therapy Stability in Sudan
Azza A. M. H. Swar Aldahab
*and Abdallah. O. Elkhawad
University of Medical Sciences and Technology, Department of Pharmacology, Faculty of Pharmacy, KhartoumState, Khartoum Sudan; [email protected]
1. Introduction
1.1 Warfarin
Warfarin is prescribed for patients who are at great jeopardy for creating a clot inside their blood vessels. Despite more than 50 years of experience using it and advances in the ability to monitor it, warfarin remains among the most problematic drugs to manage in clinical practice and a major cause of drug-induced morbidity
and mortality. However, because they can be orally administered, warfarin remain the most frequently used agent when long-term anticoagulation therapy is needed1.
1.2 INR Stability
come to the anticoagulation clinics with a non-consistent pattern of INR values, which are either higher or lower than the INR range specified for them, because it is quite effortful and hard to keep INR values within the specified range3. Therefore, a new indicator was defined in order
to study warfarin’s anticoagulation long term therapy stability, which is the INR Stability %. INR stability % = 100 x number of INRs within target range/total number of INR measurements4. A number of factors affect warfarin
therapy, these factors include genetic factors and non-genetic factors of poor compliance, drug interactions, or vitamin K rich foods intake1.
2. Problems with Warfarin
2.1 Non-genetic Factors
The number of reports of interactions between warfarin and drugs and foods are increasing. Although true mechanisms of drug interactions almost always remain unknown, many drugs were known to potentiate warfarin effect, which are inhibitors of CYP2C9 enzyme, such as amiodarone and fluconazole, while other drugs are CYP2C9 enzyme inducers such as rifampicin. The most difficult group of drugs are those that potentiate bleeding on their own, the risk of bleeding is then greater if they are taken with warfarin. Both vitamin K enriched and reduced diets affect INR stability, the enriched vitamin K diets more rapidly than the reduced ones4. In5 considered interrelationship of vitamin K and
responsiveness to warfarin in 50 patients, they found that the responsiveness to warfarin therapy was declined by high vitamin K enriched food intake. In6 studied patients
on vitamin K supervised programme, they had achieved target INR more commonly than those on standard style of warfarin treatment, however, the clinical suitability of these findings for long term warfarin therapy requires more assessments.
2.2 Genetic Factors
2.2.1CYP2C9*2
Genes are identical in every population, but very limited numbers of genes are not similar in some people. Alleles constitute a gene with small discrepancy in the DNA bases sequence.
Single Nucleotide Polymorphisms (SNPs) are the most
once every 300 nucleotides. When SNPs take place inside a gene, they lead to modifications in genes’ functions7.
The wildtype allele CYP2C9*1*1 is directly correlated to normal warfarin metabolism activity, CYP2C9*2 is one of the most known CYP2C9 gene polymorphism, this polymorphism leads to reduction in warfarin metabolism. Therefore, warfarin doses are minimized by about one third when this type of gene variation is present8.
2.2.2. VKORC11639G>A
VKORC1 gene codes the vitamin K epoxide reductase enzyme complex 1, warfarin obstructs vitamin K actions and hence stops clotting factors formations. VKORC1 1639G<A polymorphism is the most familiar gene polymorphism in populations of Asian and European origins9. Genotyping tests aim to improve the safety
of warfarin dosing. Genetic variations of CYP2C9 and VKORC1 can be identified by genotyping tests to identify patients with high risk of bleeding complications, meaning that determination of warfarin optimal dosing is best to be based on dosing algorithms which rely on both clinical features such as age, sex and weight along with genotypes profile. However, genotyping is a tool that may aid in selecting the correct dose of warfarin, but careful monitoring of INR is still required for optimal dose adjustments10,11.
2.3 Ethnicity
There has been much concern recently about the concept the genetic testing. The great ethnic distinction in Sudan is a result of the early human African migrations which are not yet fully examined on the genetic level. Researchers at the Institute of Evolutionary Biology (IBE), have studied human genetic diversity in Sudan, they observed the populations that speak languages of the same linguistic family have a common shared genetic components, that is close genetic relationship between members of the same language family, demonstrating that only linguistic evidence is relevant in drawing conclusions about Sudanese population classification12.
3. Objectives
their effects on the INR stability, in addition to the non-genetic factors contribution.
4. Materials and Methods
The methodology for the study of the genetic and non-genetic factors was performed through the following phases:
Phase 1
4.1Study Design
In this retrospective case-control study, Ethical clearance for the study procedure was acquired from the Sudanese Clinical Trials and Drug Research on Human and Animal Committee-National Medicines and Poisons Board.
4.2 Patients
118 Sudanese out-patients attending the anti-coagulation clinic at the Sudan heart Centre–Khartoum–Sudan were selected. All Patients with a continuance anticoagulation treatment were recruited according to the inclusion criteria which included all patients being Sudanese with cardiovascular diseases who were on long term oral warfarin therapy and aged up to 75 years old. The exclusion criteria included patients who had a history of renal, hepatic, thyroid or malignancy diseases. To certify compliance with ongoing INR follow-up, patients needed to acquire one INR determination every four weeks for minimum of six months.
4.3 Data Collection
The anticoagulation profile and a full warfarin dosing data were recalled from the patients’ hospital medical history documents which included INR values, dose of warfarin being administered, and the dose advised at each visit, and INR range. The tow variables which were to be calculated, the INR stability % and mean stable warfarin dose. The INR stability % was described as the percentage of the number of INR values within target range divided by the total number of INR measurements. INR stability % = Number of INR measurements within target range/ total no. of INR measurements x1004. The mean stable warfarin
dose defined as the mean dose related to the stable INR measurements within target range. Mean stable warfarin dose = Number of warfarin stable doses /total number of
warfarin doses2. Patients were then sorted out according
to their INR stability % into two groups: Group1: Stable patients defined as patients who were having the highest percentages of INR stability %. i.e.,: An International Normalized Ratio (INR) greater than 2 but less than 3.5, 4.0 or 4.5 according to their INR target range. Group 2: Unstable patients defined as patients who were having the lowest percentages of INR stability %. (Table 1.1 ) Demographic data and non-genetic factors included sex, age, ethnicity, indication for warfarin therapy, vitamin K rich foods intake, concurrent medications (type and number) and patient compliance (dose and schedule) were collected using a questionnaire. Venous blood samples (4 ml) were collected and sent to the research laboratory and stored at -20 degrees preceding DNA extraction, to perform the genetic testing for both groups of patients to look at their genetic profiles and evaluate their relation to anticoagulation stability.
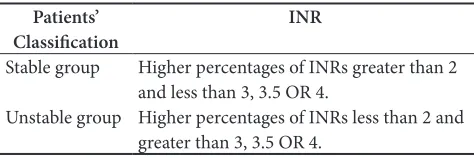
Table 1.1 Patients’ classification according to INR sta-bility %
Patients’
Classification INR
Stable group Higher percentages of INRs greater than 2 and less than 3, 3.5 OR 4.
Unstable group Higher percentages of INRs less than 2 and greater than 3, 3.5 OR 4.
Phase 2
4.4 DNA Extraction
Genomic DNA was extracted from blood leukocytes using the QIAamp DNA blood Mini Kit (Quiagen), designed for rapid purification of genomic DNA.
Phase 3
4.5 Genotyping of CYP2C9*2, and VKORC1
-1639G>A
Table 1.2 Primers used for CYP2C9*2, and VKORC1 (-1639G>A) PCR protocol for DNA amplification
Gene Primer Sequence
CYP2C9 Forward:
5-TGCCTGTTTCAGCATCTGTC-3 Reverse:
5-CCCCTGAAATGTTTCCAAGA-3
VKORC1 Forward:
5-GCCAGCAGGAGAGGGAAATA-3 Reverse:
5-AGTTTGGACCTACAGGTGCCT-3
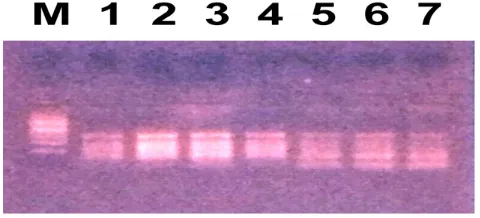
Figure 1. PCR product of CYP2C9*2.
Lane M: DNA Marker.
Lanes 1, 2, 3, 4, 5, 6: PCR product of CYP2C9*2 (382bp). Lane 7: Heterozygous genotype of CYP2C9*2, three bands of fragments length of 382bp, 258bp and 129bp.
Figure 2. PCR product of VKORC11639G<A.
Lane M: DNA Marker. Lanes 1, 2, 3, 4, 5, 6: PCR product of VKORC1-1639/GA (290 bp).
Phase 4
4.6 Restriction Fragment Length
Polymorphism: RFLP
Phase 4.1
4.6.1 Restriction Enzyme MsP1
The MspI restriction enzyme was used to treat the 290 bp amplicon of VKORC1-1639G>A gene PCR product. First we prepared the restriction enzyme by dilution of the buffer provided with restriction enzyme by adding 1 ul of the buffer to 10 ul of distilled water, then we added 2,5 ul of the diluted buffer to 10 ul of PCR product, and 0.5 ul of restriction enzyme and 12 ul of distilled water making a final reaction volume of 25 ul. The PCR product was treated with the restriction enzyme Msp1 by adding the volumes above and left for incubation for 15 minutes at 37 degrees, the 290-bp amplicon was cut into 2 restriction fragments of 167 and 121 bp , but in the case of the existence of the A allele, this produced an amplicon that was insusceptible to be cut by MspI restriction enzyme, Figure 3(a), 3(b).
Figure 3a. VKORC1-1639G<A Polymorphism Representative Gel Electrophoresis:
Figure 3b. VKORC1-1639G>A polymorphism representative gel
290bp, 169bp and 121 bp. Lane 5, 6, 7: Wild type VKORC1 genotype, one band with a fragment length of 290 bp.
Lane M DNA sizer. Lane 5: Wild type genotype of VKORC1-1639/GA, two fragments length of 121 bp and 169 bp.
4.6.2 Restriction enzyme Ava11
To study the CYP2C9*2 allele, the PCR product of CYP2C9*2 was treated with the AvaII restriction enzyme. First we prepared the AvaII restriction enzyme by dilution of the buffer provided with the restriction enzyme by adding 1 ul of the buffer to 10ul of distilled water, then 2.5 ul of the diluted buffer was added to10 ul of PCR product, and 0.5 ul of restriction enzyme with 12 ul of distilled water making a final reaction volume of 25 ul. The PCR product was treated with the restriction enzyme AvaII by adding the volumes above and left for 15 minutes followed by incubation at 80 degrees for 20 minutes for inactivation of the enzyme, giving rise to two bands with lengths of 253 and 129 bp for the wild-type allele. While the CYP2C9*2 allele was bearing no restriction by the AvaII restriction enzyme, producing one band with a length of 382 bp.
Figure 4. CYP2C9*2 Polymorphism Representative Gel
Lane M: DNA marker.
Lane 1: Homozygous mutant CYP2C9*2 genotype, one band of fragment length of 382bp.
Lanes 3, 4, 5: Wild type genotype of CYP2C9*2, two bands of 258 bp and 129bp.
5. Results
Table 2. Demographic and Basic Characteristics of Sudanese out-patients on long term warfarin therapy involved in the study: N = 118.
Age 48.0 +-16.4
No. of INR measurement 15.6+-7.0
INR stability % 33.9+-20.1
Mean stable warfarin dose 5.1+-2.4 Sex 77 Female (65.3%) 41Male (34.7%) Indications
DVR (17) 14.5%
AF (35) 29.9%
MVR (30) 25.6%
AVR (22) 18.8%
CHD (1) 0.85%
PE (3) 2.6%
CVR (1) 0.85%
DCM (1) 0.85%
Stroke (1) 0.85%
DVT (1) 0.85%
Sinus thrombosis 1 (0.85%)
MI 2(1, 71%)
CVA 2 (1, 71%)
Low vit.K rich foods intake 41(34.75%) Moderate vit.Krich foods intake 77(65.3%)
Correct compliance 104(89.7%)
Incorrect compliance 12(10.3%) Target INR
2.0-3.0 51 (43.2%)
2.5-3.5 32 (27.1%)
3.0-4.0 29 (24.68%)
3.5-4.5 6 (5.0%)
Patient classification
Stable patients 60 (50.9%)
Unstable patients 58 (49.1%)
Figure 5. INR stability% versus patient’s classification of stable and unstable groups of Sudanese out-patients on long term warfarin therapy.
Obs.: No. of observations, N=118, P-value =0.0001.
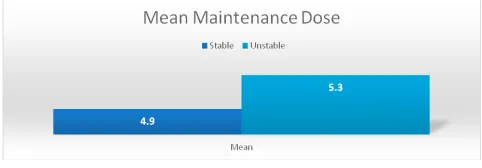
Figure 6. Mean Stable warfarin dose.
P-value = 0.439, values are represented as mean.
Mean stable warfarin dose versus patients’ classification of stable and unstable groups of Sudanese out-patients on long term warfarin therapy N = 118.
Comparison of stable and unstable groups of Sudanese out-patients on long term warfarin therapy for Qualitative variables.
Compliance represented as frequencies of correct compliance and incorrect compliance as a function of patients’ classification of stable and unstable groups of Sudanese out- patients on long term warfarin therapy.
Genetic tables:
89.90%
5.88% 4.20%
CYP2C9*1*1 CYP2C9*1*2 CYP2C9*2*2
CYP2C9*2 Genotype frequency
Figure 7. CYP2C9*2 genotypes frequencies among Sudanese out-patients on long term warfarin therapy: N=118. Data are represented as percent (%).
Figure 8. Alleles frequencies of CYP2C9*2 in Sudanese out- patients on long term warfarin therapy warfarin therapy: N=118.
CYP2C9*1: Wild type allele. CYP2C9*2: Variant allele.
92.40%
7.60%
CYP2C9*1 CYP2C9*2
Chart Title
N = 118, P-value = 0.713.Odds ratio = 1.5
Figure 9. Genotypes frequencies of CYP2C9*2 versus patients’ classification of stable and unstable groups of Sudanese out-patients on long term warfarin therapy.
Figure 10. VKORC11639G<A genotypes frequencies among Sudanese out- patients on long term warfarin therapy: N=118.
Data are represented as percent (%).
20.17%
67.23%
12.60%
VKORC1/GG VKORC1/GA VKORC1/AA
Figure 11. Alleles frequencies of VKORC11639G>A among Sudanese out-patients on long term warfarin therapy warfarin therapy: N=118.
Data are represented as percent%, G: Wild type allele , A: Variant allele .
70.30%
29.70%
G A
Frequency
Figure 12. Genotypes frequencies of VKORC1-1639G>A versus patients’ classification of stable and unstable groups of Sudanese out-patients on long term warfarin therapy. N = 118, P-value = 0.024, Odds ratio = 4.9 (1-1) VKORC1 wild type, (1-2) VKORC1 heterozygous, (2-2) VKORC1 homozygous genotype.
Figure 13. Ethnicity versus patients’ classification of stable
Table 3. Carriers’ prevalence of CYP2C9*2 and VKORC1-1639G>A combinatorial profiles in Sudanese population involved in the study=118
VKORC1 CYP2C9*1*1 CYP2C9*1*2 CYP2V9*2*2 Total
GG 22
(20.9%) (25%)2 (0.0%)0 (20.2%)24
GA 72
(68.5%) (37.5%)3 (100%)5 (67.2%)80
AA 11
(10.5%) (37.5%)3 (0.0%) (11.8%)14
Total 105
(100%) (100%)8 (100%)5 (100%)118 Data are represented as number (percent %) within CYP2C9*2 genotype classification. P-value = 0.292. 22(20.9%) patients were wild-type homozygous CYP2C9*1*1 and VKORC1/GG. 0(0%) patients were homozygous mutant in both CYP2C9 and VKORC11639G<A genes simultaneously VKORC1/ GG: Wild type Genotype, VKORC1/GA: Heterozygous genotype, VKORC1AA: Homozygous mutant. CYP2C9*1*1: Wild type homozygous genotype, CYP2C9*1*2: Heterozygous genotype, CYP2C9*2*2: Homozygous mutant genotype.
6. Discussion
VKORC1-1639G>A and CYP2C9*2 polymorphisms explain the variability of mean warfarin dose and hence stability among anticoagulation patients13. This was
illustrated by the recent randomized clinical trials that was studying those two genes’ based warfarin dosing, the trials failed to prove a successful gene based dosing strategy which had actually performed worse than clinical dosing strategy in the 27% of patients who were of African ancestry. It is clear that warfarin dosing incorporates with the CYP2C9*2 and VKORC11639G>A single nucleotide polymorphisms, but do not adequately explain the variability in warfarin dosing in African populations14
Studies on haplotypes of VKORC1 gene showed that the highest haplotype diversity was observed in Sub-Saharan Africans. The -1639 A allele (rs9923231) carried by haplotype H1, is the most frequent VKORC1 haplotype worldwide (49.7%)15.
but not in West Africans. CYP2C9 is usually not seen in Africans or have low frequency in Africans. Also Sudanese population appear to have less CYP2C9*2 prevalence than other populations. Neither stability nor warfarin dose were associated with CYP2C9*2 variant allele16.
6.1 VKORC1-1639G>A
VKORC11636G>A polymorphism is associated with warfarin dose requirements among populations from African descent, of whom warfarin resistance is indicative although VKORC1 polymorphism showed highest diversity in allele frequency among different populations17.
Upon defining the population prevalence of VKORC1639G>A single nucleotide polymorphism, the genotype and allele frequencies are mentioned in Figures 9.10. The allele frequency for VKORC1 1639>G was reported to be highest in African American subjects (89%)18. This complies with our finding of the 70.3%
VKORC11639>G allele frequency found in our Sudanese population.
On the other hand, the Minor Allele Frequency (MAF) of VKORC1 1639G>A allele was found to be 29.7%, shown as the A allele frequency19. The heterozygous
VKORC1/GA genotype frequency has been found to be 67.8%, which is a surprisingly high frequency among Sudanese population studied. This result is close to the results found by a study done on the southern Eastern European Romanians, in which it was found that 51.2% were carriers of VKORC1-1639/GA heterozygous genotype profile20.
Controversially, in a meta-analysis done by20, it was
found that the frequency of wild type VKORC1-1639/ GG genotype was 58% in African populations. This VKORC1-1639G>A single nucleotide polymorphism had a significant influence in anticoagulation stability, as it has been seen. In this study, by comparing the VKORC1-1639/ AA homozygous mutant genotype carriers with the wild type VKORC1-1639/GG carriers versus stability, this gave an odds ratio of almost 5, meaning that individuals with mutant VKORC1-1639/AA genotype were 5 times more likely to be unstable unlike those of wild type genotype. This result was statistically significant, P value = 0.024. Figure 11.
African ancestries are mainly noticed for their high warfarin dose requirements in contrast to Europeans and Asians21.
encodes VKORC1 enzyme, which results in an enzyme with a reduced ability to bind to warfarin, this reduction causes an incomplete warfarin resistance resulting in a higher dose of warfarin to be needed22.
This is reflected by the mean warfarin dose among the unstable group of Sudanese populations studied, which comprised the group of the higher VKORC11639AA genotype, the dose which was 5.3±2.9 mg/day (37.1 mg/ week, range 57.4-16.8 mg/week), corresponds to the presence of the variant allele which was more frequent among the unstable group. This dose could be described as a high dose, since it complies with a study done on Egyptians who carry VKORC1 mutations showed high warfarin dose requirement of 57.1±29.4 mg/week versus those with normal VKORC1 genotype which was 35.8±16.6 milligram per week23.
Also the generally high adjusted mean warfarin weekly dose range of 39 to 47 mg/week has been seen in Africans. The large scale population foundation of Africans compared to other races accounts for the complications in analysing individuals of an African origin21.
The results are clearly showing the high frequency of the heterozygous VKORC1- 1639GA genotype among all patients, constituting of the Afro-Asian racial group, with a frequency of 71%, in addition to 61% of the Nilo-Saharans, and 50% of the Niger-Congos were carriers of VKORC1/GA heterozygous, but surprisingly without any VKORC1/AA homozygous mutant genotype for Niger-Congos. As the instability by VKORC1-1639G>A polymorphism is distinct by ancestral groups24. The allelic
distribution of VKORC11639G>A showed a great degree of high prevalence across Sudanese patients different ethnical groups, being similar to the Indian populations different ethnicities, with VKORC1-1639G>A allele frequencies which were found to be as low as 6.5% and up to 70% 25. But, our results are quite different from the
Chinese population whose genetic data had accounted for 90% of homozygous mutant VKORC1/AA genotype and only 10% of VKORC1/GA heterozygous genotype profile26.
6.2 CYP2C9*2
The genotype frequencies are shown in Figure 6, showing only 4.2% are carriers of CYP2C9 *2*2 homozygous mutant genotype. The differences in genotype frequencies of CYP2C9 were not statistically different between stable and unstable groups, P-value = 0.713, and when comparing the CYP2C9*2*2 homozygous mutant genotype group with the CYP2C9*1*1 wild type genotype between stable and unstable groups, this comparison gave an odds ratio of 1.5, this shows that individuals with CYP2C9*2*2 mutant genotype are 1.5 times more likely to be unstable when compared to CYP2C9*1*1 wild type genotype profile, this was not statistically significant, P-value = 0.713, as it can be seen in Figure 8, since only 5 individuals have this genotype. The later result complies with a study done on Africans which did not detect an anticoagulation stability association with CYP2C9*2 variant, due to the low allele frequency as 92% were carriers of CYP2C9*1*1 wild type genotype28. The
frequency of CYP2C9 polymorphism regarding ethnicity was unique in the genotype distribution among different Sudanese racial groups, having the highest frequency of 86.2% of CYP2C9*1*1 wild type allele among Afro-Asians, showing the Nilo-Saharan and Niger-Congos having only this wildtype CYP2C9 *1*1 genotype profile with neither CYP2C9*1*2 heterozygous genotype nor CYP2C9*2*2 homozygous mutant genotype profiles.
From these results, given the smaller range of variant allele frequency for CYP2C9 to that of VKORC1, it is apparent that the association in warfarin therapy stability is larger for VKORC1 than for CYP2C929,30. By taking a
general look at the ethnicity versus frequencies of both genes, we found that 22% of all Sudanese patients were without any of the variant alleles of both CYP2C9*2 and VKORC1-1639G>A, that means having neither heterozygous nor homozygous mutant genotypes of the tow genes studied. Also 0% of all patients had mutations in both genes simultaneously. Table 3. But, the highest frequency was found for the VKORC11639/GA heterozygous genotype and the wild type CYP2C9*1*1 genotype being 67.8% and 88.9% of all the patients respectively. This was explained in many studies that showed pharmacogenetics dosing incorporation of the two genes explained 40% of the instability in warfarin therapy among white ethnicities, but only 20% among Africans descents, this might be due to the reduced frequencies of these alleles as mentioned earlier14.
6.3 Non-Genetic Factors
It appears there are no differences in warfarin anticoagulation stability in young versus elderly patients, in spite of age being a critical non-genetic factor for warfarin dose requirements31. In our study, the mean age
among the stable patients was higher than in unstable patients (49.7+/-16.1, 46.3+/-16.8), however, age showed no significant difference statistically between stable and unstable groups, P-value = 0.259. The absence of significant association between age and warfarin anticoagulation stability indicates that age did not prevent patients, especially elderly ones, from maintaining their INRs within the recommended anticoagulation target INR ranges and gaining stability.
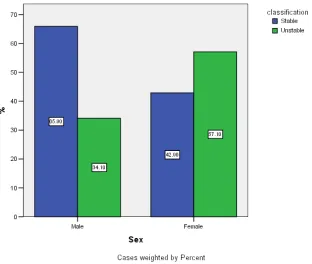
Figure 14. Frequency histograms of sex stratified according to patients’ classification of stable and unstable groups of Sudanese out- patients on long term warfarin therapy N=118.
P-value = 0.017, Blue panel = stable group, Green panel = unstable group.
Our results are confirmed by previous studies which showed warfarin’s INR stability is independently linked to age32. While other studies found a significant association
between stability and age33. There are differences related to
anticoagulants efficacy, especially among women, as it was found that female gender significantly spend more time outside the INR therapeutic range than men, as shown in a recently published study, 29% of women where below the INR therapeutic range versus 26% of men, by this putting them at a more risk of ischemic stroke34. In our study, INR
females than males, (57.1% vs 34.2%) in unstable group respectively. The observed high instability among females, a result which was statistically significant, P-value = 0.017, Figure 3, can be documented by previous studies that showed anticoagulation variability was higher in females than in males35.
Our results demonstrate a higher frequency of stable patients who were on moderate rather than low vitamin K rich foods intake, 51.9% of stable patients were on moderate vitamin K rich foods intake versus 48.8% of stable patients were on low vitamin K rich foods intake, showing that stable INR could be achieved by taking moderate amounts of vitamin K rich foods. On the other hand, we found in this study, 51.2% versus 49.2% of unstable patients were on low and moderate vitamin K rich foods intake respectively. These results did not show a statistical difference between stable and unstable groups, P-value = 0.743, Figure 4. These results are convincing although the study was restricted by some factors which had faced all previous studies including the lack of an exact cut-off points of comprehensive enlightenment of the real content of vitamin K nutrient among Sudanese foods, which might be challenging to anticoagulation patients, taking into account, the study is a qualitative analysis of vitamin K rich foods, as utilization of vitamin K containing foods was considered low or moderate depending on the number of meals per week, without a real quantitative evaluation in ug/day.
Figure 15. Vitamin K rich foods intake.
P-value = 0.743, Blue panel = stable group, Green panel = unstable group
In this study, we found that patients with correct compliance were more frequent among stable group (75% versus 46.1%), while incorrect compliance frequency was
than unstable patients who were not compliant to warfarin therapy, but this result is without a statistically significant difference, P-value = 0.058, Figure 5. These findings are on line with a study that had found poor compliance with warfarin is a common risk factor for warfarin instability leading to serious complications36, 37.
Figure 16. Compliance. N=118, P-value =0.058.
One of the reasons of the variation of warfarin dose and anticoagulation stability is the concomitant medications that could lead to drug-drug interactions. Therefore, each concurrent medication to be used within warfarin treatment should be checked for drug-drug interactions reference. Even stable patients on concomitant medications should be tested at least once a month38. In this study, none of the observed concomitant
medications had an association with warfarin stability. The statistically significant mean change in INR stability regarding stable and unstable groups, P-value = .0001, Figure 1, could be considered clinically due to the differences of genetic and non-genetic factors which were ruled out above. Although no statistical significant association was detected between most of those factors and stability, nor between stability and racial groups. As INR stability remains the reflection of the degree of anticoagulation status. Therefore, in Sudan it will remain an obligation to decide the most fitting mode of treatment for each patient individually, assuring that the most important aspect contributing to INR stability will remain the frequent monitoring, that is, at least once a month, if not once a week, to obtain a safe warfarin administration .
Sudanese patients, have a higher impact than CYP2C9*2 in the stability of warfarin therapy. In conclusion, our final report suggests that among Sudanese patients, sex and VKORC1-1639/GA polymorphism had significant effects on INR stability. This study is one of the few studies which specifically looked into the genetic profiles of Sudanese population concerning CYP2C9*2 and VKORC1-1639G>A genes polymorphisms. However, further studies on these polymorphisms are essential for further confirmation. (29)
8. References
1. Heneghan C, Alonso-Coello P, Garcia-Alamino JM, Per-era R, Meats E, Glasziou P. Self-monitoring of oral an-ticoagulation: A systematic review and meta-analysis. Lancet. 2006 Feb; 367(9508):404–11. DOI: 10.1016/S0140-6736(11)61294-4.
2. Li S, Zou Y, Wang X. Warfarin dosage response related pharmacogenetics in Chinese population. PLoS One. 2015 Jan16; 10(1). DOI: 10.1371/journal.pone.0116463
3. Witt DM, Delate T, Clerk NP, Martell C. On behalf of the Warfarin Association Research Project and other Endeav-ours (WARPED) Consortium. Blood. Jul 2009; 114:952-956.
4. Kim JH, Song YB, Shun DH. How well does the target INR level maintain in warfarin–treated patients with non-vul-var atrial fibrillation? Yonsi Med J. 2009 Feb 28; 50(1):83–8. DOI: 10.3349/ymj.2009.50.1.83.
5. Lubetsky A, Srern ED, Chetrit A, et al. Vitamin K intake and sensitivity to warfarin in patients consuming regular diets. Thromb Haemost. 1999; 81:396–9.
6. De Assis MC, Rabelo ER, Avila CW, et al. Vitamin K guid-ed strategy: A randomizguid-ed controllguid-ed trial. Circulation. 2009; 120:1115–22. DOI: 10.1161/CIRCULATIONA-HA.109.849208.
7. Johnson JA, Gong L, Wirl-Carrillo M, Gage BF, et al. Clinical pharmacogenetics implementations Consortium Guidelines for CYP2C9 and VKORC1 genotypes and war-farin dosing. Clinical Pharmacology and Therapeutics. 2011; 90(4):625–9. DOI: 10.1038/clpt.2011.185.
8. Scone E, Avery P, Wynne H. Vitamin K supplementation can improve stability of anticoagulation for patients with unexpected variability in response to warfarin. Blood. 2007 Mar; 109 (6):2419–23.
9. Perera MA, Cavallari LH, Limdi NA, Gamazon ER, Konkashbaev A, Daneshjou R, Pluzhnikov A, Crawford DC, Wang J, Liu N, Tatonetti N, Bourgeois S, Takahashi H, Bradford Y, Burkley BM, Desnick RJ, Halperin JL, Khalifa SI, Langaee TY, Lubitz SA, Nutescu EA, Oetjens M, Shahin MH, Patel SR, Sagreiya H, Tector M, Weck KE, Rieder MJ, Scott SA, Wu AH, Burmester JK, Wadelius M, Deloukas P, Wagner MJ, Mushiroda T, Kubo M, Roden DM, Cox NJ,
variants associated with warfarin dose in African-Ameri-can individuals: A genome-wide association study. Lan-cet. 2013 Aug 31; 382(9894):790–6. DOI: 10.1016/S0140-6736(13)60681-9.
10. Parra J, Booton MR, Perini JA. Genome wide association study of warfarin maintenance dose in Brazilians sam-ple. Pharmacogenomics. 2015 Aug; 16(11):1253–63. DOI: 10.2217/PGS.15.73.
11. Syn NL, Lee SC, Brunham LR, Goh BC. Pharmacoge-netics versus clinical dosing of warfarin in individuals of Chinese and African–Americans ancestry. Pharmaco-genet Genomics. 2015; 25(10):491–500. DOI: 10.1097/ FPC.0000000000000165.
12. Dobon B, Hassan HY, Laayouni H, Luisi P, Ricano–Ponce I. The genetics of East African populations: A nilo-saharan component in the African genetic landscape. Scientific Re-ports; 2015. DOI: 10.1038/srep09996.
13. Jonson JA. Clinical pharmacogenetics implementation con-sortium guidelines for CYP2C9 and VKORC1 genotypes and warfarin dosing. Clin Pharmacol Ther. 2011 Sep. DOI: 10.1038/clpt.2011.
14. Wadelius M. Warfarin pharmacogenetics: It matters if you are black or white. Blood. 2014 Oct; 124 (14):2171.
15. Patillon B, Luis P. Positive selection in the chromosome 16 VKORC1 genomic regoins has contributed to the variabil-ity of anticoagulant response in humans. PlosOne. 2012; 7(12). DOI: 10.1371/journal.pone.0053049.
16. Wadellus M. Warfarin Pharmacogenetics: It matters if you’re black or white. Blood. 2014 Oct 2; 124(14):2171. 17. Sominsky S, Korostishevsky M. The VKORC1 variant and
haplotypes diversity in Ashkenazi and Ethiopian popula- tions. Appl Genet. 2014 May; 55(2):163–71. DOI: 10.1160/ TH12-10-0789.
18. Gan GG, Ming TA, Lee M. Allele and genotype frequencies of VKORC1-1639G>A polymorphism in three different ethnic groups in Malaysia. As Pac J Mol Bio Biotechnol. 2012; 20(1):19–23.
19. Mohammed HSH, Larisa H. VKORC1 geographic dis-tribu- tion and its impact on warfarin dose requirements in Egyptians. Thrombosis and Homeostasis. 2013 Jun; 109(6):1045–50. DOI: 10.1160/TH12-10-0789.
20. Yang L, Ge W, Yu F. Impact of vitamin KORC1 gene poly- morphism on inter-individual and interethnic warfarin dosage requirement. A systemic review and meta-analysis. Thrombosis and Haemostasis. 2010; 125(4):159–66. DOI: 10.1016/j.thromres.2009.10.017.
21. Fung E, Nicholas A, Stern M. Effect of genetic variants spe- cially CYP2C9 and VKORC1 on the pharmacology of warfarin. Thromb Hemost. 2012 Nov; 38(8):893–904. DOI: 10.1055/s-0032-1328891.
22. Warfarin resistance. Genetics Home Reference. US Nation-al Library of Medicine; 2016 Jun.
24. Rieder MJ, Reiner AP, Gage BF. Effect of VORC1 haplo- types on transcriptional regulation and warfarin dose. N Engl J Med. 2005; 352:2285–93.
25. Gil AK, Khan NM, Grover S. Genetic epidemiology of pharmacogenetics variation in CYP2C9, CYP4F2 and VKORC- 1genes with warfarin dosage in Indian popu-lation. Pharmacogenomics. 2014; 15(10):1337–54. DOI: 10.2217/pgs.14.88.
26. Yu Z, Ding YL, Lu. Warfarin dosage adjustment strategy in Chinese population. Int J Clin Exp Med. 2015 Jun15; 8(6):9904–10.
27. Tanira MO, AL-Mukhaini MK, Alhinai AT. Frequency of CYP2C9 among Omani patients receiving warfarin and its correlation with warfarin dose. Community Genetics. 2007; 10(1):32–7.
28. Kealey C, Chen Z, Christy J, et al. Warfarin and CYP2C9 genotype; possible ethnic variation in warfarin sensitivity. Pharmacogenomics. 2007; 8(3):217–25.
29. Shrif NE, Won H-H, Lee ST, Park JH, Kim KK, Kim MJ, Kim S, Lee SY, Ki CS, Osman IM, Rhman EA, Ali IA, Idris MN, Kim JW. Evaluation of the effects of VKORC1 and CY-P2C9 genotype and clinical factors on warfarin response in Sudanese patients. Eue Clin Pharmacol. 2011; 67(11):1119– 30. DOI: 10.1007/s00228-011-1060-1.
30. Nita A, Limidi MA, Wadellias, Cavallari L. Warfarin pharmacogenetics: A single VKORC1 polymorphism is predictive of dose across 3 racial groups. Blood. 2010; 115(18):3827–34. 10.1182/blood-2009-12-255992.
31. Garcia DD, Regan S, Growther M, et al. Warfarin mainte-nance dosing patterns in clinical practice implications for safer anticoagulation in elderly population. Chest. 2005; 127:2049–56.
32. Zuinali P, Souza GC, de Assis MCS. Dietary vitamin K intake and stability of anticoagulation with coumarins: Evidence derived from a clinical trial. Neutr Hosp. 2012; 27(60):1987–92. DOI: 10.3305/nh.2012.27.6.6068.
33. Wieloch M, Alander ASJ, Fryknan V. Anticoagulation con-trol in Sweden: Reports of time in therapeutic range, major bleeding and thromboembolic complications from national quality registry Auricul A Eur Heart J. 2011; 32(18):2282–9. DOI: 10.1093/eurheartj/ehr134.
34. Tomiha H, Kadokami T, Momii H, Kawamura M. Patient factors against stable control of warfarin therapy for Jap-anese non-valvular atrial fibrillation patients. Thromb Res. 2013 Nov; 132(5):537–42. DOI: 10.1016/j.throm-res.2013.09.003.
35. Maria H. Age and gender differences during long term war-farin therapy monitored with Fiix-prothrombin time in pa-tients with AF. Skemman . 2015 May. Available from: http// hdl.handle. net/1949/21520
36. Seliverstov I. Practical management approaches to anti-coagulation non-compliance, health literacy and limited English proficiency in outpatient clinic setting. J Thromb Thrombolysis. 2011Apr; 31(3):321–5. DOI: 10.1007/ s11239-011-0560-2.
37. Platt A, Alec B. Risk factors for non-adherence to warfarin: Results from the IN-RANGE study. Pharmacoepidemiol-ogy and Drug Safety. 2008; 17(9):853–60. DOI: 10.1002/ pds.1556.