International Journal of Advances in Management, Economics and Entrepreneurship
Available online at: www.ijamee.info
RESEARCH ARTICLE
Influence of Organizational Structure on the Quality Service of
Commercial Banks in Nandi County, Kenya
Kennedy Ntabo Otiso*
School of Business and Management Science, Department of Business Management University of Eldoret, Kenya.
*Corresponding Author: Email: [email protected]
Abstract: Achieving competitive advantage and improving organizational quality service have become the key goal that business firms are struggling to attain. This study therefore sought to investigate the influence of organisational structure on quality service of Commercial Banks in Nandi County, Kenya. The study was anchored on the Dynamic Capabilities Theory. The study adopted descriptive survey design. The study population comprised of all the licensed commercial banks in Nandi County, from which a representative sample of 10 commercial banks was drawn. Three (3) senior officers (branch manager, operations manager and customer relations manager) were further drawn from each of the sampled 10 commercial banks to make a total of 30 officers. The main study instrument was a questionnaire which comprised of Likert-type scale questions on the main variables of the study. The data was analyzed using both descriptive and inferential statistics. Hypothesis testing was done by use of regression and correlation analysis. Validity was checked during piloting to ensure all the items in the main study were functioning. Moreover, to ensure validity of instruments, content validity was established pilot testing process was used to test reliability comparing with Cronbach’s Coefficient of which yielded an alpha of 0.799. The findings revealed that organizational structure had statistically significant influence on quality service of commercial banks in Nandi County Kenya and tests for significance also showed that the influence was statistically significant. Findings revealed that 37.1 percent (R2=0.371). The regression results indicated that organizational structure had positive and
significant relationships with the quality service of commercial banks in Nandi County, Kenya. The study recommended that: the management of commercial banks should invest more in flexible organizational structures that facilitate decision making and improvement of communication through the reduction of boundaries. The managers of commercial banks will use the study findings as a basis of formulation of policies on strategy changes that can enhance their quality service. The academicians and researchers will find the study useful in that it contributes to academic literature and theory by providing empirical evidence for use by educators, scholars and researchers in the Survey of strategic management.
Keywords:Organizational structure, Quality service, Strategy, Commercial banks.
Article Received: 20 August 2018 Revised: 27 August 2018 Accepted: 30 August 2018
Introduction
According to Dammen [1]. A significant relationship exists between the structure of organization and overall levels of both trust and job satisfaction. Led better, investigated
the organizational structure on
organizational effectiveness in Texas Grand Prairie Fire Department. The results showed that environment, technology, size, strategy, goals, culture and philosophy impact on organizational structure and a definite connection is between organizational effectiveness and organizational structure.
Hao and colleagues, [2] studied about the relationship between organizational structure and performance, especially through organizational learning and innovation, based on evidence from Austria and China.
The findings have shown that in a hi-technology or knowledge intensive industry,
organizational structures affect
environment produces the most accurate results in the least amount of time. Kasrai and Alirahimi, [4] in an investigation which conducted in retirement organization in Iran, showed that there is a significant and negative relationship between complexity and effectiveness of communication. Also this result is similar to the relationship between centralization and effectiveness of communication. Zhang et al [5].
Studied the possible mediating role of knowledge management in the relationship between organizational culture, structure, strategy and organizational effectiveness .The results suggest that knowledge management fully mediates the impact of organizational culture on organizational effectiveness and partially mediates the impact of organizational structure and strategy on organizational effectiveness.
Lewis, [6] conducted a study in order to examine the effects a bureaucratic organization on communication capacity of management information system. The results identified traditional organizational structures create vertical and horizontal boundaries impeding communication.
The findings determined the critical aspects to improve communication through the reduction of boundaries was direct leadership support for a centralized management information system team with clear responsibility, accountability and authority to facilitate organizational communication. An investigation by Veisi, [7] conducted in the Refah Banks Branches in Kermanshah City found out that the positive relationship is between organic structure and participatory culture. Also there is significant relationship between mechanical structure and bureaucratic culture. Powley and Nissen, [8] examined the trust levels and organizational design on performance.
The results have shown that trust and organizational design have strong interactions and that hierarchical organizations experience performance levels well below flexible organizational structures. Powley and Nissen, [8] examined the trust levels and organizational design on performance. The results have shown that trust and organizational design have strong interactions and that hierarchical organizations experience performance levels
well below flexible organizational structures. Aghajani et al., [9] found the significant relationship between organizational structure and employee creativity in Saveh Pars Company.
Also the results have shown the significant relationship between the level of formalization, complexity, centralization and creativity of employee. Shaemi and colleagues, (2013) determined organization’s structure dimensions effect on organizational trust. They found that formalization, standardization, hierarchy of authority, centralization and professionalism dimensions had affected organizational trust and complexity, specialization, and employee ratio and management ratio dimensions didn’t affect organizational trust in this company.
This study is important because it shows how organic and mechanistic structures differentially affect individual’s perceptions within organizations. Other researchers have examined the direct mechanistic and organic organizational structures on employees’ behaviour and performance, for example, Bucic and Gudergan [11] operational zed key
pieces of Burn and Stalker’s,
conceptualization by focusing on the concepts of centralization and formalization. Bucic and Gudergan, [11] found that within medium to large organizations, high amounts of centralization had negative effects on a team’s level of creativity and learning. They also found that greater formalization had a negative impact on team learning.
They did not find a significant relationship between formalization and creativity. Therefore, it seems that implementing mechanistic structure negatively affected a team’s functioning. The size and scale of operations is a major determinant of the organizational structure. A restaurant business can afford to centralize its authority and decision making, but a large computers manufacturing firm cannot. As the business expands, it becomes mandatory to decentralize authority and departmentalize all important strategic functions. A large organization has different departments for different functions like marketing, production, finance and human resources (HR).
Each department takes care of its function, and later all chores are collated to form organizational tasks. Merce Bernardo. & Jose M. Castan, argues that the skills and educational qualifications of the employees also influence the choice of the type of the structure. A law firm would be constituted of attorneys. These individuals would have vast professional and educational expertise and experience. It would get very difficult to maintain authority over them at all times. They must be given a free hand to make their own decisions. Otherwise, there are chances of ego clashes between the employees and the management.
It is very easy to maintain authority over low-rung labourers. The types of technologies used by the organization also determine the type of organizational structure. A company that has automated its operations can choose to decentralize its authority. The systems would monitor progress of the employee
throughout. Hence, the task of the employee's immediate superior would be to provide guidance as and when required. Also, the type of technologies and systems used must be considered. The interdependence of the functions on the technologies must be assessed.
Materials and Methods
Research Design
According to Saunders, Lewis and Thornhill, [6] a research design is defined as an overall plan for research undertaking. For the purposes of this study, the researcher employed descriptive survey design. Descriptive survey design is an oriented methodology used to investigate populations by selecting samples to analyze and discover occurrences [12].
This design was appropriate since it is easier to sample a part of the population to gather data that can be generalized on the entire study population on the strategic alignment on quality service of Commercial Banks in Nandi County, Kenya. The design was chosen because of its relative cost effectiveness and the ability to bring an understanding of the entire population from a sample.
Target Population
The target population included those staff in management for the ten branches of commercial banks in Nandi County .The Branch Manager, Operations Manager and Customer Relations Manager, giving a target population of 30 respondents. Census method was undertaken as the population was below 100. This ensured adequate representation of the subjects of the study.
Sample Procedures and Sampling Size Purposive sampling method was employed in carrying out the study comprising of the branch managers, operational managers and Customer Relations Managers.
Data Collection Procedure
The data collection instrument in this study was a questionnaire. The research instrument was conveyed to the respondents through the drop and pick technique. The researcher approached each Commercial Bank Branch, introduced himself to the relevant respondents by explaining to them the nature and purpose of the study and then left the questionnaires with the respondents for completion and picked later after two weeks. Before the questionnaires were given out, the researcher first sought for authorization from the particular Commercial Bank Branch management to collect data. A covering letter explaining the objectives of the study and assuring the respondents’ confidentiality and asking them to participate in the study accompanied the questionnaire.
Respondents were asked to willingly participate in the survey and give the data. Respondents were required to fill the questionnaires that included responses on strategic alignment on quality service as well as the demographic information. Ghauri and Gronhaug narrate that questionnaire method was an inexpensive method for data collection. The use of questionnaire had many advantages which were as follows: they had standard questions which could be administered to a large number of respondents within a short time and at a minimal cost. Respondents were assured of anonymity and confidentiality and they were able to complete the questionnaires when it was convenient and at their own time.
Data Collection Instruments
The study used both primary and secondary data collection sources as follows:
Primary Data
The primary data was collected through a self-administered semi- structured questionnaire using the key-informant method. Wu, explains that views of key informants were widely used in marketing studies because they were deemed to be the most knowledgeable about the issues being investigated for which they were directly responsible. The structured questionnaire was with closed- ended questions and a customized five-part Likert scale which was used to collect data on the independent variables from the managers.
Respondents were asked to indicate agreement with each item. Each item had a five-point scale ranging from1=strongly disagree, 2=disagree, 3=indifferent, 4=agree, and 5=strongly agree. The managers that were targeted were informed about the purpose of the study.
The questionnaires had been preferred because personal administration of questionnaires to individuals helped to develop close relationships with the respondents. The questionnaire also provided the clarifications sought by respondents on the spot by collecting the questionnaires soon after they were filled. The data collected was edited to ensure consistency across respondents and detected omissions.
According to Patton [13], a researcher addressed the design of the study and analysis of the results so that the research could hold quality test and this could be done through reliability. De Vaus, [14] notes that reliability is the ability of the questionnaire to give the same answer in the same circumstances from time to time. This implies that if respondents answer a questionnaire the same way on repeated situations, then the questionnaire is said to be reliable.
Secondary Data
Information relating to the Commercial Bank Branch in annual and published financial statements, strategic plans, corporate annual reports, and Organizational structures were used to provide secondary data information on relevant indicators and cross validate the primary data collected.
Validity and Reliability of the Research Instruments
Validity
Meaning the questions in the questionnaire must give adequate answers to the research questions of the study. The process of developing and validating an instrument was largely focused to reduce error in the measurement process. To establish the validity of the research instrument the researcher sought for the opinions of experts in the Survey of study especially the researcher's supervisor. This facilitated the necessary revision and modification of the research instrument thereby enhancing validity.
Reliability of the Research Instrument The researcher carried out a pilot study to pre-test the reliability and validity of the questionnaire. One bank was selected for pilot study thus leaving a total of 10 banks for actual data collection and analysis. This was done within a span of two weeks.
To establish the validity of the research instrument the researcher sought opinions of experts in the Survey of study especially the researcher’s supervisor. This facilitated the necessary revision and modification of the research instrument thereby enhancing validity. Respondents in the pretest was drawn from one commercial bank with three respondents, that is, 10% of the sample size as per recommendations by Mugenda and Mugenda[16] who observe that a successful pilot study used 1% to 10% of the actual
sample size and this was similar to those in the actual survey in terms of background characteristics.
Basing on Mugenda and Mugenda[16] recommendations, the researcher set three pilot questionnaires representing 9% of the sample size and which was within the range of 1%-10% and gave to the managers of commercial bank. The purpose was to refine the questionnaire so that respondents in the major study have no problem in answering the questions. Cronbach alpha, which is a measure of internal consistency, was used to test the internal reliability of the measurement instrument.
The higher the score, the more reliable the generated scale. Nunnaly, [17] has indicated 0.7 to be an acceptable reliability. Thus it was considered adequate for this study. Based on the feedback from the pilot test, the questionnaire was modified and a final one developed. Table 3.1 below shows that all the scales were significant having an alpha above the prescribed threshold of 0.7. Customer relationship management system had the highest reliability (α=0.933) followed by organisational structure (α=0.807), then technological innovation (α=0.747), while Quality Service had the lower α level at (α=0.712). The study thus found the analysis reliable and could be used for further investigation.
Table 3.1: Reliability Coefficients
Scale Cronbach's Alpha No. of Items
Organizational structure 0.807 3
Quality Service 0.712 4
Source: Pilot Study, 2016
Data Analysis
The quantitative data was edited and coded into Statistical Package for Social Sciences (SPSS) for analysis. SPSS generated descriptive statistics such as frequencies, mean and standard deviation. The data was presented in tables. The qualitative data was analysed by means of content analysis. Content analysis is a methodology in the social sciences for studying the content of communication.
According to Holsti, content analysis is used to make inferences about the antecedents of a communication, to describe and make inferences about characteristics of a communication and to make inferences about the effects of a communication. The study adopted the multiple regression models to
establish the effect of strategic alignment on quality service of Commercial Banks in Nandi County, Kenya. According to Katz (2006) regression analysis generates an equation to describe the statistical relationship between one or more predictor variables and the response variable.
Y= a0 + a3X3 + e
Where:
Y = Dependent variable (Quality Service) a0 = Constant term
X3 = Organisational Structure (Independent variable 3) aί, = Coefficients of the variable X3
e = Error term (standard error)
The researcher intended to use the above model to ascertain the causal effect Organizational Structure on Quality Service. The researcher typically assessed the statistical significance of the estimated relationships, that is, the degree of confidence that the true relationship is close to the estimated relationship.
Statistical Package for Social Sciences (SPSS) was used to generate multiple linear regression statistics. Positive coefficients of the independent variables denoted direct relationship between the dependent and independent variables. Negative coefficients of the independent variables denoted inverse relationship between the dependent and independent variables.
Analysis, Presentations and
Interpretations Response Rate
The target population for the study was 30 managers. These included three managers from each of the Commercial Banks in Nandi County, Kenya. The sample was picked on the basis of the Central Limit Theorem in statistical theory which implies that any sample equal to or greater than 30 is representative enough irrespective of the population size. The sample size was taken to be 30 all of which returned fully filled giving a response rate of 100%. The response rate of at least 90 % was considered a good rate according to Saunders et al. (2007). Thus a response rate of 100% was appropriate for the study. This is as tabulated in Table 4.1below.
Table 4.1: Response rate
Questionnaires Frequency Percentage (%)
Returned 30 100
Unreturned 00 00
Distributed 30 100
Source: Survey data, 2016
Gender of the Respondents
The first question on the questionnaire was to establish the gender of the respondents. The study established that the 73.3% of respondents were male while female were
26.7%. It depicts therefore that Commercial Banks in Nandi employs both genders as shown in the Table4.2 below
Table 4.2: Gender of the respondents
Frequency Percent Valid Percent Cumulative Percent
Valid male 22 73.3 73.3 73.3
female 8 26.7 26.7 100.0
Total 30 100.0 100.0
Source: Survey data, 2016
Age of the Respondents
The second question was on the age bracket that best describes the age of the respondents. From the results, 5 respondents which is equivalent to 16.7% were in the age bracket of between 18 years and 24 years, 10 respondents which is equivalent to 33.3% were between 25 years and 34 years, 12
respondents which is equivalent to 40.0% were between 35 years and 47 years while the remaining 3 respondents, which is equivalent to 10.0% were 48 years and above. From the results, majority of the respondents were 35 years and above as shown in the Table 4.3 below
Table 4.3: Age bracket of the respondents
Age bracket Frequency Percent Valid Percent Cumulative Percent
Valid
18-24 years 5 16.7 16.7 16.7
25-34 years 10 33.3 33.3 50.0
35-47 years 12 40.0 40.0 90.0
Above 48 years 3 10.0 10.0 100.0
Total 30 100.0 100.0
Experience of the Respondents
The third question was on the number of years worked with the bank. From the results, 8 respondents representing 26.7% indicated that they had worked in the organization between 3-5 years, while 22 respondents representing 73.3% had worked
for a period above 5 years. This shows that most of the selected respondents had a wealth of experience and were therefore able to give dependable responses to the questions asked as shown in the Table4.4 below.
Table 4.4: Experience of the Respondents
Frequency Percent Valid Percent Cumulative Percent
Valid 3-5 years 8 26.7 26.7 26.7
Above 5 years 22 73.3 73.3 100.0
Total 30 100.0 100.0
Source: Survey data, 2016
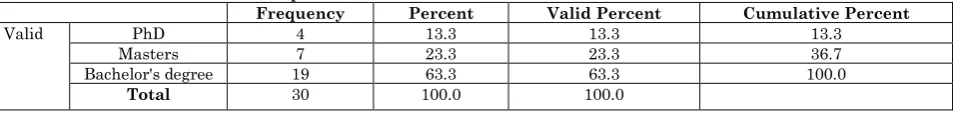
Level of Education of the Respondents The other question from the respondents was to establish their level of education. The results indicated that 4 respondents which was equivalent to 13.3% respondents had PhD education, 7 respondents which was equivalent to 23.3% had Masters Education, while the remaining 19 respondents, which
was equivalent to 63.3% of the respondents, had Bachelor’s Degree. The results therefore indicate that majority of the respondents had enough education background to fill and respond to the questions risen. The results were as displayed in Table 4.5below.
Table 4.5: Level of Education of the respondents
Frequency Percent Valid Percent Cumulative Percent
Valid PhD 4 13.3 13.3 13.3
Masters 7 23.3 23.3 36.7
Bachelor's degree 19 63.3 63.3 100.0
Total 30 100.0 100.0
Source: Survey data, 2016
Descriptive Analysis
Descriptive Statistics for Organizational Structure
To determine whether the Organizational Structure had any effect on quality service, respondents were required to state their level of agreement with three statements relating
to Organizational Structure and Quality Service in Commercial Banks in Nandi County where; 1= Strongly Disagree, 2= Disagree, 3= Neutral, 4= Agree, 5= Strongly Agree. The Relevant results are as shown in Table 4.8.
Table 4.8: Descriptive Statistics of Organizational Structure
ITEMS SD
(%) (%) D (%) N (%) A (%) SA
The current structure has allocation of responsibilities
7 (23.3)
0 (0.0)
1 (3.3)
18 (60.0)
4 (13.3) Current organization structure allow decision
making process (40.0) 12 (0.0) 0 (10.0) 3 (30.0) 9 (20.0) 6
There are clear Standard operating procedures and routines
7 (23.3)
0 (0.0)
1 (3.3)
18 (60.0)
4 (13.3) From Table 4.8, 18(60.0%) of the respondents agreed and 7(23.3%) strongly disagreed that their commercial banks structure has allocation of responsibilities (Mean=3.4000, SD=1.40443). Further, 12(40.0%) strongly disagreed and 9(30.0%) agreed that commercial banks organization structure allow decision making process (Mean=2.900, SD=1.66816). The findings also revealed that 18(60.0%) of the respondents agreed and 7(23.3%) strongly disagreed that their commercial banks had clear Standard operating procedures and routines (Mean=3.4000, SD=1.40443).
Correlation Analysis
Correlation analysis by means of Pearson Product Moment Correlation Coefficient technique was used to determine nature and magnitude of the relationships between variables. Correlation coefficients ranging from 0.00 to 0.01 represent no correlation, those ranging from 0.02-0.029 represent weak correlation, 0.30-0.69 represent
variables was equal, greater than or less than the population of each predictor variable.
The closer r2 is to 1, the better the fit of the regression line to data. The results are presented in Table 4.9
Table 4.9: Correlation of the construct that build up dependent variable Correlations
1 2 3 4
Sig. (2-tailed) .000 .000 .000
N 30 30 30 30
Organizational Structure
Pearson Correlation .750** .721** 1 .609**
Sig. (2-tailed) .000 .000 .000
N 30 30 30 30
Quality Service
Pearson Correlation .598** .902** .609** 1
Sig. (2-tailed) .000 .000 .000
N 30 30 30 30
**. Correlation is significant at the 0.01 level (2-tailed).
From the results in Table 4.9 above, there exist statistically significant correlations amongst the constructs that build up quality service of Commercial Banks in Nandi County Kenya. This implies that at any point when the independent variable was having an effect on quality service, the effect was positive and it was being spread across the variables though the degree of effect was different amongst the variables.
Regression Analysis
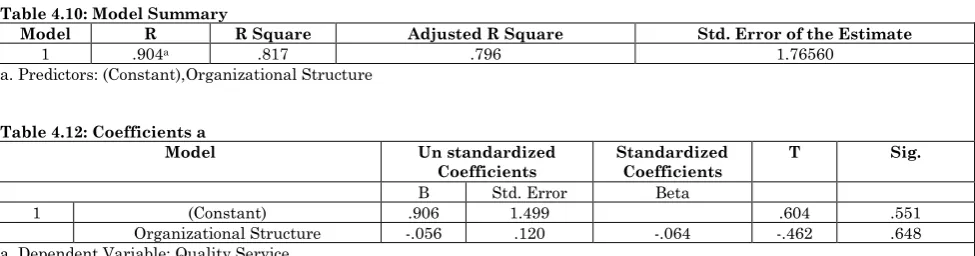
Table 4.10: Model Summary
Model R R Square Adjusted R Square Std. Error of the Estimate
1 .904a .817 .796 1.76560
a. Predictors: (Constant),Organizational Structure
Table 4.12: Coefficients a
Model Un standardized Coefficients
Standardized Coefficients
T Sig.
B Std. Error Beta
1 (Constant) .906 1.499 .604 .551
Organizational Structure -.056 .120 -.064 -.462 .648
a. Dependent Variable: Quality Service
Coefficient of determination explains the extent to which changes in the dependent variable can be explained by the change in the independent variables or the percentage of variation in the dependent variable Quality Service that is explained by Organizational Structure. The three independent variables that were studied, explain 81.7% of variance in Quality Service as represented by the R2. This therefore means that other factors not studied in this research contribute 18.3 % of variance in the dependent variable.
The P-value of 0.000 implies that Quality Service among Commercial Banks in Nandi, Kenya has a significant joint relationship with Organizational Structure which is significant at 0.05 confidence level.
This implies that the regression model is significant and can thus be used to assess the association between the dependent and independent variables. According to Gelman [19], ANOVA statistics analyzes the differences between group means and their associated procedures (such as "variation"
among and between groups). From the regression findings, the substitution of the equation (Y= a0 + a3X3 + e) becomes: Y= 0. 906+ .736X3 Where Y is the dependent variable (Quality Service), X3 is Organizational Structure. The data findings also show that a unit increase in Organizational Structure variable will lead to a 0.056 increase in Quality Service.
Influence of Organizational Structure on the Quality Service of Commercial Banks in Nandi County
The first objective of the study was to assess the effect of organizational structure on the quality service of Commercial Banks in Nandi County. The study used the correlation r (beta, β) to test the research hypothesis.
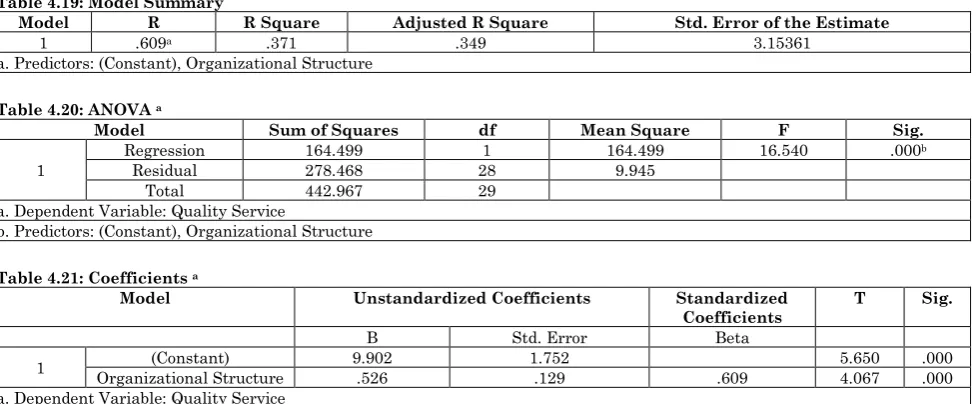
Table 4.19: Model Summary
Model R R Square Adjusted R Square Std. Error of the Estimate
1 .609a .371 .349 3.15361
a. Predictors: (Constant), Organizational Structure
Table 4.20: ANOVA a
Model Sum of Squares df Mean Square F Sig.
1
Regression 164.499 1 164.499 16.540 .000b
Residual 278.468 28 9.945
Total 442.967 29
a. Dependent Variable: Quality Service
b. Predictors: (Constant), Organizational Structure
Table 4.21: Coefficients a
Model Unstandardized Coefficients Standardized
Coefficients T Sig.
B Std. Error Beta
1 (Constant) 9.902 1.752 5.650 .000
Organizational Structure .526 .129 .609 4.067 .000
a. Dependent Variable: Quality Service
From Table 4.19 above, the correlation of the mean of organizational structure and mean of quality service had a beta term β = 0.609, P=0.01. This implies that the value of beta is positive and significant. Basing on this value, it therefore implies that there exists a statistically significant positive assess the effect of organizational structure on the quality service of Commercial Banks in Nandi County.
From the results, 37.1% of quality service of Commercial Banks in Nandi County can be explained by organizational structure (r2 = 0.371) and the relationship followed a simple regression model of the nature P= α + β3OS +e where P is the quality service of Commercial Banks, α is the constant intercept of which in our case is 9.902and beta β3= 0.609, which at times is referred to as the slope coefficient, OS is the organizational structure and ԑ is the standard error term which in this case is 3.15361. The results are in agreement with the findings of Hellgren and Sverke [20], who asserts that there are no absolute standards against which an organization structure can be judged.
There is never one right way of organizing anything and there are no absolute principles that govern organizational choice. Further The study conducted by Michieka & Ogollah, (2013) on the role of organizational design on the performance of commercial banks: A case of National Bank of Kenya agrees that organization structure involves how programs and tasks are coordinated and what are the tools or mechanisms used to coordinate and that an organization structure must be aligned to put the strategy
into effect or else quality service could be compromised. Organization structure covers responsibility and authority; job definition and description; and line of command.
Summary, Conclusions and
Recommendations
Summary of the Findings
From the preliminary findings, the study established that the 73.3% of respondents were male while female were 26.7% respondents. The results also indicated that, 5 respondents which is equivalent to 16.7% were in the age bracket of between 18 years and 24 years, 10 respondents which is equivalent to 33.3% were between 25 years and 34 years, 12 respondents which is equivalent to 40.0% were between 35 years and 47 years while the remaining 3 respondents, which is equivalent to 10.0% were 48 years and above.
From the results, majority of the respondents were 35 years and above. From the results, 8 respondents representing 26.7% indicated that they had worked in the organization between 3-5 years, while 22 respondents representing 73.3% had worked for a period above 5 years. This shows that most of the selected respondents had a wealth of experience and were therefore able to give dependable responses to the questions asked. The level of education has been cited as a critical success factor in helping firms survive and manage in difficult conditions and to improve business profitability (Sabana, 2014).
equivalent to 23.3% had Masters Education, while the remaining 19 respondents, which was equivalent to 63.3% of the respondents, had Bachelor’s Degree. The results therefore indicate that majority of the respondents had enough education background to fill and respond to the questions risen. To test the specific research objective, simple regression analysis beta (β), this is equivalent to the Karl Pearson correlation coefficient (r) was used [21-24].
The test was done at 0.05 % significance level, with 95% confidence, which is acceptable in non–clinical research works. The objective of the study was to assess the influence of organizational structure on the quality service of Commercial Banks in Nandi County, Kenya. The study used the correlation r (beta, β) to test the research hypothesis. The test criteria was set such that there is either a positive or negative effect if the value of beta, β3≠0.
The mean of organizational structure was correlated with mean of quality service of Commercial Banks. The correlation of the mean of organizational structure and mean of quality service had a beta term β = 0.609, P=0.01. This implies that the value of beta is positive and significant. Basing on this value, it therefore implies that there exists a statistically significant positive assess the effect of organizational structure on the quality service of Commercial Banks in Nandi County.
From the results, 37.1% of quality service of Commercial Banks in Nandi county can be explained by organizational structure (r2 = 0.371) and the relationship followed a simple regression model of the nature P= α + β3OS +e where P is the quality service of Commercial Banks, α is the constant intercept of which in our case is 9.902and beta β3= 0.609, which at times is referred to as the slope coefficient, OS is the organizational structure and ԑ is the standard error term which in this case is 3.15361.
Conclusions of the Study
In assessing the influence of organizational structure on the quality service of Commercial Banks in Nandi County, Kenya.
The results therefore showed that there exists a statistically significant positive effect of organizational structure on the quality service of Commercial Banks in Nandi County, Kenya. The study therefore concluded that organizational structure has significant effect on quality service of Commercial Banks in Nandi County, Kenya Recommendations
The following suggestions were made for further research based on the findings of this
study. The following were the
recommendations derived from the study findings:
The management of commercial banks should invest more in technological innovations to ensure all the banking operations are informational technologically compliant. This is strengthened by the fact that those banks which use financial innovations have had very positive impacts on the quality service of the banks. Furthermore, for the banks to be highly competitive, they need to intensify more use of modern technological innovations such as internet based banking services.
Technology is one of the key elements that define a society or civilization. Lastly, there was need of flexible organizational structures that facilitate decision making and improvement of communication through the reduction of boundaries. Furthermore, organization structure should be strengthened to proactively engage in different organizational structural matrix that will best suit its needs.
Suggestions for Further Research
References
1. Dammen KJ (2001) The Effects of Organizational Structure on Employee Trust and Job satisfaction, A Research Paper, University of Wisconsin – Stout.
2. Hao Q, Kasper H, Muehlbacher J (2007) How Does Organizational Structure Influence Performance through Learning and Innovation in Austria and China? “Chinese Management Studies”, 6(1).
3. Seykora JT (2009) Analysis of the Relationships among Trust Antecedents, Organizational Structures and Performance Outcomes, Working Paper, Naval Postgraduate School.
4. Kasrai AR, Alirahimi MM (2009) The Investigation of Relationship Between Organizational Structure and Effectiveness in Retirement Organization, “Journal of Basirat”, 44.
5. Zhang W, Yang B, Mclean GN (2010) Linking Organizational Culture, Structure.
6. Saunders M, Lewis P, Thornhill A (2009) Research Methods for business students 4th edition Pearson education limited (P) Ltd. 7. Veisi M, Veisi K, Hasanvand H (2012) The
Organizational Culture on Organizational Structure: Case Study of Refah Banks Branches in Kermanshah City, “Journal of Basic and Applied Scientific Research”, 2(4).
8. Powley EH, Nissen ME (2012) If You Can’t Trust, Stick to Hierarchy: Structure and Trust as Contingency Factors in Threat Assessment Contexts, “Journal of Homeland
Security and Emergency Management”, 9 (1). 9. Aghajani Hashjeen T, Shoghi B, Shafizadeh R,
Eisapour H (2013) The Relationship Between Organizational Structure and Employee Creativity, “Australian Journal of Basic and Applied Science”, 7(2).
10. Cohen-Charash Y, Spector PE (2001) The role of justice in organizations: A meta-analysis. Organizational Behaviour and Human Decisions Processes, 86: 278-321.
11. Bucic T, Gudergan SP (2004) The impact of organizational settings on creativity
and learning in alliances. Management, 7: 257-273.
12. Oso WK, Onen D (2009) A general guide to writing research proposal and report: A handbook for beginning researchers. Nairobi: Jomo Kenyatta Foundation.
13. Patton MQ (2002) Qualitative Research and Evaluation Methods. California, United States of America: Sage Publications, Inc. 14. De Vaus D (2002) Analyzing Social Science
Data. SAGE Publications, London.
15. Mugenda MO, Mugenda GA (1999) Research methods: quantitative and Qualitative approaches. African Centre for Technology Studies.
16. Manyara MK (2003) The Development of Co-operative Law and Policy in Kenya. Nairobi: Oscan Print.
17. Nunnally JC (1978) Psychometric theory, McGraw-Hill, New York.
18. Howell P, Huckvale M (2002) Facilities to assist people to research into stammered speech. Stammering Research, 1: 130-242. 19. Gelman, (2006) Review of Regression Analysis:
A Constructive Critique, by R. Berk. Criminal Justice Review.
20. Hellgren J Sverke M (2003) Does job insecurity lead to impaired well-being or vice versa? Stimation of cross-lagged effects using latent variable modelling .Journal of Organizational Behaviour, 24: 215-236
21. Sekaran (2003) Research method for business: A skill building approach, 4th edition, John Wiley & Sons.
22. Zikmund W (2003) Business Research Methods, (7th Ed.). Oklahoma City: Oklahoma State University.
23. Thornhill A (2009) Research Methods for Business Students (5thed.). Prentice Hall: London.