International Journal of Advances in Management and Economics
Available online at:
www.managementjournal.info
RESEARCH ARTICLE
Analysis of the Effect of Trade Balance on Manufacturing:
Evidence from the United States
Assandé D. Adom
Department of Economics, Eastern Illinois University.
Abstract: The relationship between a country’s manufacturing industry and net trade carries a great deal of complexity and proves critical as the economy matures. Moreover, debates in public arenas are oftentimes not helpful in alleviating confusions. This study attempts to empirically explore the nature of this relationship for the United States in particular. Using a set of structural vector auto-regressions, it reveals that the development of the manufacturing sector is inhibited in the long-run by worsening trade balances. However, this relationship does not appear significant. The implication of this finding weakens arguments singling out negative trade balances as driving forces behind the perceived woes of US manufacturing.
Keywords: Manufacturing, Trade balance, United States, Cointegration, Vector auto-regression.
JEL Classification: F14, F60, C51.
Article Received: 29 March 2020 Revised: 19 April 2020 Accepted: 27 April 2020
Introduction
The history of economic thoughts is replete with discourses pertaining to the topic of international trade. These debates have ranged from heralding the virtues of trade to highlighting its prejudicial repercussions upon an industry or group of industries in an economy. Put differently, trade has been described in some instances as a zero-sum game as opposed to a positive-sum game.
Even before the ubiquitous influences of Adam Smith and David Ricardo, trade was a popular topic in the field of Economics. Since the end of World War II, nations have partaken in multiple and common efforts to promote an international framework for free trade from the General Agreement of Trade and Tariffs (GATT) to the inception of the World Trade Organization (WTO). Recent political and economic developments have ushered in some new reflections regarding trade, thereby setting the stage for a renewed interest in that topic.
Trade has contributed to the prosperity of many developed and developing countries by fostering the creation of riches across society in general. Trade affects directly or indirectly every industry in the economy. As a result, it
is not uncommon at times to have some voices raising concerns, from the layman on Main Street to businesses and other decision-makers and stakeholders regarding its effects on the domestic manufacturing sector in particular. This sector is the subject matter of much attention in a country, for it represents in umpteen ways the repository of know-how along with technological achievements accumulated by that country’s workforce over time.
Considering that trade involves both imports and exports, an accurate picture of a country’s overall position is derived through the trade balance or net trade. A country’s manufacturing sector and net trade every so often have a relationship that can experience a great deal of complexity as the economy matures.
the nature of the relationship between a country’s net trade and its manufacturing sector. It is accomplished with a focus on developed nations in general and the United States (US) specifically.
According to the World Trade Organization (WTO) and the United Nations Conference on Trade and Development (UNCTAD), world merchandise trade ballooned to US$15.4 trillion in 2016 from about US$11.7 trillion in 2006. A closer look reveals that in 1980, global trade merchandise hovered around US$2.03 trillion, while reaching a massive US$18 trillion in 2017. Today, developed nations account for about 53% of global trade, down from 66% in 1980.
The relevance of this research work is two-fold. First, it brings some elements of answer to the current debate in the US regarding the longstanding views, carried at various degrees by both sides of the aisle, that negative net trade threatens manufacturing jobs or ships out said jobs overseas. Second, findings can help decision-makers and international organizations design and calibrate policies to control the effects of net trade on the manufacturing base, and the economy as a whole. To be more precise, this project endeavors to isolate such effects by assessing their impacts on a country’s manufacturing sector.
As we progress, the paper is organized in five parts. The second part discusses the literature review followed by the methodology in the third. The fourth part covers findings and their policy implications. At last, concluding remarks are drawn in the fifth part.
Literature Review
The importance of the manufacturing sector in a country cannot be overstated. This is even more so for a developed nation like the United States ̶ the world largest economy. Indeed, the US was the preeminent hub for manufactured goods in terms of value added from the 1940’s until 2011, when she was overtaken by China1. A variety of studies have taken a closer look at the state and
1Baily and Bosworth (2014) reckon the year 2010.
However, data from the World Development Indicators
(WDI), published by The World Bank Group, rather suggest the year 2011 both in constant and current US dollar.
transformation of US manufacturing and its relationship with net trade. Baily and Bosworth [1] indicate some areas of concerns for US manufacturing. First, the industry has enjoyed steady productivity growth. However, it is overwhelmingly driven by performances in computers and electronics subsectors. This lopsided situation does not constitute a sound scenario for the manufacturing sector to sustainably thrive in the long-run. Second, employment in this sector substantially shrank by more than 5.7 million between 2000 and 2010. Third, a staggering trade deficit, impelled by trade with Asia, which reached $460 billion in 2012, down from $542 billion in 20052.
In the debate regarding how to improve the outlook of US manufacturing, some authors have proposed concrete ways to reinvigorate this sector. Evan et al. [2], among others, acknowledge that the US manufacturing industry has lost some ground over time. They recommend a set of four comprehensive policies to reverse this trend. These policies include (i) eliminating any tax deferral, (ii) linking the R&D tax credit to US manufacturing, (iii) taxing US and non-US corporations based upon their proportion of US sales vs. non-US sales, and (iv) establishing an alternative minimum corporate tax (AMCT). As far as the latter policy is concerned, it will be akin to the alternative minimum tax mechanism extended to individuals.
Despite
many signs suggesting that the US manufacturing industry is in a delicate situation due to a changing international context, there are reasons to strike a brighter note. Case in point, Euromoney Institutional Investor PLC [3] noted in 2014 that the US was experiencing what they characterized as an unprecedented revival. In order to support their argument, they revealed, among other things, that US manufacturing expanded by 2.4% in 2013, amounting to an all-time high of $2.3 trillion. Moreover, they noted that this expansion would be accompanied by new jobs in the hundreds of thousands, even 1.2 million, by the 2020 horizon.Levinson [4] observes that the US economy remained sluggish for years in the aftermath
2
of the 2008 financial crisis. He argues that this sluggishness cannot be durably overcome without revitalizing the US manufacturing sector, which has been showing notable signs of a slowdown for decades.
As a matter of fact, he articulates that manufacturing jobs have registered their lowest level since the 1940s. He identifies four major features in US manufacturing. First, it is a source of well-paid jobs regardless of the level of education. Second, it is a fundamental driver of innovations. Third, it is a crucial means to reducing trade deficits, and, at last, it is a key source of indirect job creations in other industries. In other developed countries, some authors have explored as well the link between trade, domestic manufacturing and job creation. For instance, Dauth et al. [5] examine the sources of the decline in manufacturing employment in Germany. Their findings connote that international trade was not a determining factor for this decline. It contributed instead to preserve and protect manufacturing jobs. Overall, choices made by entrants and reentrants in the job market away from manufacturing entirely caused the declining trend in job creation across this sector.
In the same line of thoughts, Cravino and Sotelo [6] carry out a worldwide analysis to understand the effects of international trade on manufacturing employment. Using a quantitative trade model, the authors establish that trade exerts a negative impact on both manufacturing job creation and the relative wage of unskilled workers. However, they reveal that the increase or impact on the skill premium was higher in developing countries owing to the fact that the manufacturing sector is mainly unskilled-labor intensive.
From another perspective, it is a fact that the literature is not rich in studies regarding the relationship between net trade and manufacturing in developing countries. However, one study has drawn attention regarding India. Chaudhuri [7] lays stress on the manufacturing trade deficit in India and the role played by industrial policies. He singles out ineffective reforms in the 1990s, or lack thereof, as chief reasons why manufacturing trade deficit has been worsening since the early 2000s. He explains that reforms were actually geared towards favoring foreign manufacturing firms from
developed economies rather than domestic ones. He continues with a warning and asserts that this situation could lead to an economic crisis if not corrected. Wong et al. [8] use a broader set of 10 developing economies to look into the impact of the ASEAN free trade area on manufacturing in member countries. One major conclusion implied by empirical results is that manufacturing in the region was bolstered by the creation of this free trade area.
Methodology
To probe the nature of the relationship between the US manufacturing and net trade, the methodology of this research work starts with the following general model:
MAN = Man (NT, OUT, FDI, ER) (1)
where MAN, NT, OUT, FDI, and ER respectively represent the manufacturing base, net trade, output or real gross domestic product, foreign direct investment, and exchange rate. The relationship between the manufacturing sector in the US and its determinants is represented in a vector auto-regressive format:
Yt = εt (2)
Y is a (5x1) vector of variables including MAN, NT, OUT, FDI, and ER. Disturbances are captured by a vector ε of order (5x1). Any given time period is captured by t, and q is the order of the auto-regressive system. In practice, the empirical process is built around three main steps. In the first, descriptive statistics are derived for the dataset. Then, stationarity is checked for all series using the Dickey-Fuller (DF), Augmented Dickey Fuller (ADF), and Philip Perron (PP)3. These three tests are conducted to ensure an accurate assessment of unit roots in series. In the third step, this study inquires about the existence of long-run relationships between variables using the cointegration procedure developed by Johansen [10].
Data and Results
DataData are derived from two main sources, namely, the United Nations Conference on
3
Trade and Development Statistics (UNCTADStat) and the World Development Indicators (WDI) of The World Bank Group. Five series spanning from 1995 to 2017 are collected: (i) value added growth in the manufacturing sector (MANVAGRW), (ii) net trade (NT), (iii) output or real gross domestic
product (RGDP), (iv) net foreign direct investment (NFDI), and (v) real effective exchange rate (REER).
Table 1 offers a glance at descriptive statistics with the mean, median, maximum, minimum, standard deviation, and number of observations of each series.
Table 1: Descriptive statistics
MANVAGRW NT RGDP NFDI REER
Mean 2.910562 -6.19E+11 1.42E+13 -2.032E+10 1.09E+02
Median 2.226099 -7.11E+11 1.47E+13 -3.33E+10 1.09E+02
Maximum 11.28238 -1.86E+11 1.74E+13 2.032E+11 1.24E+02
Minimum -7.749833 -8.90E+11 1.04E+13 -1.776E+11 9.51E+01
Std. Dev. 4.462927 2.42E+11 2.00E+12 1.1062E+11 8.66E+00
Observations 23 23 23 23 23
Note: MANVAGRW is in percentage terms. NT, RGDP, and NFDI are expressed in United States Dollar. REER is an index, and an increase signals an appreciation of the US$.
Results
Unit root tests are reported in Table 2, which shows that most series, namely NFDI, NT, and RGDP, are I(1) at either the 5 or 1 percent significance levels, whereas MANVAGRW is found to be I(0) at the 5 percent significance level. An exception can be noted for REER where stationarity is detected in level using an ADF procedure with an intercept at the 10 percent significance level. However, the PP test with an intercept exhibits stationarity in first difference at the 5 percent significance level.
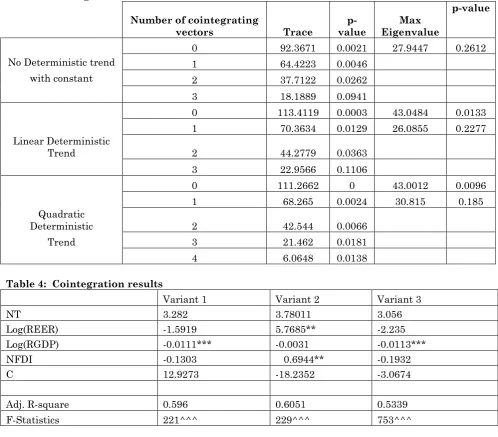
The ADF and PP procedures with an intercept confirm stationarity in level and first difference, respectively, at 10 and 5 percent significance levels. Cointegration tests reveal the existence of cointegrating vectors, as documented in Table 3. For these tests, three configurations are considered. In a first configuration, using a constant but no deterministic trend, trace statistics confirms three cointegrating vectors, while maximum eigenvalue statistics identifies none. Second, when a linear deterministic trend is used, both trace and maximum eigenvalue statistics uncover three and one cointegrating vectors, respectively. At last, with a quadratic deterministic trend, there are four cointegrating vectors according to trace statistics, whereas maximum eigenvalue denotes one. For completeness sake and to provide the reader with as much relevant information as possible, this study relays all standardized cointegrating
vectors through three distinct variants. Furthermore, such approach helps resist the temptation of cherry picking a vector that fits a particular narrative. Table 4 outlines the results from variants depicting the set of possible long-run relationships. It comes out that net trade remains positively related to growth of the manufacturing sector in the US regardless of the variant considered. However, none of these estimates remain significant at the standard levels of 1%, 5% or 10%4. This finding is the most important of this analysis as it brings forth some elements of response to the overriding question of this investigation. A deteriorating US trade balance slows down the pace of expansion in the manufacturing sector or contracts this sector altogether. In other words, the development of the manufacturing sector is inhibited in the long-run by worsening trade balances. Although significance levels associated with net trade in all variants are outside the customarily accepted range noted above, rationales for such a complex relationship can be found in economic theory. Indeed, the compositions of US exports have structurally changed over the past four decades or so.
According to the UNCTADStat, services have noticeably increased their share of US total trade from about 26% in 1995 to close
to 34% in 20175 (See Figure 1). Such an expansion has been achieved at the expenses of the traditional manufacturing sector where the US has been losing its comparative advantage to low-cost countries in Asia, Central and Latin America that have increased their knowledge base and moved up the learning and production ladders. This structural change of the US economy lends support as well to the negative relationship between the expansion of economic activities and growth in value-added generated by the manufacturing sector. All specifications of the baseline model consistently point to the existence of such a negative relationship. This finding remains significant in two specifications at the 1% significance level. A survey of other macro-variables in the model uncovers some interesting outcomes. The picture is not that straightforward with real effective exchange rate (REER) and net foreign direct investment (NFDI) as far as signs are concerned. Two out of three cointegration vectors suggest a negative relationship, while the third one upholds the contrary, that is, a positive relationship. Only the latter specification yields a better fit along with significant coefficients at the 5% significance level. This outcome conveys that an appreciation of the USD is associated with an expansion of production in the manufacturing sector, which is clarified in part by economic theory. A stronger domestic currency could positively impact the manufacturing sector if there is a shift towards foreign suppliers to acquire inputs utilized in domestic production processes of goods. Such a shift would reduce production costs which in turn would lead domestic manufacturing firms to ramp up production as they grow more and more upbeat regarding their prospects for profits. This is the profit channel. It is noteworthy in this instance that the interest channel could likewise play a role in explaining this relationship. To the contrary, Goldberg and Crockett [11] argue against it and explain that such appreciations hurt profit causing firms to phase out on new plants and equipment. However, a word of caution is needed as China6, in particular, and other
5
This statistic almost doubled from 18% in 1980 to 34% in 2017.
6China joined the World Trade Organization (WTO) in
December of 2001. From that time onwards, it’s
major developing nations, like India, have been tremendous actors in reshaping patterns of trade with developed nations, including the US, and across the globe. The manufacturing sector is spurred by an increasing level of NFDI. This outcome is in order with economic rationale because NFDI involves by definition lasting commitments in businesses that generally buoy their productive capabilities7.
Overall, the findings of these estimations stress two compelling policy implications. First, the evidence supporting the notion that sustained negative trade balances clamp down the manufacturing base in the US are weak at best using the most recent data available. Notwithstanding the fact that there is a tendency in the long-term for such negative trade imbalances to slow down growth in the manufacturing sector, this is not sufficiently impactful to be felt at the macro-level. A note of caution on the part of decision-makers is nonetheless necessary. Indeed, if new industrial policies are not devised or implemented adequately to address persistent trade balances, it is not certain that the manufacturing sector as a whole stands unscathed over time. Plus, this does not preclude the existence of a different outcome at the micro-level for some specific industries more vulnerable to international competition. In the current international context with heightened trade openness and competition, the implementation of such policies may not be a simple or painless task. Second, the profit channel should be explored and expanded to provide support across the board to the manufacturing base. This support could come in the form of increased federal monies to boost research and development and foster the introduction of new technologies. As a matter of fact, we argue that long-term viability of the entire US manufacturing industry hinges upon a continued leadership of the country in trailblazing novel approaches and technologies. This course of action will generate the most potent impacts if special efforts are deployed to improve
become a world leading exporter of both finished and semi-finished goods.
7
According to the World Development Indicators
infrastructure, which will in turn boost productivity and reduce production costs. According to the American Society of Civil Engineers (ASCI) the US infrastructure report card currently flaunts a dismal D+8. This grade points out in unflattering terms that the quality of US infrastructure falls very short of where it should be and what is needed. The combination of factors afore-discussed will undoubtedly put the US and its manufacturing industry on a solid path for sustained expansion and maintain its global edge in the long-run. Without them and considering that emerging economies are closing the gap on the one hand, it is unlikely that a mature economy like the US’ will not suffer in the long-run even in high-tech sectors that have acted as an impregnable niche for decades. On the other hand, the challenges faced by the US manufacturing industry are not limited to emerging countries only. Developed economies are additionally chipping away at that dominance in the manufacturing sector or what is left of it.
Conclusion
This research work has investigated the relationship between net trade and manufacturing in the US. It’s found out that the manufacturing sector is inhibited in the long-run by worsening trade balances. This relationship does not, however, appear significant. The lesson learned from this empirical exercise weakens arguments singling out negative trade balances as part of the woes of US manufacturing. With that said, it should be highlighted as well that decision-makers should be pursuing and implementing in earnest some measures to address the long-term slowdown of manufacturing in an international context that is becoming more and more competitive. Such measures remain essential considering the positive and far-reaching ramifications generated by this sector for both other industries in the economy − in terms of direct and indirect job creations, technological advancements and cutting-edge research − and US leadership in the world.
8
The entire report is available from the American Society of Civil Engineers (ASCE) at
https://www.infrastructurereportcard.org/
References
1.
Baily MN, Bosworth BP (2014) US Manufacturing: Understanding Its Past and Its Potential Future. Journal of Economic Perspectives, 28(1):3-26.2. Evans WT, O’Neil BF, Stevenson WJ (2010) Revitalizing U.S. Manufacturing: The Role of Tax Policy. The CPA Journal, June: 50-53. New York State Society of CPAs.
3. Euromoney Institutional Investor PLC (2014) The tide turns for American manufacturing. Trade Finance: The global magazine for export and commodity finance, 17(5). London: Euromoney Institutional Investor.
4. Levinson M (2012) Manufacturing the future. Why Reindustrialization Is the Road to Recovery. New Labor Forum 21(3): 10-15. Murphy Institute, City University of New York.
5. Dauth W, Findeisen S, Suedekum J (2017) Trade and Manufacturing Jobs in
Germany. American Economic
Review, 107(5): 337-42. DOI:
10.1257/aer.p20171025.
6. Cravino J, Sotelo S (2019) Trade-Induced Structural Change and the Skill Premium.
American Economic Journal:
Macroeconomics, 11(3): 289-326.
7. Chaudhuri S (2013) Manufacturing Trade Deficit and Industrial Policy in India. Economic and Political Weekly, 48(8): 41-50.
8. Wong CKK, Liew VKS, Arip MA (2017) The Impact of ASEAN Free Trade Area on Intra-Asean Manufacturing Trade. International Journal of Business and Society, 18(3): 633-643.
9. Gujarati DN, Porter DC (2009) Basic Econometrics, 5th Edn. The McGraw Hill Companies, Inc., New York, 755-759. 10. Johansen S (1991) Estimation and
Hypothesis Testing of Cointegration
Vectors in Gaussian Vector
Autoregressive Models. Econometrica, 59(6): 1551-1580.
Appendix
Table 2: Unit root tests
MANVAGRW
Level First Difference
t-stat p-value t-stat p-value
ADF Intercept -3.277 0.0287 … …
Intercept & trend -3.7949 0.0366 … …
PP Intercept -3.2342 0.0314 … …
Intercept & trend -3.7792 0.0378 … …
NFDI
Level First Difference
t-stat p-value t-stat p-value
ADF Intercept -2.4642 0.1374 -3.9308 0.008
Intercept & trend -2.8958 0.1824 -3.777 0.0414
PP Intercept -2.5195 0.1246 -4.5572 0.0019
Intercept & trend -2.9775 0.16 -4.1552 0.0187
NT
Level First Difference
t-stat p-value t-stat p-value
ADF Intercept -1.6015 0.465 -4.5547 0.0019
Intercept & trend -1.5271 0.7 -4.5264 0.0073
PP Intercept -1.5954 0.468 -4.5546 0.0019
Intercept & trend -1.7468 0.6953 -4.6969 0.0063
RGDP
Level First Difference
t-stat p-value t-stat p-value
ADF Intercept -1.5128 0.5086 -2.8876 0.0637
Intercept & trend -2.601 0.2831 -2.8844 0.1865
PP Intercept -1.3846 0.5708 -2.8754 0.0612
Intercept & trend -2.0214 0.5582 -2.8632 0.1774
REER
Level First Difference
t-stat p-value t-stat p-value
ADF Intercept -2.657 0.0997 … …
Intercept & trend -1.783 0.6525 -2.8844 0.1865
PP Intercept -1.6018 0.4649 -3.037 0.0476
Table 3: Cointegration tests
Number of cointegrating
vectors Trace value p- Eigenvalue Max
p-value
0 92.3671 0.0021 27.9447 0.2612
No Deterministic trend 1 64.4223 0.0046
with constant 2 37.7122 0.0262
3 18.1889 0.0941
0 113.4119 0.0003 43.0484 0.0133
1 70.3634 0.0129 26.0855 0.2277
Linear Deterministic
Trend 2 44.2779 0.0363
3 22.9566 0.1106
0 111.2662 0 43.0012 0.0096
1 68.265 0.0024 30.815 0.185
Quadratic
Deterministic 2 42.544 0.0066
Trend 3 21.462 0.0181
4 6.0648 0.0138
Table 4: Cointegration results
Variant 1 Variant 2 Variant 3
NT 3.282 3.78011 3.056
Log(REER) -1.5919 5.7685** -2.235
Log(RGDP) -0.0111*** -0.0031 -0.0113***
NFDI -0.1303 0.6944** -0.1932
C 12.9273 -18.2352 -3.0674
Adj. R-square 0.596 0.6051 0.5339
F-Statistics 221^^^ 229^^^ 753^^^
Note: ***, **, and * denote significance at the 1, 5, and 10% levels, respectively (t-test). ^^^, ^^, and ^ denote significance at the 1, 5, and 10% levels, respectively (F-test).
Figure 1: Services share of total trade (%)