Published by Science and Education Publishing DOI:10.12691/aees-8-6-10
Comparative Analysis of Exhaust Emission from CI
Engine Running on 20% Blends of Different Biodiesels
Rajesh Dudi1,*, Vineet Kumar2, Sunil Kumar Mahla3
1
Research Scholar, I. K. Gujral Punjab Technical University, Kapurthala, India
2
Department of Automobile Engineering, Chandigarh University, Mohali, India
3
Department of Mechanical Engineering, I. K. Gujral Punjab Technical University, Hoshiarpur Campus, India *Corresponding author: [email protected]
Received August 05, 2020; Revised September 06, 2020; Accepted September 15, 2020
Abstract
Taking into account the rising cost of non-renewable energy source and ecological contamination, elective fuel is required. Looking for such fuel, biodiesel has drawn everybody's consideration. Biodiesel might be an enormous substitute for a non-renewable energy source. The current paper speaks to a relative examination of the biodiesel Karanja, Mahua and Jatropha in comparison with pure diesel (D100). The three biodiesels were extractedfrom two-step transesterification process. Then 20 percentage blends of the biodiesels were used in CI engine separately at varying load. The Results were determined and afterwards compared on the ground of performance and emission from the engine. The outcomes demonstrate that the carbon monoxide (CO), hydrocarbon (HC), CO2 and
smoke created by K20 (karanja 20% blend), J20 (jatropha 20% blend) and M20 (mahua 20% blend) are lower than diesel (D100). The brake thermal proficiency (BTE) for all the three biodiesels was found lower as comparison with
D100. The brake specific fuel consumption was lowest for D100. Additionally, K20, J20 and M20 produce more NOx
than diesel D100. Likewise, EGT was found highest for D100.
Keywords
: biodiesel, emission, performance, karanja, Jatropha and MahuaCite This Article:
Rajesh Dudi, Vineet Kumar, and Sunil Kumar Mahla, “Comparative Analysis of Exhaust Emission from CI Engine Running on 20% Blends of Different Biodiesels.” Applied Ecology and Environmental Sciences, vol. 8, no. 6 (2020): 396-401. doi: 10.12691/aees-8-6-10.1. Introduction
The principal source of power production in today’s life are fossil fuels. The fossil fuel proves to be a tremendous fuel but the problem with fossil fuel is their limited source and high pollution. So there is a need for alternative fuel that can replace fossil. In this search, the biodiesel is acquiring everyone’s attention. The use of edible vegetable can lead to food crisis so non-edible oil should be chosen for biodiesel production. Karanja, mahua and jatropha can be potential oil for biodiesel production. A yielding of more than 80% can be obtained by these oils [1,2]. Out of the various possible method, transesterification is an effective method for biodiesel production [3]. When the FFA in the biodiesel is higher than 2% it becomes necessary to use two-step transesterification otherwise there will be soap formation and lower-yielding [4]. The two-step transesterification method was performed using H2SO4 as the acid catalyst and KOH as an alkali catalyst,
which gave yielding of 99% of jatropha biodiesel. The produced biodiesel exhibit properties as per biodiesel standards [5]. In two-step transesterification, the soap formation is decreased by two times as compared to single-step [6]. In biodiesel production from mahua, a maximum yielding of 94.21% was extracted with 0.4%
sodium methoxide, 6:1 molar ratio at 45°C after 45 minutes [7]. It was observed that reaction time, catalyst concentration and methanol/oil ratio significantly affect biodiesel yielding [8].
A lot of research has been done on the performance and emission characteristics of biodiesel running on the diesel engine. Most of the research indicates that the biodiesel is a potential alternate for pure diesel. The use of 100% biodiesel in the engine can produce some serious problem regarding engine life. In present work, 20 % blends of karanja (K20), Jatropha (J20) and Mahua (M20) have been used. Effectiveness evaluation and exhaust of diesel engine running at varying blending ratios have been reported by different researchers. Emissions like HC, CO2,
CO, smoke opacityandBTE are lower for biodiesel in comparison with diesel in almost every research and the NOx emission was found increased in comparison with D100 (diesel) [9,10,11,12,13,14,15]. In one other research,
the BTE was found 3.65% less and NOx was found 9.86% more than diesel at CR 18 and full load conditions. it was also concluded that with the enhancement of blending ratio, the EGT and emission like NOX, CO increases and
research, the HC and CO reduced by 24.6 % and 12.9 % respectively for B20 (20 % caster biodiesel). Also, the NOx emission increased by by11.8 % for B20 [18]. The blending ratio also affects emissions. On blending more than 50% the CO emission is greater for Manilkara Zapota biodiesel versus diesel [19]. The NOx for jatropha increased by 30% at 70% load and 2300 rpm [20].
2. Methodology
2.1. Biodiesel Production
All three biodiesels are produced from two-step transesterification process. The first step in transesterification involves reaction with methanol with the assistance of acid catalyst (H2SO4). In present work, methanol is used
because it gives more yield and separation of glycerine is easier as compared with ethanol [21]. This process removes the FFA and moisture present in the raw oil. After this process, the mixture is made to settle down for one hour. The mixture is converted to two different phases. The upper phase liquid is separated and is used in the second step. The next step involves alkaline transesterification. In this step, a reaction is made between triglyceride and methanol using KOH as a catalyst in a controlled
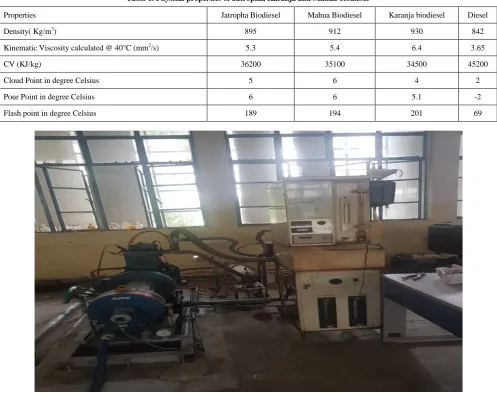
temperature. The mixture is then settled and is separated in two layers, i.e. crude biodiesel and glycerol. The unrefined biodiesel is then washed with hot water and the biodiesel is produced. The properties of the obtained biodiesels were similar to pure diesel. The biodiesel properties are shown in Table 1.
2.2. Experimental Setup
The tests are executed on a Kirloskar made single-cylinder, 4-stroke CI engine. The actual test kit is shown in the Figure 1. The engine delivers 5.4 KW at 1500 rpm. The set-up is coupled with a AVL 4000 Di- gas analyzer, which can detect CO, CO2, HC, and NOx
present in engine emission. Smoke opacity is noted using AVL 437 smoke meter.
3. Results and Discussion
3.1. Brake Thermal Efficiency (BTE)
The BTE specifies how efficiently an engine can convert the energy of the fuel to work output. The
Figure 2 portrays the change of BTE at different load for the four fuels.
Table 1. Physical properties of Jatropha, Karanja and Mahua biodiesel
Properties Jatropha Biodiesel Mahua Biodiesel Karanja biodiesel Diesel
Density( Kg/m3) 895 912 930 842
Kinematic Viscosity calculated @ 40°C (mm2/s) 5.3 5.4 6.4 3.65
CV (KJ/kg) 36200 35100 34500 45200
Cloud Point in degree Celsius 5 6 4 2
Pour Point in degree Celsius 6 6 5.1 -2
Flash point in degree Celsius 189 194 201 69
Figure 2. BTE vs Load
The figure depicts that the BTE for the three biodiesels is lower as compared to D100 (diesel). This is due to the
reason that all three biodiesel has a high viscosity and low calorific value as compared to diesel. The BTE increases as the load are increased. At 100% loading the BTE for D100, J20, M20 and K20 are 35.3%, 32.1%, 31.8% and
29.5% respectively.
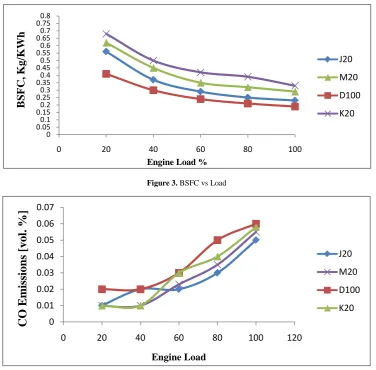
3.2. Brake Specific Fuel Consumption
The BSFC is fuel burned per unit power produced by an engine. It is measured in Kg/KWh. It can be useful in comparing engines of different sizes. The effect of loading
on BSFC of the D100, J20, M20 and K20 is shown in the
Figure 3. The BSFC decreases as the load is increased. The BSFC for all the three biodiesels is less than diesel. This happens because all three biodiesel has a lower calorific value than D100[17]. At peak load the BSFC for D100, J20, M20
and K20 are 0.19, 0.23, 0.29 and 0.33 Kg/KWh respectively.
3.3. CO Emission
The variation of CO emission wrt load is illustrated in
Figure 4. The BSFC tends to increase for all the fuels as the load is enhanced. This happens because at higher load more rich fuel is burned [12].
Figure 3. BSFC vs Load
Figure 4. CO vs Load
0 5 10 15 20 25 30 35 40
0 20 40 60 80 100
Bra
ke
T
he
rma
l E
ffi
ci
en
cy
,%
Load %
J20 M20 D100 K20
0
0.050.1
0.150.2
0.250.3
0.350.4
0.450.5
0.550.6
0.650.7
0.750.8
0 20 40 60 80 100
B
S
F
C
, K
g/
K
Wh
Engine Load %
J20 M20 D100 K20
0 0.01 0.02 0.03 0.04 0.05 0.06 0.07
0 20 40 60 80 100 120
C
O
E
m
is
si
on
s [
vol
. %
]
Engine Load
The main reason for the production of the CO is incomplete combustion which occurs if there is a lack of O2 in the fuel. The CO emission produced by all the three
biodiesels is less than pure diesel. This happens because the diesel has less O2 content as compared to the three
biodiesels. The more O2 in biodiesel exhibits more
complete combustion and the CO emission reduces. At peak load the values of CO emission for D100, J20,
M20 and K20 are 0.06, 0.05, 0.58 and 0.055 volume % respectively. Similar trends were noted by other researchers [22].
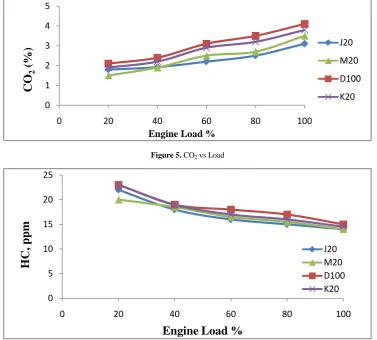
3.4. CO
2Emission
The CO2 is produced when there is sufficient O2 is
available during the formation of CO [23]. The CO2
emission for J20, M20 K20 and diesel is shown in the
Figure 5. All three biodiesels exhibit lower CO2 emissions
as compared to pure diesel. The CO2 emission increases as
the load are increased. Similar patterns were noted by other researchers [24]. At peak load, the values for the CO2 emission for D100, J20, M20 and K20 are 4.1, 3.1, 3.8
and 3.5 in term of vol% respectively.
3.5. HC Emission
The variables influencing the HC emission are engine operating conditions, fuel spray characteristics, and availability of the O2 in the engine cylinder [25]. Figure 6
illustrates the variation of HC emission wrt load. It can be
noted that the HC emission increases as the load is increased. The HC emission for all the three biodiesels is less than D100 at all load values. This is due to the more O2
present in the biodiesel, which leads to complete combustion. At peak load conditions the values of HC emission for, J20, K20 and M20 are 7.14, 3.3 and 7.14% less than D100 respectively.
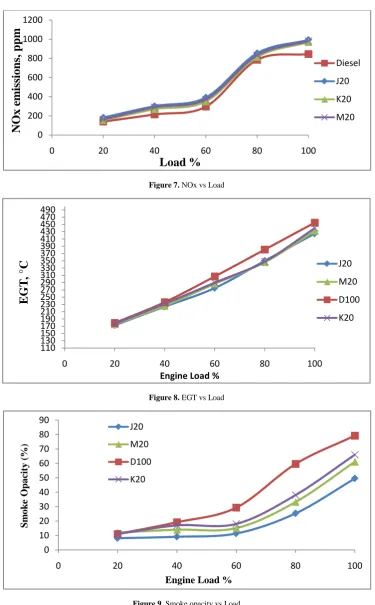
3.6. NOx Emission
The factors influencing the NOx production are temperature, time available during combustion and oxygen concentration in the engine cylinder [26]. The NOx variation is shown in Figure 7. All three biodiesel shows higher NOx emission as compared to D100. This
happens because all the three biodiesel contains high oxygen content and this high oxygen available contributes to superior combustion [27]. At peak load conditions the values for the NOx for D100, J20, K20 and M20 are 845,
992, 970 and 981ppm respectively.
3.7. Exhaust Gas Temperature
The EGT variation is portrayed in Figure 8. The EGT for all the four fuels increases on increasing the load. The EGT for all the three biodiesels is less than the pure diesel. This happens because the biodiesel has a high viscosity and exhibits poor combustion [11]. The values of the EGT at maximum load for D100, J20, M20 and K20 are 455, 425,
432 and 440 °C respectively.
Figure 5. CO2 vs Load
Figure 6. HC vs Load
0 1 2 3 4 5
0 20 40 60 80 100
CO
2
(%
)
Engine Load %
J20 M20 D100 K20
0 5 10 15 20 25
0 20 40 60 80 100
H
C
, ppm
Engine Load %
Figure 7. NOx vs Load
Figure 8. EGT vs Load
Figure 9. Smoke opacity vs Load
3.8. Smoke
The effect of change of load on smoke opacity is depicted in Figure 9 for the four fuels. The smoke tends to increases as the load is increased. This happens because at higher load more fuel is consumed in the cylinder [28]. The smoke for all the biodiesels is lower than D100. The higher O2 content
of the biodiesels causes complete combustion and less smoke is produced [29]. At lower load, the gap is narrower but at higher load, the gap becomes wider. At
maximum load, the values of smoke for D100, J20, M20
and K20 are 79.2, 49.5, 61.1 and 66 % respectively.
4. Conclusion
The conclusion of the present study are summarised below:
1. The BTE of three biodiesels (J20, M20 and K20) is less than D100. D100 produces 9.06%, 9.9% and
0 200 400 600 800 1000 1200
0 20 40 60 80 100
N
O
x e
m
is
si
on
s,
p
p
m
Load %
Diesel J20 K20 M20
110 130 150 170 190 210 230 250 270 290 310 330 350 370 390 410 430 450 470 490
0 20 40 60 80 100
E
G
T,
°
C
Engine Load %
J20 M20 D100 K20
0 10 20 30 40 50 60 70 80 90
0 20 40 60 80 100
S
m
ok
e
O
p
ac
it
y (
%
)
Engine Load % J20
16.45 higher BTE than J20, M20 and K20 respectively.
2. The BSFC for D100 was found 21%, 52.6 and 73.6%
less than J20, M20 and K20 respectively.
3. The CO emission for diesel was 16.6%, 3.33% and 8.3% higher than J20, K20 and M20 respectively. 4. The CO2 for diesel was found 24.3%, 7.3% and
14.6% higher than J20, K20 and M20 respectively. 5. The HC emission for, J20, K20 and M20 are 7.14,
3.3 and 7.14% less than D100 respectively.
6. The NOx for diesel was 17.3%, 14.7% and 16% less than J20, K20 and M20 respectively.
7. The EGT and smoke for the three biodiesels were also less than D100.
In term of emission and performance the J20, K20 and M20 proves to be a tremendous alternative for pure diesel. The 20% blends of all the three biodiesels can be used in diesel engine without any change in diesel design.
References
[1] M. Suresh, C. P. Jawahar, and A. Richard, ‘A review on biodiesel production, combustion, performance, and emission characteristics of non-edible oils in variable compression ratio diesel engine using biodiesel and its blends’, Renew. Sustain. Energy Rev., vol. 92, no. March, pp. 38-49, 2018.
[2] S. Rezania, B. Oryani, J. Park, and B. Hashemi, ‘Review on transesterification of non-edible sources for biodiesel production with a focus on economic aspects, fuel properties and by-product applications’, Energy Convers. Manag., vol. 201, no. October, p. 112155, 2019.
[3] O. S. Stamenkovi, V. B. Veljkovi, and I. B. Bankovi, ‘Biodiesel production from non-edible plant oils’, Renew. Sustain. Energy Rev., vol. 16, pp. 3621-3647, 2012.
[4] P. K. Sahoo and L. M. Das, ‘Process optimization for biodiesel production from Jatropha, Karanja and Polanga oils’, Fuel, vol. 88, no. 9, pp. 1588-1594, 2009.
[5] A. K. Tiwari, A. Kumar, and H. R. Ã, ‘Biodiesel production from jatropha oil (Jatropha curcas) with high free fatty acids: An optimized process’, Biomass and Bioenergy, vol. 31, pp. 569-575, 2007.
[6] D. Nguyen, C. Tongurai, K. Prasertsit, and A. Kumar, ‘A novel two-step transesterification process catalyzed by homogeneous base catalyst in the first step and heterogeneous acid catalyst in the second step’, Fuel Process. Technol., vol. 168, no. August, pp. 97-104, 2017.
[7] P. Taylor, H. Manjunath, O. Hebbal, and H. R. K, ‘Process Optimization for Biodiesel Production from Simarouba, Mahua and Waste Cooking Oils Process Optimization for Biodiesel Production from Simarouba, Mahua, and Waste Cooking Oils’, Int. J. Green Energy, pp. 37-41, 2014.
[8] V. Narula, A. Thakur, A. Uniyal, S. Kalra, and S. Jain, ‘Process parameter optimization of low temperature transesterification of algae-Jatropha Curcas oil blend’, Energy, 2016.
[9] M. M. Rashed, M. A. Kalam, H. H. Masjuki, M. Mofijur, M. G. Rasul, and N. W. M. Zulkifli, ‘Performance and emission characteristics of a diesel engine fueled with palm, jatropha, and moringa oil methyl ester’, Ind. Crops Prod., vol. 79, pp. 70-76, 2016.
[10] A. K. Yadav, M. E. Khan, A. M. Dubey, and A. Pal, ‘Performance and emission characteristics of a transportation diesel engine operated with non-edible vegetable oils biodiesel’, Case Stud. Therm. Eng., vol. 8, pp. 236-244, 2016.
[11] B. S. Chauhan, N. Kumar, and H. M. Cho, ‘A study on the performance and emission of a diesel engine fueled with Jatropha
biodiesel oil and its blends’, Energy, vol. 37, no. 1, pp. 616-622, 2011.
[12] A. K. Agarwal and K. Rajamanoharan, ‘Experimental investigations of performance and emissions of Karanja oil and its blends in a single cylinder agricultural diesel engine’, Appl. Energy, vol. 86, no. 1, pp. 106-112, 2009.
[13] J. V Tirkey, A. Kumar, and S. K. Shukla, ‘Comparative analysis of engine performance and emission characteristics of different biodiesels’, vol. 7269, 2018.
[14] B. Deepanraj, M. Srinivas, N. Arun, G. Sankaranarayanan, and P. Abdul Salam, ‘Comparison of jatropha and karanja biofuels on their combustion characteristics’, Int. J. Green Energy, vol. 14, no. 15, pp. 1231-1237, 2017.
[15] S. Godiganur, C. H. Suryanarayana Murthy, and R. P. Reddy, ‘6BTA 5.9 G2-1 Cummins engine performance and emission tests using methyl ester mahua (Madhuca indica) oil/diesel blends’, Renew. Energy, vol. 34, no. 10, pp. 2172-2177, 2009.
[16] B. De and R. S. Panua, ‘An experimental study on performance and emission characteristics of vegetable oil blends with diesel in a direct injection variable compression ignition engine’, Procedia Eng., vol. 90, pp. 431-438, 2014.
[17] I. M. Monirul et al., ‘Assessment of performance, emission and combustion characteristics of palm, jatropha and Calophyllum inophyllum biodiesel blends’, Fuel, vol. 181, pp. 985-995, 2016. [18] S. K. Mahla, A. Dhir, V. Singla, and P. Rosha, ‘Investigations on
environmental emissions characteristics of CI engine fuelled with castor biodiesel blends’, J. Environ. Biol., vol. 39, pp. 353-357, 2018.
[19] R. S. Kumar, K. Sureshkumar, and R. Velraj, ‘Combustion, performance and emission characteristics of an unmodified diesel engine fueled with Manilkara Zapota Methyl Ester and its diesel blends’, Appl. Therm. Eng., vol. 139, no. September 2016, pp. 196-202, 2018.
[20] V. Kumar and R. Kumar, ‘The effect of operating parameters on performance and emissions of DI diesel engine fuelled with Jatropha biodiesel’, Fuel, vol. 278, no. February, p. 118256, 2020. [21] P. Verma and M. P. Sharma, ‘Comparative analysis of effect of
methanol and ethanol on Karanja biodiesel production and its optimisation’, Fuel, vol. 180, pp. 164-174, 2016.
[22] H. K. Amarnath and P. Prabhakaran, ‘International Journal of Green Energy A Study on the Thermal Performance and Emissions of a Variable Compression Ratio Diesel Engine Fuelled with Karanja Biodiesel and the Optimization of Parameters Based on Experimental Data’, no. July 2013, pp. 37-41, 2011.
[23] A. Nalgundwar, B. Paul, and S. Kumar, ‘Comparison of performance and emissions characteristics of DI CI engine fueled with dual biodiesel blends of palm and jatropha’, FUEL, vol. 173, no. 2016, pp. 172-179, 2017.
[24] S. Gangil, R. Singh, P. Bhavate, B. Modhera, and D. Bhagat, ‘Evaluation of engine performance and emission with methyl ester of Karanja oil’, Perspect. Sci., vol. 8, pp. 241-243, 2016.
[25] D. Das, A. Kumar, and A. Yadav, ‘Evaluation of performance, emission and combustion characteristics of a CI engine fueled with karanja biodiesel and diethyl ether blends’, Biofuels, vol. 9, no. 1, pp. 89-94, 2018.
[26] C. Swaminathan and J. Sarangan, ‘A comprehensive study on reduction of NOx emission applying EGR technique in a diesel engine using biodiesel (POME) as fuel with ether-based additives’, Int. J. Ambient Energy, vol. 38, no. 8, pp. 834-843, 2017.
[27] A. K. Agarwal, A. Shrivastava, and R. K. Prasad, ‘Evaluation of toxic potential of particulates emitted from Jatropha biodiesel fuelled engine’, Renew. Energy, vol. 99, pp. 564-572, 2016. [28] K. J. S. Gill, H. C. Lim, H. M. Cho, S. K. Mahla, B. S. Chauhan,
and A. Dhir, ‘Influence of EGR on the simultaneous reduction of NOx-smoke emissions trade-off under CNG-biodiesel dual fuel engine’, Energy, vol. 152, no. x, pp. 303-312, 2018.
[29] B. R. Hosamani and V. V. Katti, ‘Experimental analysis of combustion characteristics of CI DI VCR engine using mixture of two biodiesel blend with diesel’, Eng. Sci. Technol. an Int. J., vol. 21, no. 4, pp. 769-777, 2018.