ECOLOGICAL HUMAN IMPRINT IN EGYPT: PROSPECTIVE
ANALYSIS AND VIEWS FROMECOLOGICAL
SUSTAINABILITY AND MODELING
Safwat H. Shakir Hanna
[a]*and Magdy T. Khalil
[b]Keywords: Ecological human imprint, ecological sustainability, modelling.
The Ecological Human Imprint (EHI) is a measuring tool to assess the carrying capacity of an area with regard to the use of the planet's
natural resources. Additionally, it will be acting as a feedback to policies and strategies utilized in measuring the sustainable development. It will measure the ability of policies that can be implemented to reduce environmental impact. The new index (EHI) is an important
measure for calculating the human demands and impacts on environment. In this respect, the EHI is a function of all the parameters that
interact between the power of ecosystem productivity, human interactions and activities on a particular ecosystem or the demand from that ecosystem. The present paper is covering and analysing the ecosystems’ productivity and the human demand from the ecosystems. It includes comprehensive analyses in measuring the possibility of capabilities of the Egyptian ecosystems to provide goods and services to its population. Additionally, we have discussed the models that can be used in measuring the sustainability of ecosystems and, in particular, the natural resources of Egypt. Further, a comprehensive model called EHI and national resources changes of Egypt (EHI-NR-EG) has been
formulated. This describes the status of the ecosystems’ productivity and assesses the impact of change of any parameter that affects the current status of natural resources and their availability to human population within the Egyptian boundaries. In addition, attempts have been made to provide some answers to issues which arises due to the impact of human activities on natural resources
* Corresponding Authors
E-Mail: [email protected]
[a] Chemical Engineering Department, College of Engineering, Prairie View A&M University, The Texas A&M University System, Prairie View, TX 77446, USA.
[b] Faculty of Science, Ain Shams University, Egypt.
INTRODUCTION
Egypt population density is 98,092,423 people as on Wednesday, October 18, 2017, based on the latest United Nations estimates (http://www.worldometers.info/world-population/egypt-population) with an annual average of population growth rate of 1.87-2.72 % percent. Further, the population density in Egypt is 98 km-2. In this respect,
38.8 % of the population is urban (37,826,341 people in 2017). This has an increasing impact on the natural resources to meet the demands from the human population. Egypt occupies 100.1 million hectares, out of which 67,000 hectares are covered by forest, 3.5 million by cropland and 20,000 by grazing land, with 1.3 million hectares supporting its built infrastructure. Bordering the Mediterranean and the Red Sea, Egypt has 5.0 million hectares of continental shelf and 0.6 million hectares of inland water (Egyptian Census Bureau). In this respect, the natural resources have not increased as the increased trends of human population. Therefore, if the natural resources that provide goods and services for the survival of Egypt’s human population are not increased or developed to sustain the development, then what will happen? It is an important question that the Egyptian government, Non-Governmental Organization (NGO), scientists, researchers and Egyptian people should answer to secure the continuation of sustainable development in the country.
In Egypt, human population and demands for food production have increased to the degree that the Nile lands cannot support and provide the essential crops. These are
issues being studied by the Government to find solutions. If one third of the Nile Delta is to be inundated by waters of the Mediterranean, Egypt may not be able to produce much of the crops that are already in dire shortage.1 Further, as
the result of the increasing population, the Egyptian sustainable development will be impossible.
MATERIALS AND METHODS
Data Collection
Data are collected from different series available on public domain website of the World Bank,2,3 United Nation
Environmental Program (UNEP),4 United Nation
Development Program (UNDP),5 United Nation Food and
Agriculture Organization (FAO),6 ( FOASTAT),7 (UNFPA,
2001),8 WWF reports, 2002,9,10,11,12 2004,13 2006,14 2008,15
201016 and 2012,17 and WRI 1960-2005,18,19 and series WRI
2000-2001.20 The data were analyzed using the regression,
correlation, and statistical methodologies using Sigma Plot Software (Version 8, Version 11.2), 2D software of SPSSSCIENCE, 2002, (2009-2010),20 STELLA software
2006 and 201021,22 and SAS, 2011 a,b.23,24
Construction of a simulation model with STELLA software
changes of Egypt (EHI-NR-EG). In this respect we have used
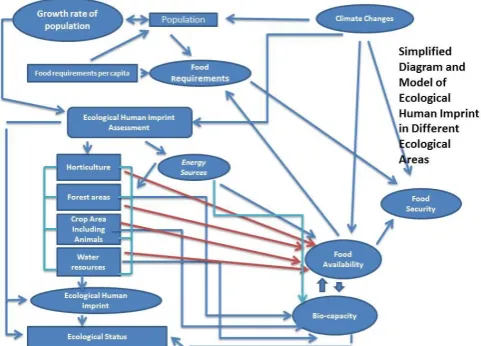
the Stella Software to create an executable program using the two or fourth order Runge–Kutta integration method. The model was used to predict the changes in ecological footprint demands and footprint capacities according to several parameters such as the human population change including the fertility changes, factors impacted on population growth, cropped lands, grazing lands, fisheries, build-up lands, vegetative lands, water resources, etc. The model has the capacity to predict for the next year, next decade, next twenty-five years, next fifty-years and for the next hundred year. The model takes into considerations the relaxed assumptions, moderate assumptions, conservative assumptions and very conservative assumptions of changing data parameters. The model hypothesis is presented in the Figure 1.
Figure 1. Simplified diagram for the EHI model in Egypt.
RESULTS AND DISCUSSION
The According to recent United Nations estimates, global population is increasing by approximately 80 million — the size of Germany — each year (Vital Sign, 2012, UNDP 2013).5 Additionally, the Egyptian population is increasing
by average of two millions/per year since 1960. For example in year 2017, the human population of Egypt has increased by 2,062,826 people, with a growth rate of 2.18 %. This is an alarming rate for the Egypt and it is difficult to sustain its development with its limited resources.
Data in Tables 1-7 and Figure 2 indicate that the (EHI) of
Egypt is increasing with an increase in the human population. This means that the demands on the natural resources of Egypt is increasing and this is putting high pressure on the natural resources that are not available and this will lead to import many of the natural resources from other countries. This is seen in Figure 3. It illustrates the availability of the biological capacity in Egypt and shows the decline in the availability of bio-capacity per capita. The bio-capacity measures the capacity for supplying goods and services to the country from the available natural resources. The decline of global hectare per capita is about 0.14 hectare per capita when the human population had reached around 80 million people. This means that the basic needs from the
natural resources are not met and the extreme difficulties are arising continuously. Further Figure 4 indicates that the relationship between deficit in biological capacity and human population of Egypt and shows the declining the biological capacity of Egypt lands for producing the biological capacities to support the goods, products and services in Egypt.
According the simulation model of (EHI-NR-EG), the
model have several senarios according to the increase of human populatuion from relaxed assumption, moderate assumption and conservative assumption of growth of human population of Egypt as the following rate: therefore, the rate of relaxed asumption is about 1.7 %, moderate assumption of 1. 2 % and conservatiove rate of growth of 1.0 %. This will lead us to emphasize the magintude of the problem of increasing the human popualtion.
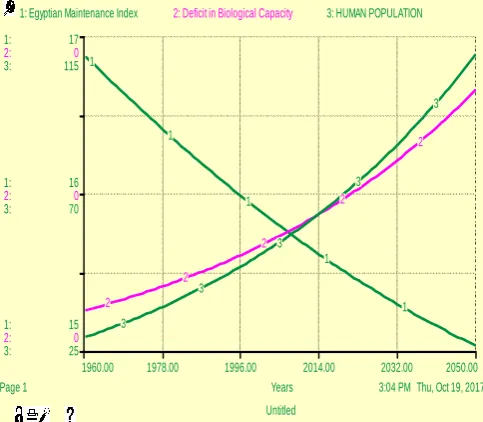
The simulation model has indicated the following major points in relation to the natural resources and biological capacity of the ecosystems. In this respect the model Figure 5 shows that the human population at growth rate is 2.1%, Egyptian biological capacity and Egyptian biological demands from the Earth as calculated by the EHI-NR-EG,
the graph shows that demands is increasing and at the same time the population will grow to 186.97 million people in 2050 and the biological capacity will decrease indicating in the maintenance index as covering 15% of the Egyptian population. However when human population growth rate is 1.5%, the Egyptian biological demands from the Earth will increase and at the same time the population will grow to 109 million people in 2050 and the biological capacity will decrease indicating that the maintenance index is covering 16 % of the Egyptian population (Figure 6). In addition, when human population growth rate is 1.0 %, the Egyptian biological demands from the Earth will increase and at the same time the population will grow to 70.5 million people in 2050 and the biological capacity will decrease indicating that the maintenance index is covering 17 % of the Egyptian population. In this respect, with decreasing the human population growth rate, the model is giving improvement within the natural resources allowing support of Egyptian people (Figure 7).
From the above analysis, we can come to the most important scientific analysis for explaining the challenges that the Egyptian government will face in the near future to accommodate all the human beings who are living on its natural resources. Shakir Hanna et. al25 indicated that with
increasing human imprint on global scale can be of consideration. In this respect, the Egyptian government has to consider vigorous family planning and reduction of the family production of kids. The high fertility rate can impose costly burdens on Egypt’s economy and sustainability. This will overload the natural resources for increasing demands from the overload of population. This will allow the country to borrow money to support its people. In other words, increasing human population cause the declining ability of the country to support its citizens. Accordingly, with fewer children, families will have more disposable income to save or invest. This constitutes a "demographic bonus," which may help to spur economic growth, create jobs, and in turn reduce unemployment. In 1995, the unemployment rates were 31.5 and 11.8 percent among secondary school and University graduates respectively.26 This will lead the
Table 1. List of variables and parameters that are used in the study of Egyptian Ecological Human Imprint.
Variable Interpretation Unit used in the model
GBC Global Biological Capacity of the Egyptian lands
In million hectares that generate the biological capacity of the lands of Egypt
GBD Global Biological Demand from the Egyptian lands
In million hectares that consumed from biological capacity by human beings living on the land.
EHI Ecological Human Imprint Index Calculated by Information Theories and Technological Advances Factor as
positive and negative impacts and converted to Global Million hectares GDC Global Deficit Capacity In million hectares
Egp Egyptian Population In million people
Table 2. Egyptian Population in million, Egyptian Global Biological Capacity (GBC), Egyptian Global Biological Demand (GBD) and Maintenance Index of the Egypt Earth up to Year 2010. 1.7 % Growth Rate of Human Population, Surface area = 1 million sq. km
Year Population GBD GBC CBC-GBD
GBC/GBD
1961 28.80 0.09 0.01 -0.08 0.22 1970 35.45 0.11 0.02 -0.09 0.16 1980 43.64 0.12 0.02 -0.10 0.16 1990 53.72 0.14 0.02 -0.12 0.14 2000 66.13 0.17 0.02 -0.14 0.11 2010 81.41 0.20 0.03 -0.17 0.15
Table 3. Predicted Values Calculated for Egyptian Population, GBC, GBD and Maintenance Index of the Egyptian Earth from Year 2010-2050 assuming 1.7 % Growth Rate of Human Population.
Year Population GBD GBC CBC-GBD
GBC/GBD
2010 81.41 0.20 0.03 -0.17 0.15
2020 100.22 0.23 0.03 -0.20 0.13 2030 123.37 0.28 0.04 -0.24 0.142 2040 151.86 0.34 0.05 -0.29 0.147 2050 186.94 0.41 0.06 -0.35 0.146
Table 4. Egyptian Population, GBC, GBD and Maintenance Index of the Egypt Earth up to Year 2010, assuming 1.5 % Growth Rate of Human Population.
Year Population GBD GBC CBC-GBD
GBC/GBD
1961 28.80 0.09 0.01 -0.08 0.22 1970 33.42 0.10 0.02 -0.08 0.16 1980 33.79 0.11 0.02 -0.09 0.16 1990 45.02 0.12 0.02 -0.10 0.14 2000 52.34 0.14 0.02 -0.12 0.11 2010 60.62 0.15 0.02 -0.13 0.15
Table 5. Predicted Values Calculated for Egyptian Population, GBC, GBD and Maintenance Index of the Egyptian Earth from Year 2010-2050 assuming 1.5 % Growth Rate of Human Population.
Year Population GBD GBC CBC-GBD
GBC/GBD
2010 60.63 0.15 0.02 -0.13 0.15 2020 70.31 0.17 0.03 -0.15 0.17 2030 81.66 0.20 0.03 -0.17 0.15 2040 94.77 0.22 0.03 -0.19 0.14 2050 109.99 0.25 0.04 -0.22 0.16
Figure 5. Simulation model for Egyptian human population and Egyptian maintenance index (EMI %) and deficit in GBC assuming a 2.1 % annual growth rate.
Table 6. Egyptian Population, GBC, GBD and Maintenance Index of the Egypt Earth up to Year 2010, assuming 1 % Growth Rate of Human Population.
Year Population GBD GBC CBC-GBD
GBC/GBD
1961 28.80 0.09 0.01 -0.08 0.22 1970 31.61 0.10 0.02 -0.08 0.20 1980 35.14 0.10 0.02 -0.09 0.22 1990 38.82 0.11 0.02 -0.09 0.18 2000 42.88 0.12 0.02 -0.10 0.16 2010 47.37 0.13 0.02 -0.11 0.15
Table 7. Predicted Values Calculated for Egyptian Population, GBC, GBD and Maintenance Index of the Egyptian Earth from Year 2010-2050 assuming 1 % Growth Rate of Human Population.
Year Population GBD GBC CBC-GBD
GBC/GBD
2010 47.37 0.13 0.02 -0.11 0.15 2020 52.37 0.14 0.02 -0.12 0.14 2030 57.71 0.15 0.02 -0.13 0.13 2040 63.84 0.16 0.02 -0.14 0.13 2050 70.50 0.17 0.03 -0.15 0.17
2:51 PM Thu, Oct 19, 2017
Untitled Page 1
1960.00 1978.00 1996.00 2014.00 2032.00 2050.00
Years 1:
1: 1:
2: 2: 2:
3: 3: 3:
14 16 17
0 0 0
0 100 200
1: Egyptian Maintenance Index 2: Deficit in Biological Capacity 3: HUMAN POPULATION
1
1
1
1
1 2
2
2
2
2
3
3
3
3
Figure 6. Simulation model for Egyptian human population and Egyptian maintenance index (EMI %) and deficit in GBC assuming a 1.5 % annual growth rate.
Figure 7. Simulation model for Egyptian human population and Egyptian maintenance index (EMI %) and deficit in GBC assuming a 1 % annual growth rate.
CONCLUSIONS
It is important to in force the family planning in Egypt because the (EHI) of the Egyptian society is increasing and in
consequence the increase demands from natural resources to produce the goods and services. From the data that series we studied there is a concern when it comes to the production of food requiring for all people of Egypt to support their lives. According to Us Department of Agriculture (USDA), the required average number of calories that are needed to support every human being is 2000 Calories per day. This is translated to the production of 2000X365X 98 million people in the country will turn to 7.154 calories per year. 13
The question is from where we can get all these calories to feed the whole population for Egypt in a one year? In general some people are not receiving these calories and many people are in malnutrition and in a very high poverty and the country cannot support all the people.
REFERENCES
1Agrawala, S.; Moehner, A.; El Raey, M.; Conway, D.; van Aalst,
M.; Hagenstad, M. and Smith, J., Development and climate change in Egypt: focus on coastal resources and the Nile. Com/env/epoc/dcd/dac(2004)1/final
2WorldBank,.1960-2012. Data Series and Research. The World
Bank Organization. http://data.worldbank.org/topic/
agriculture-and-rural-development.
3WorldBank, 1960-2008. Data Series and Research. The World
Bank worldbank.org/topic/ agriculture-and rural-development.
4UNEP. A Planet in Ecological Debt, Arendal Maps and Graphics
Library: UNEP 2009. http://maps.grida.no/go/graphic/a-planet-in-ecological-debt,
5UNDP. The Rise of the South: Human Progress in a Diverse
World. Human Development Report. The United Nations Development Programme. Gilmore Printing Services Inc., Canada, 2013, 216 pp.
6FAOSTAT FAO Statistical Database- Data Series 1960-2008
Food and Agriculture Organization, UN, www.fao.org, Rome, Italy.
7FAOSTAT Data Series.Food and Agriculture Organization,UN,
www.fao.org, Rome, Italy, 2008.
8UNFPA. The State of World Population. 2001.
9WWF, The Global Conservation Organization, Living planet
report/ footprint, 2002.
10WWF. Living Planet Report, World Wide Fund for
Nature.(WWF),http://www.panda.org/livingplanet.,Geneva, Switzerland, 2002.
11WWF, The Global Conservation Organization, living planet
report/ footprint, 2002.
12WWF, Living Planet Report Edited by Jenkins M., Jakubowska
J., Gaillard V., Groombridge B., M.WackernagelMonfreda, C., Deumling D., Gurarie E., Friedman S., Linares A.C., Sánchez M.A.V., Falfán I.S.L., Loh, J. Randers., S.J. and C. Monfreda, World Wildlife Fund (WWF), www.panda.org,, International. Avenue du Mont-Blanc, CH-1196 Gland, Switzerland. 2002
13WWF, Living Planet Report, World-Wide Fund for Nature
International (WWF), Global Footprint Network, UNEP World Conservation Monitoring Centre.WWF, Gland, Switzerland.http://www.panda.org/livingplanet, 2004.
14WWF, Living Planet Report, World Wide Fund (WWF) for
Nature, Gland, Switzerland http://
www.panda.org/livingplanet, 2006.
15WWF, Living Planet Report, Edited by Humphrey S., Chapagain
A., Bourne G., Mott R., Oglethorpe J., Gonzales A., Atkin M., Loh J., Collen B., McRae L., Carranza T.T., Pamplin F.A., Amin R., Baillie J.E.M., Goldfinger S., Wackernagel M., Stechbart M., Rizk S., Reed A., Kitzes J., Peller A., Niazi S., Ewing B., Galli A., Wada Y., Moran D., Williams R., Backer W.D., Hoekstra A.Y. and Mekonnen, M., 2008 World Wide Fund (WWF), www.panda.org,, International Avenue du Mont-Blanc 1196 Gland, Switzerland, 2008.
16WWF, Living Planet Report. World Wide Fund for Nature,
Gland, Switzerland, 2010.
17WWF, Living Planet Report, Biodiversity, biocapacity and better
choices.Editor in chief: Monique Grooten., Lead editors: Rosamunde Almond and Richard McLellan. Editorial team: Nigel Dudley, Emma Duncan, NatasjaOerlemans and Sue Stolton, 2012.
18WRI, World Resources Institute.. Earth Trends Environmental
Information, World Resource Institute (WRI). World Resource Institute: WRI http://Earthtrends.wri.org/. 1960-2005
3:04 PM Thu, Oct 19, 2017 Untitled
Page 1
1960.00 1978.00 1996.00 2014.00 2032.00 2050.00 Years 1: 1: 1: 2: 2: 2: 3: 3: 3: 15 16 17 0 0 0 25 70 115
1: Egyptian Maintenance Index 2: Deficit in Biological Capacity 3: HUMAN POPULATION
1 1 1 1 1 2 2 2 2 2 3 3 3 3 3
3:07 PM Thu, Oct 19, 2017
Untitled Page 1
1960.00 1978.00 1996.00 2014.00 2032.00 2050.00
Years 1: 1: 1: 2: 2: 2: 3: 3: 3: 15 16 17 0 0 0 25 50 75
1: Egyptian Maintenance Index 2: Deficit in Biological Capacity 3: HUMAN POPULATION
19WRI, World Resources Institute .2000-2001. People and
Ecosystems: The Fraying Web of Life. WorldResources Institute (WRI), Washington DC, USA, 2000.
20SIGMAPLOT Version 13. https://systatsoftware .com /products/
sigmaplot/
21STELLA Isee System. Technical Document for the iThink and
STELLA Software. 2006. Available at:
http://www.iseesystems.com..
22STELLA. Stella®, High Performance System, Inc., USA. 2010.
Available at: http://www.hps-inc.com/ stellavpsr.htm.
23SAS Institute Inc. SAS/STAT Product Documentation. SAS
Institute Inc., Cary, NC. 2011., URL
http://support.sas.com/documentation/onlinedoc/stat/.
24SAS Institute Inc. SAS/STAT User's Guide {Procedures. SAS
Institute Inc., Cary, NC.) 2011., URL
http://support.sas.com/documentation/onlinedoc/stat/indexpr
oc.html#stat93.
25Shakir Hanna, S. H. Harris, K. T., Osborne-Lee, I. W., Cesaretti,
G. P, Misso, R. and Andreopoulou, Z. S. Global Ecological Human Imprint, SustainableDevelopment and Environment: Assessmentand Impacts. Eur. J. Sustain. Dev., 2014, 3(3), 1-24. DOI 10.14207/ejsd.2014.v3n3p1
26Institute of National Planning, Egypt Human Development
Report. 1996