Proceedings of the
Tenth International Workshop on
Graph Transformation and
Visual Modeling Techniques
(GTVMT 2011)
Exploring (Meta-)Model Snapshots by
Combining Visual and Textual Techniques
Martin Gogolla, Lars Hamann, Jie Xu, Jun Zhang
13 pages
Guest Editors: Fabio Gadducci, Leonardo Mariani
Managing Editors: Tiziana Margaria, Julia Padberg, Gabriele Taentzer
ECEASST
Exploring (Meta-)Model Snapshots by
Combining Visual and Textual Techniques
Martin Gogolla1, Lars Hamann1, Jie Xu1, Jun Zhang1
University of Bremen, Computer Science Department1
Abstract: One central task in software development by means of graph-based tech-niques is to inspect and to query the underlying graph. Important issues are, for ex-ample, to detect general graph properties like connectivity, to explore more special features like the applicability of left-hand side rules in graph transformations, or to validate snapshots of evolving systems by checking properties in an on-the-fly way. We propose a new approach combining visual and textual techniques for explor-ing graphs. We emphasize a particular aspect of the underlyexplor-ing graph by showexplor-ing or hiding nodes and edges. We offer three different ways to explore (meta-)model snapshots which may be combined: (1) selection by object identity and class mem-bership, (2) selection by OCL expression, and (3) selection by path length. One main motivation for our work is to access large or complicated graphs in a sys-tematic way. We evaluate our approach by different middle-sized scenarios. Our evaluation shows that the approach works for large graphs with about 1000 nodes and 2000 edges and for graphs which instantiate metamodels representing software engineering artifacts.
Keywords: Model, Metamodel, Object diagram, Class diagram, Visual and graph-based analysis, Visual and graph-graph-based modeling, On-the-fly validation, Graph, Vi-sual query, Graphical query, Textual query, Tool support.
1
Introduction
One central task in software development by means of graph-based techniques is to inspect and to query the underlying graph. Important issues are, for example, to detect general graph properties like connectivity, or to explore more special features like the applicability of rules in graph transformations.
We propose a new approach combining visual and textual techniques for exploring graphs. We emphasize a particular aspect of the underlying graph by showing or hiding nodes and edges. The context of our work is established by our UML and OCL tool USE [GBR07]. USE stands for UML-based Specification Environment and allows the developer to validate and to a certain degree to verify UML and OCL models.
USE allows the developer (among other modeling features) to work with class diagrams and object diagrams. The notions ‘Class diagram’ and ‘Object diagram’ refer to the UML standard. Other areas in computer science know similar concepts but handle these under different names: database schema and database state, type graph and instance graph, metamodel and model. In-stead of ‘Object diagram’ we will also use the notion ‘(Model) Snapshot’ if we want to emphasize that a state at a particular moment is referred to.
Our approach to query graphs and models with textual and visual elements has connections to other related work. The proposal in [BKPT01, EW06] is designed to achieve a graphical representation of OCL expressions in order to bridge the gap between OCL and graph transfor-mations. [AB01] was one of the first papers to emphasize the role of OCL as a query language. [CP07] aims to represent SQL queries in a graphical way. The work in [WTEK08] translates a subset of OCL into graph transformations. The proposal in [RGL09] concentrates on class dia-grams only. [HKSS08] employs OCL queries for model execution. In [St¨o09] a general purpose visual model query language is introduced. [EB10] discusses the graph query language GReQL especially well-suited for reverse engineering. The Epsilon Object Language [KRP10] is very close to OCL but does not emphasize graphical features for querying. [CCGL10] employs OCL for graph transformation application conditions. In contrast to the mentioned papers, our work puts forward a combination of OCL and visual techniques. To the best of our knowledge, our approach is the first to combine OCL with graphical query features although the idea seems straightforward. All our ideas have been implemented in our tool USE [GBR07] as part of a Diploma thesis [XZ09]. Our decision for choosing the particular ways to query snapshots was determined by the fact that the implementation had to be finalized within a student project. The mentioned paper on USE also gives a good overview on many features of the tool.
The rest of this paper is structured as follows. In Section 2 we describe the general principles underlying our combination of textual and visual elements for querying snapshots. We offer three different ways to explore (meta-)model snapshots which may be combined: (1) selection by object identity and class membership, (2) selection by OCL expression, and (3) selection by path length. Section 3 evaluates our proposal by means of a few middle-sized example scenarios. Our evaluation shows that the approach works for large graphs with about 1000 nodes and 2000 edges and for graphs which instantiate metamodels representing software engineering artifacts. The paper ends with a conclusion and discussion of future work.
2
General Exploration Patterns
Our approach aims at exploring object diagrams in order to emphasize a particular aspect of or a view on the underlying graph by showing or hiding nodes and edges. We offer three different ways to explore object diagrams which may be combined. The general pattern for each possibil-ity is shown in Figures1,2and 3. These possibilities may be characterized as (1) selection by object identity and class membership, (2) selection by OCL expression, and (3) selection by path length.
ECEASST
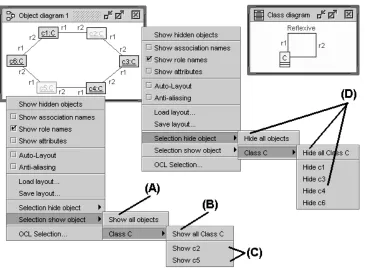
Figure 1: Selection by object identity and class membership
opens a choice (A) to either show all objects or (B) to show all objects of a particular class or (C) to show a hidden object which is determined by its object identity. The same is available for (D) hiding objects instead of showing objects. According to its visibility, each object appears in the respective choice, either in the show choice or in the hide choice. In addition, by right-clicking a single visible object in the object diagram it is possible to hide it.
Summary: Selection by object identity and class membership means to access objects by their identity or class membership and to hide or show objects in order to emphasize a particular aspect of the snapshot. All links between the determined objects are taken into account, but no links from the determined objects to other objects. Thus there cannot be any dangling edges. This applies to the two selection patterns discussed below, as well.
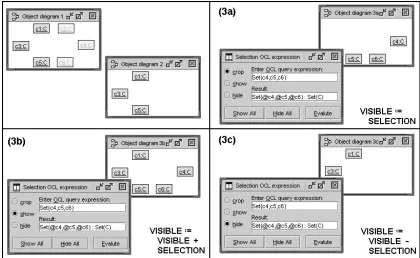
Figure 2: Selection by OCL expression
In order to explain the choices in an easy understandable way, the OCL expression in this example is established directly by the object collection c4, c5 and c6. In general, the OCL expression will determine objects having particular properties, as will be demonstrated below. The determined objects will in general be orthogonal to the visible and hidden ob-jects in the original object diagram. In Figure3we have visible objects c1, c3, c5, hidden objects c2, c4, c6, and the OCL expression determines objects c4, c5, c6. As shown in the object diagrams 3a-3c in Figure2, the three choices work as follows: (3a) ‘crop’ displays exactly the object collection determined by the OCL expression independent of the visi-bility in original object diagram, (3b) ‘show’ adds the object collection fixed by the OCL expression as visible objects, and (3c) ‘hide’ removes the object collection characterized by the OCL expression from the visible objects.
Summary: Selection by OCL expression means to access objects by properties which are determined by an OCL expression that must yield an object collection.
ECEASST
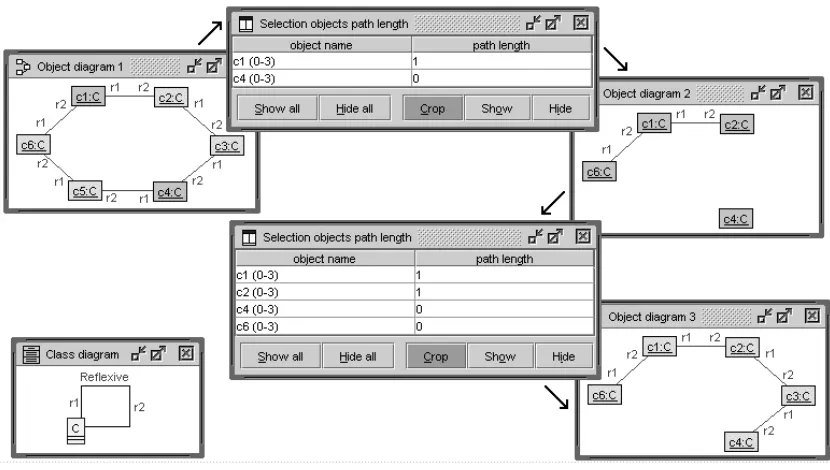
Figure 3: Selection by path length
display. In the example, starting with the object selection consisting of c1 and c4, one reaches the object set c1, c2, c3, c4, and c6 after two selections with the shown path lengths. As displayed in Figure3, starting with ‘Object diagram 1’ the upper path length selection leads to ‘Object diagram 2’ and the lower path length selection then leads to ‘Object diagram 3’.
In this example, the ‘crop’ choice was taken which displays exactly the selection. As before, instead of choosing ‘crop’ one could go for the alternatives ‘show’ or ‘hide’ for adding or removing the selection determined by the path lengths.
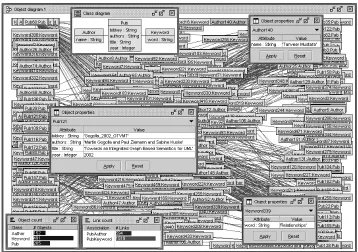
Figure 4: BibTeX Scenario: Class and Object Diagram
3
Evaluation
3.1 BibTeX Scenario
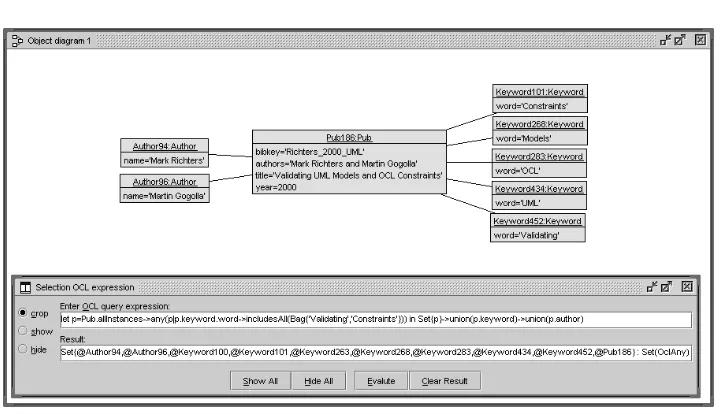
This subsection explains how the ‘OCL selection’ possibility works. Figure4shows the under-lying class and object diagram, and Figure5displays the OCL expression used for selection and its result.
ECEASST
Figure 5: BibTeX Scenario: Selection with OCL expression
3.2 European Capitals Scenario
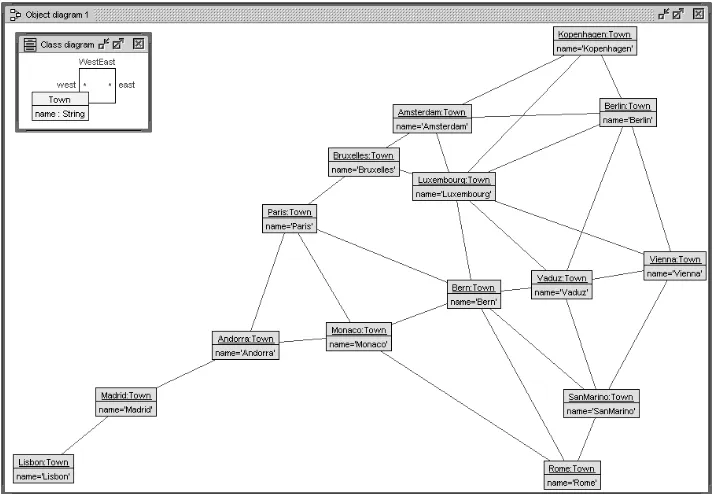
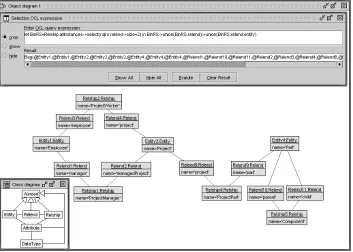
This subsection shows the ‘Selection by path length’ possibility in combination with an OCL expression. Figure6shows a simple class diagram and an object diagram for European capital towns. The layout in the object diagram tries to follow the real world coordinates of the towns. Thus, every shown link is a west-east link where the left role is the role ‘west’ and the right one is the role ‘east’. The object diagram in Figure7is achieved by first executing the OCL expression in the lower part of Figure7. Afterwards a second selection is made by means of the path length expression displayed in the upper part of the figure. The OCL expression searches for towns with a maximal number of east-west connections. In the example, there is exactly one town, Luxembourg, with this property. The second selection by path length starts with Luxembourg and determines all towns which may be reached from Luxembourg by at most one east-west edge.
3.3 Chen’s Original ER Diagram Scenario
The example in this subsection shows that our approach can be applied well to metamodels, i.e., models which when being instantiated again yield models. The UML class diagram shown in Figure 8 is taken from the original paper from Chen on the Entity-Relationship (ER) mo-del [Che76]. The concepts used are: Entity, Entity attribute, Data type, Relationship, Relation-ship attribute, Binary relationRelation-ship, Ternary relationRelation-ship, Reflexive relationRelation-ship. A metamodel for these concepts is shown in the left upper part of Figure 9 where (most of) the mentioned concepts are formally represented as classes. The object diagram in Figure 9 shows how the Entity-Relationship schema from Figure8is represented. The layout follows the layout of the original diagram but is much more complicated because all details are shown as separate objects. The object diagrams in Figure10and Figure11display views of the original object diagram.
Figure 6: Europe Scenario: Class and Object Diagram
an additional indication that this attribute is used for numbering, probably intended for unique identification. The entities of the attributes are present as well. The OCL query in Figure10
can be understood to be a search for the applicability of the refactoring ‘Extract Superclass’. All 4 Entity objects share the attribute name suffix ‘No’. This attribute could be placed in an abstract superclass ‘Numbered’.
Figure11 pictures all binary relationships. The selection process is again established by an OCL expression. The ternary relationship from the original diagram is missing and, of course, all other schema elements not touched by the OCL query.
ECEASST
Figure 7: Europe Scenario: Selection with OCL and path length expression
Figure 9: Metamodel Scenario: Metamodel representation of ER diagram
ECEASST
4
Conclusion
We have presented a new approach combining visual and textual techniques for exploring model snapshots. The textual part is determined by OCL, whereas the visual aspects are realized in the graphical user interface by interactive user involvement. Particular aspects of the underlying graph can be emphasized by showing or hiding nodes and edges. The approach supports the developer in validating object models in an on-the-fly way. All proposed ideas are implemented in our tool USE.
A bundle of future work topics can be identified. Larger case studies with feedback from developers need to be carried out. For example, one might offer in the user interface particular parametrized OCL patterns which are used frequently (like accessing all objects of a given set of finite classes). On the technical side, the approach must be extended to cope with associa-tion classes, because this modeling concept is not supported yet. An ‘undo’ funcassocia-tionality in the graphical user interface would be of help in situations where the desired view of the snapshot is achieved by a number of single query steps. In addition to the options ‘crop’ (display only the query result), ‘show’ (build the union of visible objects and the query result) and ‘hide’ (subtract the query result from the visible objects), a new option ‘clip’ could be implemented which builds the intersection of the visible objects and the query result. Up to now the selection concentrates on objects (manifestations of classes) and considers in the result all links between the selected objects avoiding dangling edges; a further possibility would be to allow to hide links (manifes-tations of associations) in a sophisticated way, for example, in form of an association tag which controls whether links of the respective association should be considered in the result or not. On the GUI, queries could also be evaluated only on the visible objects.
Another direction for future work could be to provide the possibility for detecting differences between two snapshots, for example, one snapshot before an operation execution and another snapshot after the operation execution (analogously for sequences of operation executions). One could show objects and links which were created or the ones which were deleted or show all attributes which were modified. Finally, after having developed an interesting snapshot with a number of textual and visual steps, one could generate a single OCL expression which computes the same snapshot as the sequence of textual and visual selections. In this sense, our approach could help to construct complex OCL expressions and would contribute to make OCL more user-friendly.
Bibliography
[AB01] D. H. Akehurst, B. Bordbar. On Querying UML Data Models with OCL. Pp. 91–103 in [GK01].
[BKPT01] P. Bottoni, M. Koch, F. Parisi-Presicce, G. Taentzer. A Visualization of OCL Using Collaborations. Pp. 257–271 in [GK01].
ECEASST
[Che76] P. P. Chen. The Entity-Relationship Model - Toward a Unified View of Data. ACM
Trans. Database Syst. 1(1):9–36, 1976.
[CP07] C. Cerullo, M. Porta. A System for Database Visual Querying and Query Visual-ization: Complementing Text and Graphics to Increase Expressiveness. In DEXA
Workshops. Pp. 109–113. IEEE Computer Society, 2007.
[EB10] J. Ebert, D. Bildhauer. Reverse Engineering Using Graph Queries. In Engels et al. (eds.), Graph Transformations and Model-Driven Engineering. Lecture Notes in Computer Science 5765, pp. 335–362. Springer, 2010.
[EW06] K. Ehrig, J. Winkelmann. Model Transformation From VisualOCL to OCL Using Graph Transformation. Electr. Notes Theor. Comput. Sci. 152:23–37, 2006.
[GBR07] M. Gogolla, F. B ¨uttner, M. Richters. USE: A UML-Based Specification Environ-ment for Validating UML and OCL. Science of Computer Programming 69:27–34, 2007.
[GK01] M. Gogolla, C. Kobryn (eds.). UML 2001: The Unified Modeling Language,
Model-ing Languages, Concepts, and Tools, 4th Int. Conference, ProceedModel-ings. LNCS 2185.
Springer, 2001.
[HKSS08] P. Habela, K. Kaczmarski, K. Stencel, K. Subieta. OCL as the Query Language for UML Model Execution. In Bubak et al. (eds.), ICCS (3). Lecture Notes in Computer Science 5103, pp. 311–320. Springer, 2008.
[KRP10] D. S. Kolovos, L. M. Rose, R. F. Paige. The Epsilon Book. http://www.eclipse.org/gmt/epsilon/doc/book/, 2010.
[RGL09] T. Raimbault, D. Genest, S. Loiseau. A Useful Logical Semantics of UML for Querying and Checking UML Class Diagram. In Filipe et al. (eds.), ICAART. Pp. 179–184. INSTICC Press, 2009.
[St¨o09] H. St¨orrle. VMQL: A Generic Visual Model Query Language. In VL/HCC. Pp. 199– 206. IEEE, 2009.
[WTEK08] J. Winkelmann, G. Taentzer, K. Ehrig, J. M. K ¨uster. Translation of Restricted OCL Constraints into Graph Constraints for Generating Meta Model Instances by Graph Grammars. Electr. Notes Theor. Comput. Sci. 211:159–170, 2008.
[XZ09] J. Xu, J. Zhang. Convenient Realization of Complex Selection in UML Class and
Object Diagrams. Diplom Thesis, University of Bremen, Department for