www.ijemst.com
Nigerian Preservice Science, Technology,
and Mathematics Teachers’ Computer
Self-Efficacy: An Exploration based on
Gender, Age and Discipline of Study
Adeneye O. A. Awofala1, Alfred O. Fatade2, Uchenna N. Udeani1
1 University of Lagos 2
Tai Solarin University of Education
To cite this article:
Awofala, A.O.A., Fatade, A.O., & Udeani, U.N. (2015). Nigerian preservice science,
technology and mathematics teachers’ computer self-efficacy: An exploration based on
gender, age, and discipline of study.
International Journal of Education in Mathematics,
Science and Technology
,
3
(2), 101-119.
This article may be used for research, teaching, and private study purposes.
Any substantial or systematic reproduction, redistribution, reselling, loan, sub-licensing,
systematic supply, or distribution in any form to anyone is expressly forbidden.
Authors alone are responsible for the contents of their articles. The journal owns the
copyright of the articles.
Volume 3, Number 2, April 2015, Page 101-119
ISSN: 2147-611X
Nigerian Preservice Science Technology and Mathematics Teachers’
Computer self-efficacy: An Exploration based on Gender, Age, and
Discipline of Study
Adeneye O. A. Awofala1*, Alfred O. Fatade2, Uchenna N. Udeani1
1University of Lagos 2
Tai Solarin University
Abstract
The global acceptance of information and communication technologies in education is not without barriers and one major barrier on the part of teacher educator implementation effort is preservice teachers’ perception of and capabilities for applying computer technology. Although the construct of computer self-efficacy has gained widespread investigation in the developed world, few researches have been conducted on this construct in Nigeria. The purpose of this study was to investigate preservice teachers’ level of computer self-efficacy and to determine the invariability of this construct with respect to the demographic variables of gender, age, and discipline of study. Using the slightly modified computer self-efficacy scale (Durndell, Haag & Laithwaite, 2000) in a cross-sectional survey involving a sample of preservice teachers at two universities (N=480), we found that preservice teachers reported high level of computer self-efficacy. Exploratory factor analysis of the survey data supported the multidimensional nature of the computer self-efficacy construct. A 2×3×2 multivariate analysis of variance showed that the construct of computer self-efficacy appeared invariant with respect to the demographic variables of discipline of study and age classification while gender remained a determining factor in preservice teachers’ aggregate computer self-efficacy even at the subscale levels of beginning and advanced skills.
Key words: Computer self-efficacy, Preservice teachers, Gender, Age, Discipline of study, Nigerian.
Introduction
The new millennium has witnessed global acceptance of computers, information and communication technologies (ICTs) in education. This is because, computers and ICTs integration in the curriculum may result in improvement of classroom instruction and learning (Libscomb & Doppen, 2004; Mills & Tincher, 2003), provide students with the required skills to effectively perform in the twenty-first century digital society (Norris, Sullivan, Poirot & Soloway, 2003), promote critical thinking skills (Harris, 2002), and enhance learning outcomes of achievement, motivation and attitudes (Waxman, Lin & Michko, 2003). Despite the potential benefits of computer technology integration in the curriculum, one major barrier on the path of teacher educator implementation effort is preservice teachers’ perception of and capabilities for applying computer technology (Compeau & Higgins, 1995). This phenomenon called computer self-efficacy (Murphy, Coover & Owen, 1989) is situated in the Bandura’s theory of self-efficacy (Bandura, 1993) which provides a basis for understanding the behaviour of individuals with regard to their acceptance or rejection of technology (Olivier & Shapiro, 1993). Computer self-efficacy defined as individual self-efficacy about using computers (Murphy, Coover & Owen, 1989), has been identified as a major determinant of computer-related ability and usage in organizational contexts (Madhavan & Phillips, 2010).
Literature is replete with numerous studies on factors affecting computer self-efficacy (Hasan, 2003; Potosky, 2002; Busch, 1995; Harrison & Rainer, 1992). Computer self-efficacy may determine the success of computer learning (Hsiao, Tu & Chung, 2012) is associated with self-confidence (Kinzie, Delcourt, & Powers, 1994) and the perceived computer self-efficacy of teachers will have an influence on their attitudes toward computers (Zhang & Espinoza, 1998; Griffin, 1988) and on computer assisted language learning (Ertmer, Addison, Lane,
*
Ross & Woods, 1999). Teachers with higher computer self-efficacy are likely to be more enthusiastic to use technology in their classrooms than those with lower self-efficacy (Pearson, Bahmanziari, Crosby & Conrad, 2003; Ertmer et al, 1999). Ertmer, Evenbeck, Cennamo and Lehman (1994) found that positive computer experience increased computer self-efficacy, but the actual amount of experience (i.e., time on task) had no correlation to the self-efficacy beliefs of undergraduate students. While computer self-efficacy is correlated to computer use (Hasan, 2003; Potosky, 2002; Compeau, Higgins & Huff, 1999; Marakas, Yi & Johnson, 1998; Compeau & Higgins, 1995), significant positive correlation exists between previous computer experience and computer self-efficacy and experience influences behavioural intentions to use computers indirectly through computer self-efficacy (Hill, Smith & Mann, 1987). Hakverdi, Gücüm & Korkmaz (2007) reported that the level of computer use and educational use of computers are closely related to the outcome measure of preservice science teachers’ personal efficacy in teaching with computers. Hasan (2007) found that computer self-efficacy had a significant direct effect on perceived usefulness and perceived ease of use as well as indirect effect on attitude and behavioural intention.
The relation between computer self-efficacy and demographic variables is gathering research momentum with current findings being inconclusive (Aremu & Fasan, 2011; Awoleye & Siyanbola, 2005; Bimer, 2000). Computer self-efficacy has been found to be a function of individual teacher characteristics such as gender, age, prior experience and subject areas (Paraskeva, Bouta & Papagianni, 2008). Studies have found gender differences in computer self-efficacy in favour of males (Simsek, 2011; Durndell & Haag, 2002; Torkzadeh & Koufteros, 1994; Harrison & Rainer, 1992) and in favour of females (Aremu & Fasan, 2011) whereas others have found no gender differences (Adebowale, Adediwura & Bada, 2009; Smith, 1994). With respect to age groupings in computer self-efficacy, findings are mixed. Adebowale et al (2009) found that age has nothing to do with computer self-efficacy while Hakverdi, Gücüm and Korkmaz (2007) found that computer self-efficacy has negative correlations with age and grade level of preservice science teachers. Chen (2012) found that younger teachers tend to have a higher computer self-efficacy which is associated with a low computer anxiety (Doyle, Stamouli & Huggard, 2005; Brosnan, 1998). The influences of demographic variables such as gender, age, and discipline of study on computer self-efficacy have drawn attention in the present study because they can add to potential interpretations of students’ low participation in computer related fields.
Like mathematics self-efficacy (Akinsola & Awofala, 2009), various scales have been developed to measure computer self-efficacy with the most popular scale developed by Murphy, Coover and Owen (1989). The original Murphy computer self-efficacy scale has been adapted by various researchers (Harrison & Rainer, 1992) and some other researchers have adapted a slightly modified version of the scale for their study (Torkzadeh & Koufteros, 1994; Delcourt & Kinzie, 1993; Ertmer et al., 1994; Zhang & Espinoza, 1998). However, the perception of inadequacy in statistical terms in previous scales as a result of the rapid change in society occasioned by explosion in ICT has led some researchers to develop their own measure of computer self-efficacy (Gist et al., 1989; Burkhardt & Brass, 1990; Compeau & Higgins, 1995) and the proliferation of the computer self-efficacy scale is ongoing.
Although most of these scales were developed in the late twentieth century, recent investigations have been conducted in order to re-examine their psychometric properties. While some saw the need for refinement (Torkzadeh, 2003; Torkzadeh & Koufteros, 1994) and slight modification to allow for changes in computer-related practice and technology (Durndell, Haag & Laithwaite, 2000), others (Simsek 2011) indicated no changes were needed. These scales were developed in the most technologically developed countries (e.g., UK, USA, etc.) where proliferation of computers in schools is evident (Durndell & Haag, 2002) and computer self-efficacy is culturally invariant in these societies (Barbeite & Weiss, 2004). Although there are studies in less developed countries on computer self-efficacy (Chen, 2012; Simsek, 2011; Halder & Chaudhuri, 2007; Seferoglu, 2007; Hakverdi, Gücüm & Korkmaz, 2007), and in Nigeria with in-service teachers and secondary school students samples (Aremu & Fasan, 2011; Adebowale, Adediwura & Bada, 2009), studies that determine the prevalence of computer self-efficacy in Nigerian preservice STM teachers’ sample are scarce. More so, studies that investigated the individual subscale scores of computer self-efficacy of Nigerian preservice (inservice) teachers in relation to their demographic variables are not in existence. This is a topical issue of concern going by the low level of technology integration into Nigerian schools at all levels and preservice teachers on completion of their programmes are expected to fill the vacant posts in the Nigerian Teaching Service Commissions made possible through expansion in school, retirement of teachers, and government policies to reduce graduate unemployment.
capabilities to use computers in diverse situations (Compeau & Higgins, 1995; Bandura, 1986) tend to believe that they are competent in operating computers and are eager to attend to computer related activities (Delcourt & Kinzie, 1993; Hill, Smith & Mann, 1987).
Purpose of the Study
The purposes of this study are threefold:
Firstly, to analyse the level of computer self-efficacy among Nigerian preservice science, technology, and mathematics teachers. Preservice science, technology, and mathematics teachers are expected to record low computer self-efficacy considering the low level of technological development and low ICT penetration in Nigeria.
Secondly, to determine the relationship between individual preservice teachers’ demographic variables and computer self-efficacy. It is conjectured that the preservice teachers’ gender, age, and discipline of study will relate positively and significantly with computer self-efficacy.
And thirdly, to examine the effects of demographic variables of gender, age, and discipline of study on computer self-efficacy of preservice teachers within the Nigerian higher education context. It is hypothesized that men and women will differ in their computer self-efficacy. Preservice teachers below the age 20 years and those within the age 20-30 years will differ in their computer self-efficacy. Discipline of study (science, technology, and mathematics) will exert an effect on computer self-efficacy
Research Hypotheses
1. Nigerian preservice science, technology, and mathematics teachers will record significantly low computer self-efficacy.
2. There will be significantly positive relationships between gender, age, and discipline of study and preservice teachers’ computer self-efficacy.
3. There will be significant main and interaction effects of gender, age, and discipline of study on preservice teachers’ computer self-efficacy.
Method
Participants
A sample of 480 out of 1,600 preservice teachers from two out of eight public universities in the south-western part of Nigeria participated in the study. Purposive sampling technique was used to select two universities and a random sampling technique was used to select the preservice science, technology and mathematics teachers in junior and senior years for the study. Purposive sampling was adopted because not all the universities were offering courses leading to the award of degrees in education science, technology and mathematics. 191 (39.79%) studied science [92 (48.17%) men, 99 (51.83%) women, Mage = 23.4 years, SD = 2.8, age range: 18-30
years], 106 (22.08%) studied technology [66 (62.26%) men, 40 (37.74%) women, Mage = 24.2 years, SD = 2.2,
age range: 18-30 years], and 183 (38.13%) studied mathematics [88 (48.09%) men, 95 (51.91%) women, Mage =
22.3 years, SD = 3.2, age range: 17-30 years] and altogether their ages ranged between 17 and 30 years (Mage =
23.3, SD = 2.7). There were 258 (53.75%) within the age bracket below 20 years and 222 (46.25%) within the age bracket 20-30 years.
Measures
The 29-item positively worded Computer Self-Efficacy Scale (CSES) (Durndell, Haag & Laithwaite, 2000) on a 5-point Likert type scale anchored by 1: strongly disagree and 5: strongly agree developed originally by Murphy, Coover, and Owen (1989) and refined by Torkzadeh and Koufteros (1994) and Durndell & Haag (2002) with a slight modification in the present study was administered to participants in the first semester. The modification was related to the rewording of one of the statements of the scale for clarity and to be in accordance to the current computer terminology. Thus, the item with the description “Calling up a data file to view on the monitor screen” in the original version was reworded as “Retrieving a data file to view on the monitor screen.” Each item in the section B of the CSES was preceded by the phrase ‘1 feel confident’ and provision was made in the section A for participants to indicate gender, age, year of study and discipline of study. Durndell and Haag (2002) reported reliability coefficient of .97 while Simsek (2011) reported reliability coefficient of .96 for student responses and .98 for teacher responses for the entire scale. The developers of this scale identify three different subscales within the overall scale (Torkzadeh & Koufteros, 1994), which normally correlate significantly with each other. Durndell and Haag (2002) found the three subscales correlating between .81 and .89 with each other, somewhat higher than the correlations (.64 to .79) found with the same scale in Romania (Durndell, Haag & Laithwaite, 2000). However, the modification of one item in the computer self-efficacy scale necessitated the re-assessment of the scale for full reliability and validity.
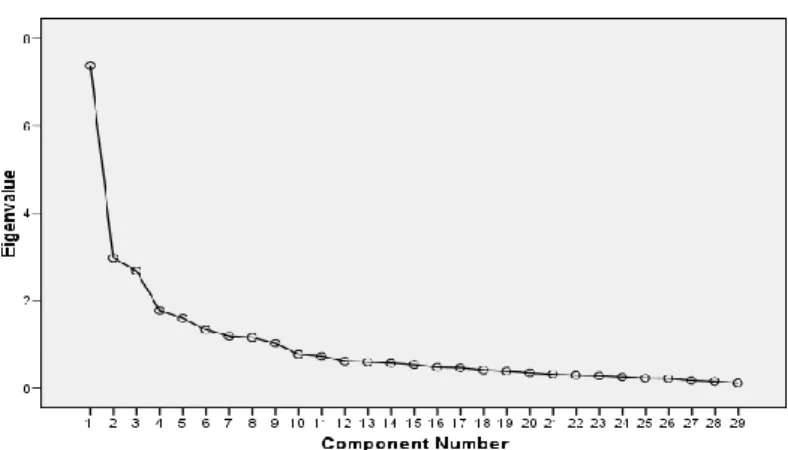
After collecting the data from the 480 preservice STM teachers through the 29-item positively worded five-point Likert computer self-efficacy scale, both the Bartlett’s Test of Sphericity and the Kaiser-Meyer-Olkin (KMO) measure of sampling adequacy were performed to examine whether the data set was appropriate for a factor analysis. The KMO is a test that compares the weight of observed correlation coefficients with the weight of partial correlation coefficients (Kalayci, 2005) and in cases where KMO is smaller than 0.50 (Tavşancil, 2002) or smaller than 0.60 (Büyüköztürk, 2002) factor analysis can no longer be resumed. The Bartlett's test of sphericity tests the hypothesis that the correlation matrix is an identity matrix and the value of Bartlett’s sphericity test gains and its significance indicate whether or not variables are inter-correlated and in cases where Bartlett’s sphericity test is above 0.05, factor analysis cannot be conducted (Şencan, 2005). In this study, the KMO measure of sampling adequacy was high (0.799) and significant (p = 0.000). Bartlett’s Test of Sphericity was also notably high and significant (chi-square = 7210.135 with 406 degree of freedom at p = 0.000). The mean scores were above the mid-point of 3.0 for all 29 items and these ranged from 3.41 to 4.29. The standard deviations ranged from .75 to 1.31 and the skewness and kurtosis indices were within the recommended values of |3| and |10| respectively (Kline, 1998). Then an exploratory factor analysis (principal components, direct oblimin rotation with Kaiser Normalization) was applied to analyze the items and to clarify the structure of the computer self-efficacy scale. The oblique rotation was used because it allows the factors to correlate with each other. This was needed since all subscales were expected to be inter-related and together form the overall computer self-efficacy level. The analysis identified three factors with eigenvalues > 1 and these were further confirmed by the Cattel scree plot (Figure 1).
Figure 1. Scree plot showing number of components and eigenvalues of the correlation matrix
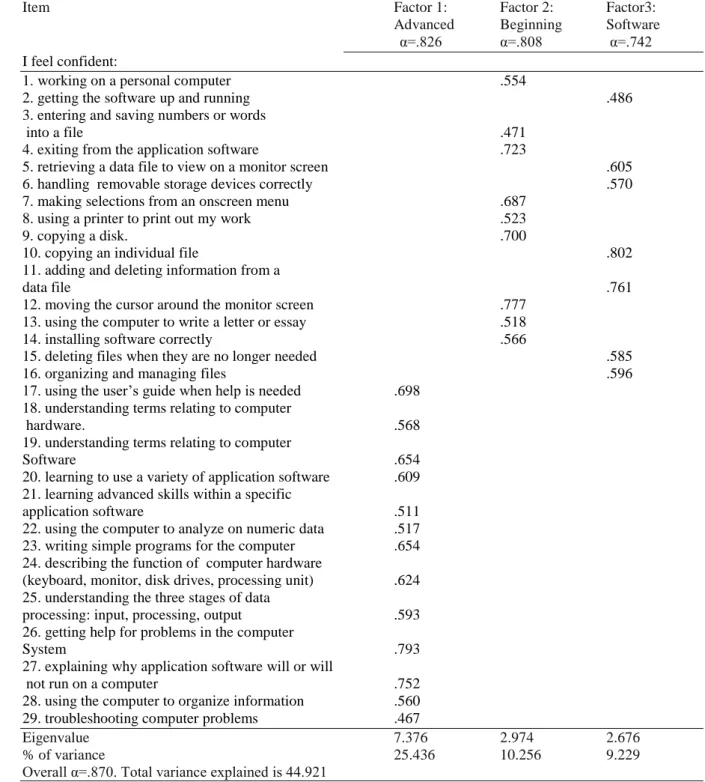
self-efficacy scale (Thompson & Daniel, 1996). The factor solution with three factors explained 44.92% of the global variance. All the items exhibited high loadings (>.40) on the constructs they were intended to measure, and no item displayed a higher loading on any unintended construct than its underlying construct. The zero order correlations for the whole sample between components of the CSE scale indicated that all three correlations between the three components of CSE score identified in the pilot testing were significant (p=.01). Beginning skills CSE correlated at +0.57 with advanced skills CSE, beginning skills CSE correlated at +0.46 with file and software skills CSE, and advanced skills CSE correlated at +0.21 with file and software skills CSE. Coefficient alpha for the beginning skills subscale was .808, advanced skills subscale was .826, and .742 for the file and software skills subscale and the overall Cronbach alpha reliability coefficient for the entire scale was calculated to be 0.870. These analyses were in agreement with those previously reported (Durndell & Haag, 2002; Barbeite & Weiss, 2004).
Table 1. Rotated factor loadings and Cronbach’s alpha coefficients for the three factors (subscales of the Computer Self-Efficacy Scale)
Item Factor 1: Factor 2: Factor3:
Advanced Beginning Software
α=.826 α=.808 α=.742
I feel confident:
1. working on a personal computer .554
2. getting the software up and running .486
3. entering and saving numbers or words
into a file .471
4. exiting from the application software .723
5. retrieving a data file to view on a monitor screen .605
6. handling removable storage devices correctly .570
7. making selections from an onscreen menu .687
8. using a printer to print out my work .523
9. copying a disk. .700
10. copying an individual file .802
11. adding and deleting information from a
data file .761
12. moving the cursor around the monitor screen .777
13. using the computer to write a letter or essay .518
14. installing software correctly .566
15. deleting files when they are no longer needed .585
16. organizing and managing files .596
17. using the user’s guide when help is needed .698 18. understanding terms relating to computer
hardware. .568
19. understanding terms relating to computer
Software .654
20. learning to use a variety of application software .609 21. learning advanced skills within a specific
application software .511
22. using the computer to analyze on numeric data .517 23. writing simple programs for the computer .654 24. describing the function of computer hardware
(keyboard, monitor, disk drives, processing unit) .624 25. understanding the three stages of data
processing: input, processing, output .593
26. getting help for problems in the computer
System .793
27. explaining why application software will or will
not run on a computer .752
28. using the computer to organize information .560
29. troubleshooting computer problems .467
Eigenvalue 7.376 2.974 2.676
% of variance 25.436 10.256 9.229
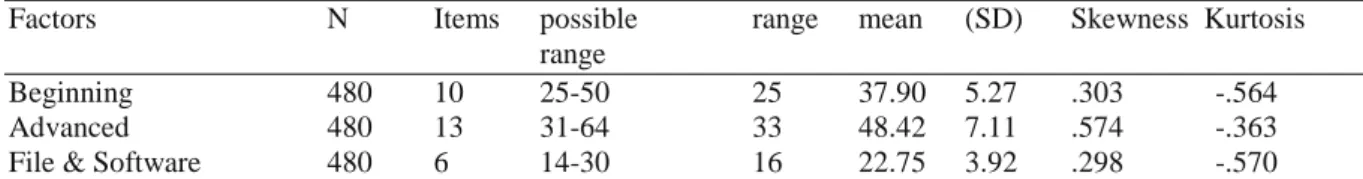
The descriptive results for the preservice science, technology and mathematics teachers’ scores on the subscales are indicated in Table 2. The higher mean scores of the participants on the subscales indicate high confidence toward the computer.
Table 2. The preservice science, technology and mathematics teachers’ scores on the subscales of the Computer Self-efficacy Scale
Factors N Items possible range mean (SD) Skewness Kurtosis
range
Beginning 480 10 25-50 25 37.90 5.27 .303 -.564
Advanced 480 13 31-64 33 48.42 7.11 .574 -.363
File & Software 480 6 14-30 16 22.75 3.92 .298 -.570
The degree of confidence was sorted into four categories (a) scores ranging between 29-57 were categorized as not confident, (b) 58–86 as little confidence, (c) 87-115 as confident, and (d) 116-145 as very confident on the computer self-efficacy scale. The confidence level was gotten by deducting one from five the highest scale level and multiplying one, two, three, and four by 29 the number of items on the scale to get the starting point of the confidence level for the convenience of the researchers. High scores indicate respondents’ high levels of self-efficacy in using computers and vice-versa.
The participants had taken and passed the university course requirement labeled “use of English” in the first semester of their freshman year. While admission into any university in Nigeria is predicated on entrants possessing a minimum of credit level pass in English Language in addition to credit level passes in four other university requirement Ordinary Level subjects, the participants in this study were adjudged to have acquired nothing less than the pass mark (40%) in English Language required by any student for graduation. More so, English is the official language and language of commerce, government, education and communication from primary four to the university level in Nigeria. With this level of competency in English Language, it was expected that none of the participants would find the CSES difficult to read, understand, and response to.
Procedure
Prior to the administration of the research instrument, details of the study in face-to-face meetings with the participants were given and all participants were told that their responses were anonymous and that they could withdraw at any time from the study. Thereafter, one of the researchers with the support of six research assistants who were graduate students in one of the universities administered the CSES to the participants in their respective cohorts (science, technology, and mathematics) while they filled the questionnaire within an average completion time of 15 minutes.
Data Analysis
Descriptive statistics of percentages, mean, standard deviation, and range were applied to the data in respect of the level of computer self-efficacy of the preservice teachers. A 2×3×2 MANOVA was used to determine whether significant effect of gender at two levels (male and female), discipline of study at three levels (science, technology, and mathematics), and age group at two levels (below 20 years and 20-30 years) each exist on preservice teachers’ computer self-efficacy. Pearson correlation analysis was then used to find the relationship between gender, discipline of study, age, and computer self-efficacy of preservice teachers.
Results and Discussion
Research Hypothesis-1: Nigerian preservice Science, Technology and Mathematics teachers will record significantly low computer self-efficacy.
A total score was computed from the 29 items, the range being 29 to 145. Table 3 displays the levels of computer self-efficacy among the preservice STM teachers. Of 480 preservice STM teachers, 6 (1.25%) had scores that fell within the little confident range (M=82.50, SD=5.96, score range: 71-86, 95%CI= 76.25–88.75), 353 (73.54%) had scores that fell within the confident range (M= 103.27, SD=6.78, score range: 87-116, 95%CI=102.56-103.98), while 121 (25.21%) had scores that fell within the very confident range (M=127.33,
Table 3. Overall computer self-efficacy levels
Computer self-efficacy levels N Percentage (%)
Not confident - -
Little confident 6 1.25
Confident 353 73.54
Very confident 121 25.21
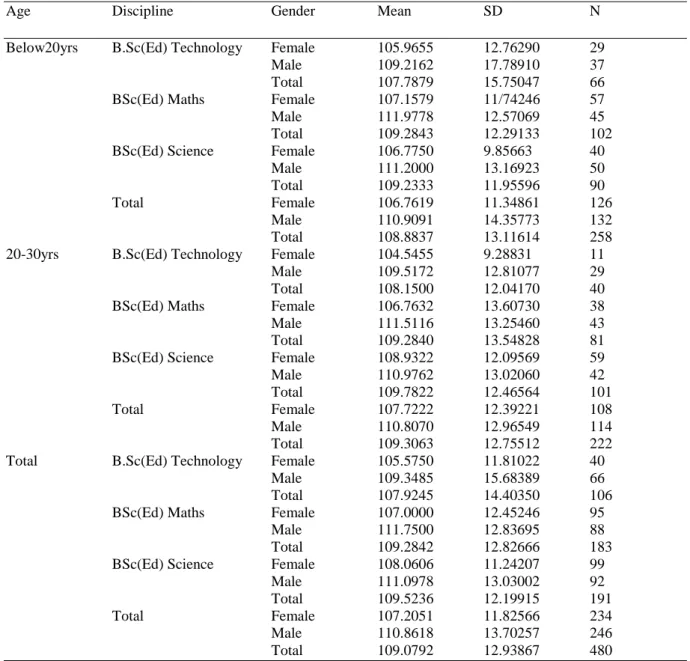
Over 98% of the participants showed that their levels of computer self-efficacy were in the confident or very confident categories. In short, the overall M=109.08, SD=12.94 as contained in Table 4 below, score range: 71-141, and 95%CI= 108.44–109.71 for the entire sample showed high degree of confidence in preservice teachers’ ability to use computers.
Table 4. Descriptive statistics of preservice science, technology and mathematics teachers’ computer self-efficacy according to gender, age, and discipline of study
Age Discipline Gender Mean SD N
Below20yrs B.Sc(Ed) Technology Female 105.9655 12.76290 29
Male 109.2162 17.78910 37
Total 107.7879 15.75047 66
BSc(Ed) Maths Female 107.1579 11/74246 57
Male 111.9778 12.57069 45
Total 109.2843 12.29133 102
BSc(Ed) Science Female 106.7750 9.85663 40
Male 111.2000 13.16923 50
Total 109.2333 11.95596 90
Total Female 106.7619 11.34861 126
Male 110.9091 14.35773 132
Total 108.8837 13.11614 258
20-30yrs B.Sc(Ed) Technology Female 104.5455 9.28831 11
Male 109.5172 12.81077 29
Total 108.1500 12.04170 40
BSc(Ed) Maths Female 106.7632 13.60730 38
Male 111.5116 13.25460 43
Total 109.2840 13.54828 81
BSc(Ed) Science Female 108.9322 12.09569 59
Male 110.9762 13.02060 42
Total 109.7822 12.46564 101
Total Female 107.7222 12.39221 108
Male 110.8070 12.96549 114
Total 109.3063 12.75512 222
Total B.Sc(Ed) Technology Female 105.5750 11.81022 40
Male 109.3485 15.68389 66
Total 107.9245 14.40350 106
BSc(Ed) Maths Female 107.0000 12.45246 95
Male 111.7500 12.83695 88
Total 109.2842 12.82666 183
BSc(Ed) Science Female 108.0606 11.24207 99
Male 111.0978 13.03002 92
Total 109.5236 12.19915 191
Total Female 107.2051 11.82566 234
Male 110.8618 13.70257 246
Total 109.0792 12.93867 480
Research Hypothesis-2: There will be significantly positive relationships between gender, age, and discipline of study and preservice teachers’ computer self-efficacy.
Pearson correlation analysis was used to assess the association between preservice teachers’ demographic variables (gender, age, and discipline of study) and computer self-efficacy. Table 5 below displays the Pearson correlation analysis results of the variables.
Table 5. Pearson correlation analysis results of the computer self-efficacy, gender, age, and discipline of study
CSE gender age discipline Mean SD
Comp. Self-Efficacy (CSE) 1 .141* .016 .044 109.08 12.94
Gender .141* 1 .002 -.096* 1.51 .50
Age .016 .002 1 .118** 1.46 .50
Discipline .044 -.096* .118** 1 2.18 .77
*significant at p<0.05, **significant at p<0.01
As contained in Table 5 above, only the gender out of the three demographic variables examined had statistically significant positive correlation with computer self-efficacy (Pearson’s r(480)= .141, p=.002), although the correlation was weak. The correlation is further examined at the computer self-efficacy subscale levels (Table 6) and there were significant correlations for computer self-efficacy subscales of beginning skills and advanced skills with gender. The beginning skills correlated positively with gender, Pearson’s r(480)= .140, p=.002 and advanced skills correlated positively with gender, Pearson’s r(480)= .127, p=.005 although both correlations were weak.
With regard to age and discipline of study, there were no statistically significant correlations between age and computer self-efficacy (Pearson’s r(480)= .016, p=.722) and between discipline of study and computer self-efficacy (Pearson’s r(480)= .044, p=.341). At the subscale level (Table 5b), age had no statistically significant correlations with the beginning skills (Pearson’s r(480)= .023, p=.612), advanced skills (Pearson’s r(480)= -.006, p=.889), and file and software skills (Pearson’s r(480)= .034, p=.455). While the discipline of study had a statistically significantly weak and positive correlation with the beginning skills (Pearson’s r(480)= .091,
p=.046), it had no statistically significant correlations with advanced skills (Pearson’s r(480)= -.021, p=.646) and file and software skills (Pearson’s r(480)= .060, p=.192).
Table 6. Pearson correlation analysis results of the computer self-efficacy subscales, gender, age, and discipline of study
1 2 3 4 5 6 Mean SD
1.Beginning skill 1 .57** .46** .140* .023 .091* 37.90 5.27 2.Advanced skill .57** 1 .21** .127* -.006 -.021 48.42 7.11 3.File & Software skill .46** .21** 1 .011 .034 .060 22.75 3.92
4.Gender .140* .127* .011 1 .002 -.096* 1.51 .50
5. Age .023 -.006 .034 .002 1 .118** 1.46 .50
6. Discipline .091* -.021 .060 -.096* .118** 1 2.18 .77
*significant at p<0.05, **significant at p<0.01
Research Hypothesis-3: There will be significant main and interaction effects of gender, age, and discipline of study on preservice science, technology and mathematics teachers’ computer self-efficacy.
Since the third objective of this study was to examine the main and interaction effects of gender, age, and discipline of study on preservice STM teachers’ computer self-efficacy, further examination of the collected data using a 2×3×2 multivariate analysis of variance (MANOVA) was carried out. The adoption of the MANOVA was based on the fact that there were more than one dependent variable which were related in some way (Pallant, 2001) thus revealing whether the differences existed between the groups (gender, age, and discipline of study) on the dependent variables (beginning, advanced, and file and software skills).
cell should be more than the number of the dependent variables (Pallant, 2001). Thus, the expected minimum number of cases in each cell in this study was three (the number of dependent variables) but we have enough cells (independent variables were gender at two levels, age group at two levels, and discipline of study at three levels). Therefore the sample size (N=480) assumption was met in this study. During the administration of the questionnaire, the Independence of Observations assumption was checked in that it was assumed that the participants were independent, each participant completed the questionnaire individually, and there was no interaction among the participants in the classroom. As noted by Stevens (2002), any violation of this assumption should lead the researcher to set a more stringent alpha value. For the Normality assumption, the univariate normality of observations on each variable was examined in order to detect multivariate normality assumption. The non-significant F tests from BOX’s M statistic was the sign of homogeneity of variance and covariance matrices (p>0.05). According to Pallant (2001), in large samples violation of the assumption of normality is quite met. The Mahalanobis distance was calculated as 5.38 and this value was found lower than the critical value given in the Chi-square table. In this study, there are three dependent variables, so the critical value is 16.27 in the Chi-square table. If Mahalanobis distance is greater than the critical value, there are multivariate outliers (Pallant, 2001). In this study, no cases had higher values than the critical value and so there were no multivariate outliers. For Outliers, Field (2005) noted that if the sample size is small (80 or fewer cases), a case is an outlier if its standard score is ±2.5 or beyond whereas if the sample size is larger than 80 cases, a case is an outlier if its standard score is ±3.0 or beyond. In this study, no cases were detected as outliers since no cases with standardised scores exceeding ±3.0 were detected. So, there was no threat of outliers and the sample size of the study did not change and this was considered suitable for the MANOVA. The assumption of linearity was checked by generating scatter plots separately for each pair of dependent variables and the straight-line relationship between each group was controlled. The scatter plots showed that there was no violation of the linearity assumption. For Multicollinearity and Singularity assumption, the correlation coefficients were calculated and the strength of the correlations among dependent variables examined. Pallant (2001) maintained that correlations up around .8 or .9 were not appropriate for the statistic. Thus, in this study, Pearson correlation coefficients between dependent variables ranged from .210 to .571 and did not exceed the value of .8. So, there was no violation of the multicollinearity assumption.
In the case of Homogeneity of Variance-Covariance Matrices assumption, a separate MANOVA was conducted for the each independent variable. The results of the Box Test of Equality of Covariance Matrices showed that the assumption of homogeneity of variance-covariance matrices was not violated. According to Pallant (2001), if the significance value is greater than .001, the assumption is not violated. In this study, significance value was .031 and higher than .001 which indicated that there was no violation of the assumption. Furthermore, in the Levene’s Test of Equality of Error Variances table, if the significance value is less than .05, this indicates that there is a violation of the assumption (Pallant, 2001). For beginning and file and software subscales, significance values of .082 and .407 were higher than .05 respectively but significance value of .000 was recorded for advanced skill subscale and this indicated a violation of the assumption. According to Stevens (2009), if the sizes of the groups are equal (e.g., largest/smallest<1.5), analysis of variance is robust to violation of this assumption and the violation of the assumption has the minimal effect. In this study, when the largest group size divided to smallest group size, the ratio obtained was smaller than 1.5. So MANOVA can be conducted.
Main Effects of Gender, Age, and Discipline of Study on Preservice Teachers’ Computer Self-Efficacy
This study predicted that (i) gender (ii) age and (iii) discipline of study would not have any significant main effect on preservice teachers’ computer self-efficacy and table 6 below shows the descriptive statistics of the preservice teachers on beginning skills in computer according to gender (men and women), discipline of study (science, technology, and mathematics), and age group (below 20 years and 20-30 years). A three-way multivariate analysis was conducted to investigate the effects of gender, age group, and discipline of study on preservice teachers’ computer self-efficacy (i.e. beginning, advanced, and file and software skills). In order to evaluate multivariate significance, Pillai’s Trace statistic was used. According to Tabachnick and Fidell (2007), if there is violation of some assumptions, Pillai’s Trace is more robust. MANOVA results regarding the gender, age group, and discipline of study are presented in Table 7.
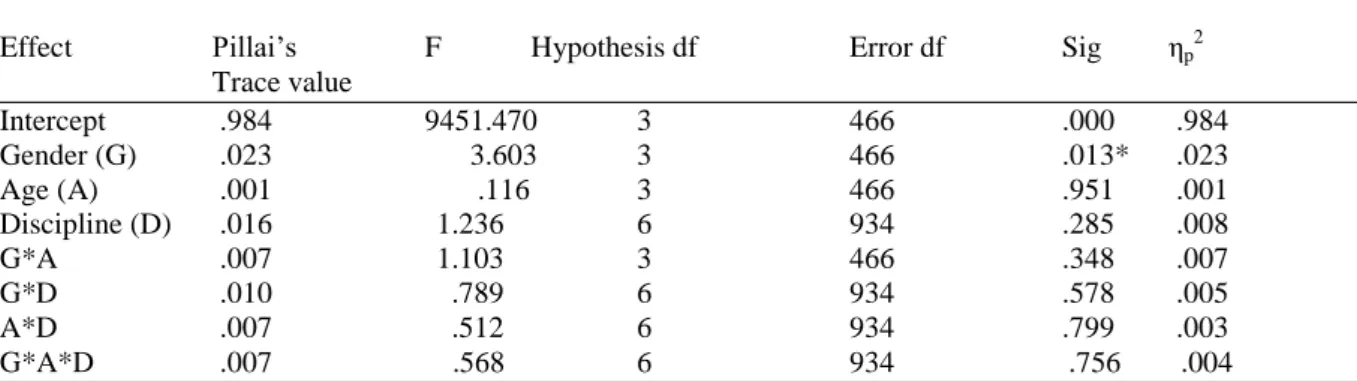
Table 7. MANOVA results for gender, age group, and discipline of study
Effect Pillai’s F Hypothesis df Error df Sig ηp
2
Trace value
Intercept .984 9451.470 3 466 .000 .984
Gender (G) .023 3.603 3 466 .013* .023
Age (A) .001 .116 3 466 .951 .001 Discipline (D) .016 1.236 6 934 .285 .008 G*A .007 1.103 3 466 .348 .007 G*D .010 .789 6 934 .578 .005 A*D .007 .512 6 934 .799 .003 G*A*D .007 .568 6 934 .756 .004 *significant at p<.05.
However, there were no statistically significant age group and discipline of study effects on the combined dependent variables (Pillai’s Trace=0.001, F (3, 466)=.116, p=0.95, multivariate ηp2=0.001), (Pillai’s
Trace=0.016, F (6, 934)= 1.236, p=0.285, multivariate ηp2=0.008) respectively. This indicates that computer self-efficacy scores of preservice teachers within the age groups below 20 years (M=108.88, SD=13.12) and 20-30 years (M=109.31, SD=12.76) did not differ significantly (p<0.05). More so, the computer self-efficacy scores among preservice teachers with different disciplines of study (Science: M=108.06, SD=11.24), (Technology: M=107.92, SD=14.40), and (Mathematics: M=107.00, SD=12.45) did not differ significantly. Based on these results, we upheld that gender had a significant main effect while age and discipline of study did not have any significant main effects on preservice teachers’ computer self-efficacy.
Two-way and Three-way Interaction Effects of Gender, Age, and Discipline of Study on Preservice Teachers’ Computer Self-Efficacy
The results of this study revealed no statistically significant interaction effects between gender and age (Pillai’s Trace=0.007, F(3,466)=1.103, p=0.348, multivariate ηp2=0.007), gender and discipline of study (Pillai’s
Trace=0.010, F(6,934)=0.789, p=0.578, multivariate ηp2=0.005), age and discipline of study (Pillai’s Trace=0.007, F(6,934)=0.512, p=0.799, multivariate ηp2=0.003), and gender, age and discipline of study (Pillai’s Trace=0.007, F(6,934)=0.568, p=0.756, multivariate ηp2=0.004) on preservice teachers’ computer self-efficacy.
Further investigations on which dependent variables preservice teachers with different gender (girls and boys), different age groups (below 20 years and 20-30 years) and different discipline of study (science, technology, and mathematics) differed necessitated the adoption of the follow-up univariate analyses of variance and significance was tested using the Bonferroni method which reduces the chance of a type 1 error. This was achieved in this study by dividing the original alpha level of 0.05 by the number of dependent variables and since there were three dependent variables, the alpha level of 0.0167 (0.05/3) was found. Thus, subsequent interpretation of effects on each of the dependent variables was made based on Bonferroni adjusted alpha level of 0.0167. The follow-up analyses for pairwise comparisons are displayed in Table 9, 11 and 13. These tables show the results of the hypotheses stated for the study.
Main Effects of Gender, Age, and Discipline of Study on Preservice Teachers’ Beginning Skills in Computer
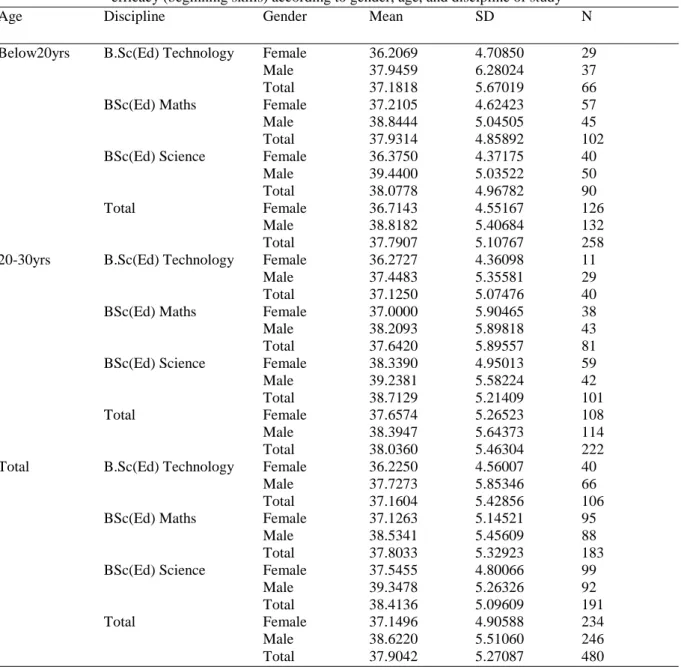
Table 8. Descriptive statistics of preservice science, technology and mathematics teachers’ computer self-efficacy (beginning skills) according to gender, age, and discipline of study
Age Discipline Gender Mean SD N
Below20yrs B.Sc(Ed) Technology Female 36.2069 4.70850 29
Male 37.9459 6.28024 37
Total 37.1818 5.67019 66
BSc(Ed) Maths Female 37.2105 4.62423 57
Male 38.8444 5.04505 45
Total 37.9314 4.85892 102
BSc(Ed) Science Female 36.3750 4.37175 40
Male 39.4400 5.03522 50
Total 38.0778 4.96782 90
Total Female 36.7143 4.55167 126
Male 38.8182 5.40684 132
Total 37.7907 5.10767 258
20-30yrs B.Sc(Ed) Technology Female 36.2727 4.36098 11
Male 37.4483 5.35581 29
Total 37.1250 5.07476 40
BSc(Ed) Maths Female 37.0000 5.90465 38
Male 38.2093 5.89818 43
Total 37.6420 5.89557 81
BSc(Ed) Science Female 38.3390 4.95013 59
Male 39.2381 5.58224 42
Total 38.7129 5.21409 101
Total Female 37.6574 5.26523 108
Male 38.3947 5.64373 114
Total 38.0360 5.46304 222
Total B.Sc(Ed) Technology Female 36.2250 4.56007 40
Male 37.7273 5.85346 66
Total 37.1604 5.42856 106
BSc(Ed) Maths Female 37.1263 5.14521 95
Male 38.5341 5.45609 88
Total 37.8033 5.32923 183
BSc(Ed) Science Female 37.5455 4.80066 99
Male 39.3478 5.26326 92
Total 38.4136 5.09609 191
Total Female 37.1496 4.90588 234
Male 38.6220 5.51060 246
Total 37.9042 5.27087 480
As observed in Table 9 below, there was a statistically significant main effect of gender [F (1, 468)= 9.554; p=.002; univariate ηp2=.020] on preservice teachers’ beginning skills in computer. In other words, men (M =
38.62, SD=5.51) had higher mean scores in beginning skills in computer compared to the women (M= 37.15;
SD=4.91), and this difference was statistically significant (p<0.0167). However, there were no statistically significant main effects of age [F (1, 468)= 0.024; p=.878; univariate ηp2=.000] and discipline of study [F (2, 468)= 2.062; p=.128; univariate ηp2=.009] on preservice teachers’ beginning skills in computer respectively.
Two- and three-way interaction effects of gender, age, and discipline of study on preservice teachers’ beginning skills in computer
The results of this study revealed no statistically significant interaction effects between gender and age [F (1, 468)= 1.006; p=.316; univariate ηp2=.002], gender and discipline of study [F (2, 468)= 0.151; p=.860; univariate
ηp2=.001], age and discipline of study [F(2, 468)= 0.777; p=.460; univariate ηp2
=.003], and gender, age and discipline of study [F (2, 468)= 0.361; p=.697; univariate ηp2=.002] on preservice teachers’ beginning skills in
Table 9. Follow- up pairwise comparisons of univariate analyses
Source Dependent Type III SS df Mean Square F Sig ηp2
Variable
Corrected model beginning 518.551 11 47.141 1.725 .065 .039
Intercept beginning 565703.625 1 565703.625 20701.264 .000 .978
Gender (G) beginning 261.095 1 261.095 9.554 .002* .020
Age (A) beginning .649 1 .649 .024 .878 .000
Discipline (D) beginning 112.719 2 56 .360 2.062 .128 .009
G*A beginning 27.480 1 27.480 1.006 .316 .002
G*D beginning 8.262 2 4.131 .151 .860 .001
A*D beginning 42.481 2 21.240 .777 .460 .003
G*A*D beginning 19.752 2 9.876 .361 .697 .002
Error beginning 12789.040 468 27.327
Total beginning 702936.000 480
Corrected total beginning 13307.592 479 *significant at p<.05
Main effects of gender, age, and discipline of study on preservice teachers’ advanced skills subscale of computer self-efficacy
This study predicted that (i) gender (ii) age and (iii) discipline of study would not have any significant main effect on preservice teachers’ advanced skills in computer and table 9 below shows the descriptive statistics of the preservice teachers on advanced skills in computer according to gender (men and women), discipline of study (science, technology, and mathematics), and age group (below 20 years and 20-30 years). This dimension was measured in the present study with 13 items, thus a maximum score of 65 (13×5) and a minimum score of 13 (13×1) could be obtained from this subscale. In this study we could say that preservice teachers’ advanced skills in computer was high (M= 48.42, SD=7.11).
As observed in Table 10 below, there was a statistically significant main effect of gender [F (1, 468)= 7.321; p=.007; univariate ηp2=.015] on preservice teachers’ advanced skills in computer. In other words, men (M =
49.30, SD=7.86) had higher mean scores in advanced skills in computer compared to the women (M= 47.30;
SD=6.12), and this difference was statistically significant (p<0.0167). However, as contained in Table 10 below there were no statistically significant main effects of age [F (1, 468)= 0.101; p=.750; univariate ηp2=.000] and
discipline of study [F (2, 468)= 0.495; p=.610; univariate ηp2=.002] on preservice teachers’ advanced skills in computer respectively.
Two-way and Three-way Interaction Effects of Gender, Age, and Discipline of Study on Preservice Teachers’ Advanced Skills in Computer
The results of this study revealed no statistically significant interaction effects between gender and age [F (1, 468)= 0.150; p=.698; univariate ηp2
=.000], gender and discipline of study [F (2, 468)= 0.609; p=.544; univariate ηp2=.003], age and discipline of study [F (2, 468)= 0.085; p=.919; univariate ηp2=.000], and gender, age and
discipline of study [F (2, 468)= 0.032; p=.968; univariate ηp2=.000] on preservice teachers’ advanced skills in
Table 10. Descriptive statistics of preservice science, technology and mathematics teachers’ computer self-efficacy (advanced skill) according to gender, age, and discipline of study
Age Discipline Gender Mean SD N
Below20yrs B.Sc(Ed) Technology Female 47.2069 6.58125 29
Male 49.4054 9.80493 37
Total 48.4394 8.55054 66
BSc(Ed) Maths Female 47.5614 6.61712 57
Male 49.8889 7.58354 45
Total 48.5882 7.11901 102
BSc(Ed) Science Female 48.1000 5.55993 40
Male 48.5400 7.27930 50
Total 48.3444 6.53970 90
Total Female 47.6508 6.25117 126
Male 49.2424 8.11757 132
Total 48.4651 7.29591 258
20-30yrs B.Sc(Ed) Technology Female 46.4545 4.20389 11
Male 49.0345 6.84253 29
Total 48.3250 6.28546 40
BSc(Ed) Maths Female 47.5789 6.14083 38
Male 50.1860 7.50319 43
Total 48.9630 6.97933 81
BSc(Ed) Science Female 47.3220 6.22963 59
Male 48.7619 8.23084 42
Total 47.9208 7.12697 101
Total Female 47.3241 5.98570 108
Male 49.3684 7.58464 ` 114
Total 48.3739 6.91446 222
Total B.Sc(Ed) Technology Female 47.0000 5.97957 40
Male 49.2424 8.57018 66
Total 48.3962 7.74188 106
BSc(Ed) Maths Female 47.5684 6.39756 95
Male 50.0341 7.50241 88
Total 48.7541 7.04067 183
BSc(Ed) Science Female 47.6364 5.95126 99
Male 48.6413 7.68555 92
Total 48.1204 6.84191 191
Total Female 47.5000 6.11917 234
Male 49.3008 7.85941 246
Total 48.4229 7.11480 480
Table 11. Follow- up pairwise comparisons of univariate analyses
Source Dependent Type III SS df Mean Square F Sig ηp2
Variable
Corrected model advanced 513.003 11 46.637 .920 .521 .021
Intercept advanced 929416.871 1 929416.871 18326.638 .000 .978
Gender (G) advanced 371.260 1 371.260 7.321 .007* .015
Age (A) advanced 5.144 1 5.144 .101 .750 .000
Discipline (D) advanced 50.171 2 25.086 .495 .610 .002
G*A advanced 7.621 1 7.621 .150 .698 .000
G*D advanced 61.819 2 30.910 .609 .544 .003
A*D advanced 8.611 2 4.306 .085 .919 .000
G*A*D advanced 3.269 2 1.634 .032 .968 .000
Error advanced 23734.145 468 50.714
Total advanced 114941.000 480
Main Effects of Gender, Age, and Discipline of Study on Preservice Teachers’ File and Software Skills Subscale of Computer Self-Efficacy
This study predicted that (i) gender (ii) age and (iii) discipline of study would not have any significant main effect on preservice teachers’ file and software skills in computer and Table 12 below shows the descriptive statistics of the preservice teachers on file and software skills in computer according to gender (men and women), discipline of study (science, technology, and mathematics), and age group (below 20 years and 20-30 years). This dimension was measured in the present study with 7 items, thus a maximum score of 35 (7×5) and a minimum score of 7 (7×1) could be obtained from this subscale. In this study we could say that preservice teachers’ file and software skills in computer was high (M= 22.75, SD=3.92).
Table 12. Descriptive statistics of preservice science, technology and mathematics teachers’ computer self-efficacy (file and software skill) according to gender, age, and discipline of study
Age Discipline Gender Mean SD N
Below20yrs B.Sc(Ed) Technology Female 22.5517 3.56156 29
Male 21.8649 4.59566 37
Total 22.1667 4.15686 66
BSc(Ed) Maths Female 22.3860 3.57948 57
Male 23.2444 3.60653 45
Total 22.7647 3.59917 102
BSc(Ed) Science Female 22.3000 3.22013 40
Male 23.2200 3.88766 50
Total 22.8111 3.61611 90
Total Female 22.3968 3.43879 126
Male 22.8485 4.02565 132
Total 22.6279 3.75011 258
20-30yrs B.Sc(Ed) Technology Female 21.8182 3.68288 11
Male 23.0345 4.63282 29
Total 22.7000 4.38061 40
BSc(Ed) Maths Female 22.1842 4.16456 38
Male 23.1163 4.33265 43
Total 22.6790 4.25390 81
BSc(Ed) Science Female 23.2712 3.90769 59
Male 22.9762 3.98465 42
Total 23.1485 3.92272 101
Total Female 22.7407 3.98682 108
Male 23.0439 4.24971 114
Total 22.8964 4.11740 222
Total B.Sc(Ed) Technology Female 22.3500 3.56299 40
Male 22.3788 4.61358 66
Total 22.3679 4.22988 106
BSc(Ed) Maths Female 22.3053 3.80390 95
Male 23.1818 3.95534 88
Total 22.7268 3.89162 183
BSc(Ed) Science Female 22.8788 3.65969 99
Male 23.1087 3.91238 92
Total 22.9895 3.77525 191
Total Female 22.5556 3.69768 234
Male 22.9390 4.12364 246
Total 22.7521 3.92239 480
In Table 13 below, there were no statistically significant main effects of gender [F (1, 468)= 1.546; p=.214; univariate ηp2=.003], age [F (1, 468)= 0.124; p=.725; univariate ηp2=.000] and discipline of study [F (2, 468)=
Two-way and Three-Way Interaction Effects of Gender, Age, and Discipline of Study on Preservice Teachers’ File and Software Skills Subscale of Computer Self-Efficacy
The results of this study in Table 13 below revealed no statistically significant interaction effects between gender and age [F (1, 468)= 0.103; p=.748; univariate ηp2
=.000], gender and discipline of study [F (2, 468)= 0.312; p=.732; univariate ηp2=.001], age and discipline of study [F (2, 468)= 0.213; p=.808; univariate ηp2=.001], and
gender, age and discipline of study [F (2, 468)= 1.171; p=.311; univariate ηp2=.005] on preservice teachers’ file
and software skills in computer.
Table 13. Follow- up pairwise comparisons of univariate analyses
Source Dependent Type III SS df Mean Square F Sig ηp2
Variable
Corrected model file &soft 115.833 11 10 .530 .679 .759 .016 Intercept file &soft 204328.029 1 204328.029 13183.063 .000 .966
Gender (G) file &soft 23.959 1 23.995 1.546 .214 .003
Age (A) file &soft 1.919 1 1.919 .124 .725 .000
Discipline (D) file &soft 22.905 2 11.453 .739 .478 .003
G*A file &soft 1.603 1 1.603 .103 .748 .000
G*D file &soft 9.684 2 4.842 .312 .732 .001
A*D file &soft 6.607 2 3.303 .213 .808 .001
G*A*D file &soft 36.299 2 18.150 1.171 .311 .005
Error file &soft 7253.665 468 15.499
Total file &soft 255845.000 480 Corrected total file &soft 7369.498 479
Prior research in the new millennium has indicated very high computer self-efficacy among preservice teachers in developed countries (Barbeite & Weiss, 2004) even in relatively developed countries such as Taiwan (Chen, 2012). The present study found a high computer self-efficacy among Nigerian preservice science, technology, and mathematics teachers. This finding corroborates prior research in Nigeria in which Aremu and Fasan (2011) found that the computer self-efficacy was average for most of the teachers (n=589) but disagrees with findings especially in rural communities (Halder & Chaudhuri, 2010) and among Thai undergraduate students who had neutral confidence in using computer applications (Niowan & Norcio, 2006).
The finding of high computer self-efficacy recorded in this study showed that most of the preservice science, technology and mathematics teachers were digital natives born within the period of rapid transformation in ICT and who at one time or the other saw the need to be engaged with computers and be computer literate. This finding is in sharp contrast with the initial expectation. The preservice science, technology and mathematics teachers were expected to record low computer self-efficacy in consonance with low level of technology development in Nigeria dotted with large rural communities. This encouraging finding is more surprising considering the report of the International Telecommunication Union (ITU) ICT development index which captures the level of advancement of ICTs in more than 150 countries world-wide and compares progress made at five years interval and for this reference between 2002 and 2007, that ranked Nigeria 130th in 2007 and 123rd in 2002 with ICT Development Index (IDI) of 1.39 and 1.09 respectively. This finding ran contrary to the report of a study conducted by the Global Information Technology (2004) that ranked Nigeria 86th out of 104 countries surveyed using the Networked Readiness Index (NRI), to measure the degree of preparation of a nation or community to participate in and benefit from ICT developments. Succeeding the year 2004, Nigeria was ranked 90th out of a total of 115 countries surveyed (Global Information Technology, 2005) and this showed a decline in Nigeria’s preparedness to participate in and benefit from ICT development globally.
indicated that computers have some gendered attributes in which men are more likely to use computers and are more confident than women.
The findings of significant gender effects on two subscales of the computer self-efficacy (beginning and advanced skills) further buttressed the fact that gender inequity in computer self-efficacy may not be over yet although some studies have indicated no difference. Durndell et al. (2000) reported no significant mean difference between genders in relation to computer self-efficacy in computer beginning skills while Cassidy and Eachus (2002) reported that there was a significant mean difference between males and females pertaining to computer self-efficacy. Öztürk et al. (2011) found out that computer-related self-efficacy perception scores of prospective teachers differed significantly according to gender. That men and women display dissimilar computer self-efficacy in the present study could mean that they vary in their motivations to use computers and encouraging women to engage in the use of computers may reduce the gender differences in computer self-efficacy. In the present study there were significant correlations for computer self-efficacy subscales of beginning skills and advanced skills with gender. The beginning skills correlated positively with gender and advanced skills correlated positively with gender although both correlations were weak. In this study, gender correlated positively with aggregate computer self-efficacy, although the correlation was weak.
The non significant effect of discipline of study on preservice teachers’ computer self-efficacy in this study is explainable considering the fact that the participants were in computer related disciplines and might have had similarly richer prior experience in computer use due to their exposure to introductory computer science course in their freshman year and the need for them to constantly engage in the use of computers in their studies. This finding is further corroborated by the no significant correlation between discipline of study and computer self-efficacy recorded in this study. At the subscale level, discipline of study had a statistically significantly weak and positive correlation with the beginning skills but had no statistically significant correlations with advanced skills and file and software skills in the present study. This findings disagrees with the result of the survey by Paraskeva, Bouta and Papagianni (2008) who found positive correlation between teachers’ subject area (classical or social studies, sciences, and technology subjects: internet, computers, and multimedia) and computer self-efficacy. Adebowale, Adediwura and Bada (2009) found that gender had no significant influence on secondary school students’ computer self-efficacy whereas fields of study showed significant effect.
The non significant effect of age on preservice teachers’ computer self-efficacy recorded in this study shows that the two age groups (below 20 years and 20-30 years) considered might not be a determining factor in preservice STM teachers’ computer self-efficacy. Most of the participants in the study were fortunate to have been born in this era of rapid advancement in ICT and so they could be regarded as digital natives. Though in contrast with the present study finding, Charness, Schumann and Boritz (1992) found that there was a significant negative relationship between age and computer self-efficacy of adults which implied that the older the adult, the less his/her self-efficacy in the use of computer. Buttressing this result, Hakverdi, Gücüm, and Korkmaz (2007) found that preservice science teachers’ computer self-efficacy was negatively correlated with age, grade level, educational use of computers, level of computer use, and personal computer use. At the subscale level, age had no statistically significant correlations with the beginning skills, advanced skills, and file and software skills. The finding that each of discipline of study and age has no significant effect on and correlation with preservice teachers’ computer self-efficacy suggests that these demographic variables may not be determining factors in preservice teachers’ computer self-efficacy at least with respect to the sample considered in this study. Gender may still be considered as a determining factor in preservice science, technology and mathematics teachers’ computer self-efficacy and intervention strategies should be sought to create an aura of gender equity in technology (computer) self-efficacy by making women to engage in frequent use of computer technology.
Conclusion
even as indicated in their rankings by the ITU ICTs development index. A developing country like Nigeria needs to replicate these characteristics in her citizens if she is to compete favourable with the developed countries in this era of computers, information and communication technologies. Without these virtues, the digital divide sweeping across developing nations will mar the Nigeria vision of becoming one of the 20 largest economies in the world by the year 2020. It is expected that achieving Vision 20: 2020 unfolded in 2009 by the democratic government will help Nigeria to consolidate her leadership role in Africa and establish herself as a significant player in the global economic and political arena.
Recommendations
The present study has several limitations that suggest further possibilities for empirical studies. For this study, one major limitation relates to the sample. Data were collected from 480 preservice science, technology, and mathematics teachers from two universities in Nigeria and using preservice teachers may not accurately mirror the experiences of the practicing (inservice) teachers, thereby limiting the ability to generalise the results of this study to all educational users and samples not considered. Future studies should attempt to increase the sample size by sampling other universities and incorporate more preservice teachers with diverse disciplines of study that may include Arts and Social Sciences Education and Language Education cohorts. The present study used intact groups without any attempt to randomize the participants. Future studies may consider using randomised subject. More so, the effects of expanded demographic variables on the individual subscale scores of computer self-efficacy of Nigerian preservice (inservice) teachers may be worthwhile examining.
References
Adebowale, O. F., Adediwura, A. A., & Bada, T. A. (2009) Correlates of computer attitude among secondary school students in Lagos State, Nigeria. International Journal of Computing and ICT Research, 3, 20-30.
Akinsola, M. K. & Awofala, A. O. A. (2009). Effect of personalization of instruction on students’ achievement and self-efficacy in mathematics word problems. International Journal of Mathematical Education in Science and Technology, 40(3), 389-404.
Aremu, A. & Fasan, O. (2011) Teacher training implications of gender and computer self efficacy for technology integration in Nigeria schools. The African Symposium: An Online Journal of the African Educational Network, 11, 178-185.
Awoleye, M. O. & Siyanbola, O. W. (2005) Examining the level of penetrating and impact of internet usage amongst undergraduates in Nigerian Universities a case study approach. Non Periodic Internet Article. Retrieved January 22, 2009, from http://www.formatex.org/micte2006/pdf/1708-1713.pdf.
Bandura, A. (1986) Social Foundations of Thought and Action. NJ: Prentice Hall.
Bandura, A. (1993) Perceived self-efficacy in cognitive development and functioning. Educational Psychologist, 28, 117-148.
Barbeite, F. G. & Weiss, E. M. (2004) Computer self-efficacy and anxiety scales for an internet sample: testing measurement equivalence of existing measures and development of new scales. Computers in Human Behavior, 20, 1-15.
Bimer, B. (2000) Measuring the gender gap on internet. Social Science Quarterly, 81. Retrieved June 24 2008 from https://clearspace.democracylab.org/servlet/JiveServlet/previewBody/1107-102-1- 1175/Bimber_on_DigiDivide.pdf;jsessionid=7AC50CD6011E508D2542E8FE54E46D70.810.
Brosnan, M. (1998) Technophobia: The psychological impact of informational technology. London: Routledge. Burkhardt, M.E. & Brass, D.J. (1990). Changing patterns or patterns of change: The effects of a change in
technology on social network structure and power. Administrative Science Quarterly, 35(1), 104-127. Busch, T. (1995) Gender difference in self-efficacy and attitudes toward computes. Journal of Educational
Computing Research, 12(2), 147-158.
Büyüköztürk,Ş. (2002). Sosyal Bilimler İçin Veri Analizi El Kitabi: İstatistik, Araştirma Deseni, SPSS Uygulamalari ve Yorum. Ankara: PegemA Yayincilik. [In Turkish].
Cassidy, S. & Eachus, P. (2002). Developing the computer user self-efficacy (cuse) scale: ınvestigating the relationship between computer self-efficacy, gender and experience with computers. Journal of Educational Computing Research, 26(2), 133-153.
Chen, K. T-C. (2012) Elementary EFL teachers’ computerphobia and computer self efficacy in Taiwan. TOJET: The Turkish Online Journal of Educational Technology, 11, 100-107.
Cheong, Y. F., Pajares, F., & Oberman, P. S. (2004) Motivation and academic help-seeking in high school computer science, Computer Science Education, 14(1), 3-19.
Cohen, J. (1988). Statistical power analysis for the behavioral sciences (2nd ed.). Hillsdale, NJ: Erlbaum. Compeau, D. R. & Higgins, C. A. (1995) Computer self-efficacy: Development of a measure and initial test. MIS
Quarterly, 19, 189-211.
Compeau, D., Higgins, C. A., & Huff, S. (1999) Social cognitive theory and individual reactions to computing technology: A longitudinal study. MIS Quarterly, 23, 145–158.
Delcourt, M. A. B. & Kinzie, M. B. (1993) Computer technologies in teacher education: The measurement of attitudes and self-efficacy. Journal of Research and Development in Education, 27, 35-41.
Doyle E., Stamouli, I., & Huggard, M. (2005) Computer anxiety, self-efficacy, computer experience: An investigation throughout a computer science degree. 35th ASEE/IEEE Frontiers in Education Conference, October 19 – 22, 2005, Indianapolis, IN.
Durndell A., Haag Z., & Laithwaite, H. (2000). Computer self efficacy and gender: a cross cultural study of Scotland and Romania, Personality and Individual Differences, 28, 1037-1044.
Durndell, A. & Haag, Z. (2002) Computer self-efficacy, computer anxiety, attitudes towards the internet and reported experience with the internet, by gender, in an east European sample. Computers in Human Behavior, 18, 521-535.
Ertmer, P. A., Addison, P., Lane, M., Ross, E., & Woods, D. (1999) Examining teachers' beliefs about the role of technology in the elementary classroom. Journal of Research on Computing in Education, 32, 54-72. Ertmer, P. A., Evenbeck, E., Cennamo, K. S., & Lehman, J. D. (1994) Enhancing self-efficacy for computer
technologies through the use of positive classroom experiences. Educational Technology Research and Development, 42, 45-62.
Field, A. (2005). Discovering statistics: Using SPSS for Windows. London: SAGE Publications.
Gist, M.E., Schwoerer, C., & Rosen, B. (1989). Effects of alternative training methods on self-efficacy and performance in computer software training. Journal of Applied Psychology, 74 (6), 884-891.
Global Information Technology Report (2004). The networked readiness index rankings 2005. Retrieved 22/04/2006
http://www.weforum.org/pdf/Global_Competitiveness_Reports/Reports/gitr_2006/rankings.pdf
Global Information Technology Report (2005). The networked readiness index rankings 2005. Retrieved
22/04/2006 from
http://www.weforum.org/pdf/Global_Competitiveness_Reports/Reports/gitr_2006/rankings pdf
Griffin, J. (1998) CAL innovation as viewed by purchasers of computer software in secondary schools. Journal of Computer Assisted Learning, 4, 34 – 43.
Halder, S. & Chaudhuri, S. (2010) Computer self efficacy and computer anxiety of trainee teachers: Issue of concern. Proceedings of episteme 4, India, 1-7.
Hakverdi, M., Gücüm, B., & Korkmaz, H. (2007) Factors influencing pre-service science teachers’ perception of computer self-efficacy. Asia –Pacific forum on Science Learning and Teaching, 8, Article 13, 1-14 Harris, C. M. (2002) Is multimedia-based instruction Hawthorne revisited? Is difference the difference?
Education, 122, 839– 843.
Harrison, A. W. & Rainer, R. K. (1992) An examination of the factor structures and concurrent validates for the computer attitude scale, the computer anxiety rating scale, and the computer self-efficacy scale.
Educational and Psychological Measurement, 52, 735-744.
Hasan, B. (2003) The influence of specific computer experiences on computer self-efficacy beliefs. Computers in Human Behavior, 19, 443–450.
Hasan, B. (2007) Examining the Effects of Computer Self-Efficacy and System Complexity on Technology Acceptance,Information Resources Management Journal,20(3),76-88.
Hill, T., Smith, N. D., & Mann, M. F. (1987) Role of efficacy experiences in predicting the decision to use advanced technologies: The case of computers. Journal of Applied Psychology, 72, 307-313.
Hsiao, H-C., Tu, Y-L. & Chung, H-N. (2012) Perceived social supports, computer self-efficacy, and computer use among high school students, TOJET: The Turkish Online Journal of Educational Technology,
11(2), 167-177
Işiksal, M. & Aşkar, P. (2003) Mathematics and computer self-efficacy scales for primary school students.
Hacettepe University Journal of Education, 25, 109-118.
Kalayci, Ş. (2005). Faktör Analizi.,Ş. Kalayci (Ed). SPSS Uygulamali Çok Değişkenli İstatistik Teknikleri.
Ankara: Asil Yayin Dağitim. [In Turkish].
Kinzie, M. B., Delcourt, M. A. B., & Powers, S. M. (1994) Computer technologies: Attitudes and self-efficacy across undergraduate disciplines. Research in Higher Education, 35, 745-768.