AUSTRALIAN JOURNAL OF BASIC AND
APPLIED SCIENCES
ISSN:1991-8178 EISSN: 2309-8414 Journal home page: www.ajbasweb.com
Open Access Journal
Published BY AENSI Publication
© 2016 AENSI Publisher All rights reserved
This work is licensed under the Creative Commons Attribution International License (CC BY). http://creativecommons.org/licenses/by/4.0/
To Cite This Article: Shanmugam Muni Rathnam and Thirumala Ramashri., An Efficient Volcano Hotspots Detection Technique by Using ANFIS Classifier and Modified Region Growing Algorithm. Aust. J. Basic & Appl. Sci., 10(10): 192-201, 2016
An Efficient Volcano Hotspots Detection Technique by Using ANFIS
Classifier and Modified Region Growing Algorithm
1Shanmugam Muni Rathnam and 2Thirumala Ramashri
1Research Scholar, Department of ECE, Sri Venkateswara University College (SVU) of Engineering, Tirupati, Andhra Pradesh, India 2Professor, Department of ECE, Sri Venkateswara University College (SVU) of Engineering, Tirupati, Andhra Pradesh, India.
Address For Correspondence:
Shanmugam Muni Rathnam, Research Scholar, Department of ECE, Sri Venkateswara University College (SVU) of Engineering, Tirupati, Andhra Pradesh, India
E-mail: [email protected]
A R T I C L E I N F O A B S T R A C T Article history:
Received 13 April 2016 Accepted 21 June 2016 Published 28 June 2016
Keywords:
Resilient Back Propagation (RBP) Optic Modified Back Propagation (OMBP), Modified region growing algorithm (MRG), Precision, Recall, F-Measure, ANFIS, Local Tetra Patterns (LTRP), Orthogonal wavelet
Background: In the previous work, Volcano Hotspots were identified using Two Stage Neural Network with Resilient Back Propagation (RBP) and Optic Modified Back Propagation (OMBP) algorithms. But precision and recall value are low. Objectives: In order to improve the precision and recall value even more higher. An efficient ANFIS classifier is used in this paper. Our proposed Volcano Hotspots detection technique comprised of four stages namely pre-processing, segmentation, feature extraction and classification. Initially the satellite images fetched from the database is subjected to pre-processing in order to remove the noise. Then the pre-processed image is segmented using modified region growing algorithm. From the segmented image features such texture feature, color feature, wavelet feature and shape features were extracted. Then these extracted features were given as the input to the ANFIS. The ANFIS classifier classifies the images and identifies the volcano hotspots efficiently. The proposed volcano hot spot detection based on modified region growing and ANFIS classifier will be implemented in working platform of MATLAB and it will be assessed by utilizing an assortment of satellite images taken from the database. Results: The performance will be analyzed by comparing the proposed modified region growing and ANFIS classifier technique with the previous neural network technique in terms of performance evaluation metrics such as precision, recall and F-Measure rate. Conclusion: At the end of the process significant results were obtained in case of proposed modified region growing and ANFIS classifier when the performance measures were compared with existing work.
INTRODUCTION
The types of the Satellite images includes: Visible Image, Infra-red Image, Water vapor Image(Jay Narayan Thakre and Divakar Singh, 2013). Generally, the two qualities which facilitate to direct the choice of satellite data are spatial resolution and spectral resolution. The size of area on the ground which is recapitulated by one data value in the imagery is termed as spatial resolution. This resolution is the Instantaneous Field of View (IFOV) depicted previously. The satellite sensor which perceives the number and width of the spectral bands is termed as spectral resolution. The main resources of images are the remote sensing images which are obtained from the satellites (Jesús M, Almendros-Jiménez, Luis Domene and José A. Piedra-Fernández, 2013).
The main image processing functions which are offered in studying the images are Preprocessing, Image Enhancement, Image Transformation, Image Classification and Analysis (Mahmud S, Alkoffash, Mohammed J, Bawaneh, Hasan Muaidi and Shihadeh Alqrainy, 2014). The Satellite image classification includes the interpretation of remote sensing images, spatial data mining, examining several vegetation types like agriculture and foresters etc, scrutinizing urban and to find out several uses of land in an area (Sunitha Abburu and Suresh Babu Golla, 2015). The two main types of Image Classification are 1) Supervised Classification (Kanika, Anil kumar and Rhythm Gupta,2013) and 2) Unsupervised Classification [16]. In the Supervised Classification, training data is chosen from known identities and it is related to the classes. Based on the training data the approach classifies the image to the classes. The Unsupervised Classification includes the segmentation of images into classes on the basis of normal groupings and the data present in the image (Chandrakala and Amsaven, 2013). The most valuable type of classification is the supervised classification as when compared with the unsupervised classification. In the supervised classification there is an availability of more number of classical classification algorithms and several classifying approaches (Minu Nair and Bindhu, 2016). The approaches employed in remote sensing assists the experts to elucidate the data gathered and classification approaches(Moisés Espínola, José A, Piedra-Fernández, Rosa Ayala, Luis Iribarne and James Z. Wang, 2015).
The main benefit of satellite technology is the data obtained which has a large extent as when related with the conventional techniques. For a specified location, the satellite data yields an excellent coverage of scene as when related with the aerial data. In addition, the exploit of wireless technology and video surveillance require equipment’s to be set up in a preferred region; consequently it might be cost prohibitive and moreover it is disturbed by several natural occurring disasters. This kind of trouble is absent in the satellite data. Therefore, the satellite images are the trendiest and it is chosen as the best for obtaining data and to observe the natural disaster (Vaibhavi P Desai and Hetal Vala, 2014), earthquake and volcano eruption (Senthilnath, S.N. Omkar, V. Mani, and P.G. Diwakar, 2013)(Ravi B, Mehta and Richard Sonaliya, 2014).
The rest of the paper is organized as follows. Section 2 provides various researches conducted in relation to our proposed work. Section 3 explains about the design strategy and the proposed method. Section 4 shows the result and discussion of our proposed method and finally section 5 concludes our proposed method.
Muni Rathnam S et al. (2016) have indentified the volcanoes with accuracy up to 0.97 by using two stage neural network in which Resilient and Optic modified back propagation were used and statistical parameters such as mean, mean square, variance, correlation, energy, contrast, homogeneity etc., are extracted from an image and used as features.
Related Researches: A Review:
Claudia et al. (2014) have proposed a methodology for identifying useful urban features for transportation planning, particularly with respect to areas with higher concentrations of trip generators that were identified from satellite images, using object-based classification techniques. The proposed methodology for classifying images minimizes costs and prioritizes field activities related to research on trip generators, as well as origin/destination studies. The methodology was used in the city of Joao Pessoa, Paraíba State, Brazil with satisfactory and promising results.
Tochon et al. (2015)have proposed a method for hyper spectral image segmentation, based on the binary partition tree (BPT) algorithm. Various super pixel generation methods including watershed transformation and mean shift clustering are applied to decrease spatial dimensionality and provide an initial segmentation map. Principal component analysis was performed to reduce the spectral dimensionality and different combinations of principal components were compared. A non-parametric region model based on histograms, combined with the diffusion distance to merge regions, is used to build the BPT. The proposed method correctly segmented up to 68% of the tree crowns and produced reasonable patterns of the segmented landscapes.
Alvaro Linares-Rodriguez et al. (2013) have presented an optimized artificial neural network ensemble model was built to estimate daily global solar radiation over large areas. The model uses clear-sky estimates and satellite images as input variables. A genetic algorithm was used to optimize selection of model inputs. The model yields reliable results even on cloudy days, improving on current models based on satellite imagery.
identify different types of impact craters based on the 2-D and 3-D characteristics of the crater bottoms as well as topographic transects across the craters. The proposed approach was tested on multiple data sets that were acquired by the Change satellites and provides a very high level of accuracy in both the detection and identification phases.
Vahid Sadeghi et al. (2013) have proposed an automated Relative Radiometric Normalization (RRN) method to adjust a non-linear model based on an Artificial Neural Network (ANN) and unchanged pixels. The proposed method includes the following stages: (1) automatic detection of unchanged pixels based on a new idea that uses CVA (Change Vector Analysis) method, PCA (Principal Component Analysis) transformation and K-means clustering technique, (2) evaluation of different architectures of perceptron neural networks to find the best architecture for this specific task and (3) use of the aforementioned network for normalizing the subject image. The method has been implemented on two images taken by the TM sensor.
ANFIS Based Volcano Hotspot Detection:
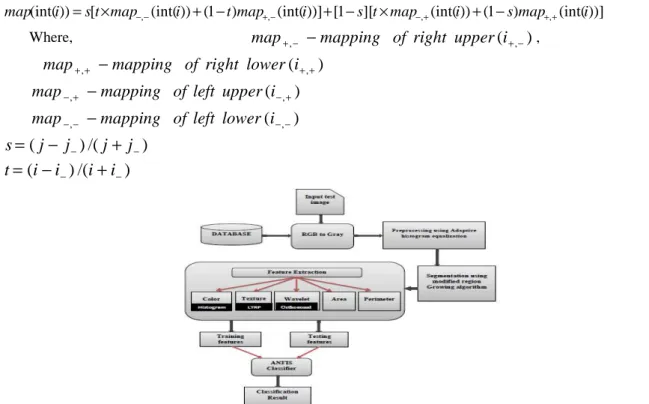
Initially the satellite images fetched from the database is subjected to pre-processing in order to remove the noise. Then the pre-processed image is segmented using modified region growing algorithm. From the segmented image features such texture feature, color feature, wavelet feature and shape features were extracted. In feature extraction stage color feature was extracted using histogram, texture feature using LTRP, wavelet feature using orthogonal wavelet and shape feature using Area and perimeter. Then these extracted features were given as the input to the ANFIS. The ANFIS classifier classifies the images and identifies the volcano hotspots efficiently. The block diagram of our proposed technique is shown in fig.1.
}
,
,
,
{
x1 i2 x3 xni
st
st
st
st
Db
=
L
(1)Let
Db
i:i
=
1
,
2
,
L
n
be a database images.Where
st
x1 be the number of images from the database.)
(
q
xst
be a query image from the database.Preprocessing by utilizing Adaptive Histogram Equalization (AHE):
Initially Pre-processing was done in the satellite image
st
x1 by means of Adaptive Histogram Equalization.AHE is used to enhance the contrast of the imagest
x1by modifying the pixel based on its surrounding pixels. AHE is routine, locally adaptive and habitually produces superior images. Let us consider a moving windoww
(
w
=
m
×
n
)
andint(i
)
is the intensity of pixel( j
i
,
)
. Then the modification of pixel)
,
( j
i
is given as below:))] (int( )
1 ( )) (int( ][
1 [ ))] (int( )
1 ( )) (int( [
))
(int(i st map, i t map, i s t map, i smap, i
map = × −− + − +− + − × −+ + − ++ (2)
Where,
map
+,−−
mapping
of
right
upper
(
i
+,−)
,
map
+,+−
mapping
of
right
lower
(
i
+,+)
)
(
,,+ −+
−
−
mapping
of
left
upper
i
map
)
(
,,− −−
−
−
mapping
of
left
lower
i
map
)
/(
)
(
−
−+
−=
j
j
j
j
s
(3))
/(
)
(
−
−+
−=
i
i
i
i
t
(4)This modification is done for all the pixels in the entire image and finally the enhanced image
e
(
st
x1)
is attained. After that obtained preprocessed satellite imagee
(
st
x1)
undergo segmentation process.Obtain from the adaptive histogram equalization is segmented by using modified region growing algorithm.
Segmentation:
Segmentation using modified region growing algorithm:
The preprocessed satellite image
e
(
st
x1)
Obtain from the adaptive histogram equalization is segmented by using modified region growing algorithm. Where the segmentation is done based on seed point selection using intensity threshold and orientation threshold. Initially, in order to check whether the neighboring pixels in the image can be included with the region or not, the neighboring pixels are compared with the initial seed points. The step by step procedure of MRG technique is illustrated below:Step 1: Calculate the gradient of the image
e
(
st
x1)
forx
axis andy
axis, let it be(
g
ˆ
rd
(
x
))
and(
g
ˆ
rd
(
y
))
. Using these gradient values find the gradient vectorGrd
Vect
(
2 2)
)
(
ˆ
)
(
ˆ
1
1
y
rd
g
x
rd
g
Vect
Grd
+
+
=
(5)Step 2: Attain the values of orientation by modifying the gradient vector values from radians to degrees.
Segment the image into grids
grid
i.Step 3: Obtain the intensity threshold as
(
In
(thld))
and orientation threshold as(
Or
(thld))
.Step 4: Continue the subsequent procedures in step 5 regarding each grid
grid
i, until the number of grids reach the total number of grids for an image.Step 5(a): Find out the histogram
(histgm
)
of each pixel ingrid
i. And Choose the most frequenthistogram of the
grid
ith grid and it denoted asFreq
(hsgm).Step 5(b): Select any pixel, as per
Freq
(hsgm)and assign that pixel as the seed point which has theintensity
( )
In
p and Orientation( )
Or
p .Step 5(c): The intensity and orientation of the neighboring pixel is considered as
( )
In
n and( )
Or
n . Step 5(d): Determine the intensity and orientation difference of the pixelsp
andn
by using the equations given below.n
p
In
In
dif
int=
−
(6)n p
orient
Or
Or
dif
=
−
(7)Step 5(e): If
dif
int≤
I
(thld)&&dif
orient≤
O
thld, then make the region to grow by adding the related pixelto the region or else, go to step 5(g).
Step 5(f): Scrutinize whether all the pixels are added to the region. If yes, go to step 4, or else go to step 5(g).
Step 5(g): Re-examine the region and locate the new seed points and perform the procedure from step 5(a). Finally terminate the entire procedure. Thus the image is segmented by means of modified region growing algorithm. Then from the segmented images features were extracted.
Feature Extraction: Color histogram:
Color histogram is nothing but a K-dimensional vector. Each component
ch
kin this vector signifies therelative number of pixels of color
C
kin the image, which means the fraction of the pixels are nearly alike withthe equivalent color. In order to construct the color histogram, transformation and quantization should be done. In the former, the image colors are transformed to the suitable color space and in the latter, quantization should be done based on a specific codebook of size K.
,
N
n
Ih
f ocrWhere,
gl
denotes the total number of gray levels in the image,n
ocr denotes the number of occurrencesof gray level
i
.N
denotes the total number of pixels in the image, andIh
if denotes the image histogram forpixel value
i
.Local Tetra patterns (LTrP):
In local tetra patterns (LTrP) there are two patterns like tetra and magnitude patterns are computed by the
center pixel and its neighbourhood’s pixel values. The center pixel value is denoted as
C
P, and the horizontaland vertical neighborhoods of
C
Pis represented asC
h andC
v respectively. The first order derivatives at thecenter pixel
C
Pand the direction can be computed as)
(
)
(
)
(
0
C
pI
C
hI
C
PI
o=
−
(9))
(
)
(
)
(
90
C
pI
C
vI
C
pI
o=
−
(10)
<
≥
<
<
≥
<
≥
≥
=
0
)
(
0
)
(
,
4
0
)
(
0
)
(
,
3
0
)
(
0
)
(
,
2
0
)
(
0
)
(
,
1
)
(
90 0 90 0 90 0 90 0 p p p p p p p p p dirC
I
and
C
I
C
I
and
C
I
C
I
and
C
I
C
I
and
C
I
C
L
o o o o o o o o (11)Then we apply first-order derivative in horizontal and vertical directions to the neighbourhood
pixel(Subramanian Murala, Maheshwari and Balasubramanian,2012). We obtain the direction and magnitude of the neighbourhood pixel.
8 2
1
),
(
(
),
(
),
(
(
),
(
))}
|
(
),
(
(
{
)
(
C
p=
f
L
dirC
pL
dirC
f
L
dirC
pL
dirC
f
L
dirC
pL
dirC
d d=R
L
(12)
=
=
.
),
(
)
(
)
(
,
0
)
(
),
(
(
else
C
L
C
L
C
L
C
L
C
L
f
d dir d dir P dir d dir Pdir (13)
From (12) and (13), we get 8-bit tetra pattern for each center pixel. Then, we separate all patterns into three parts based on the direction of center pixel. Finally, the tetra patterns for each part (direction) are converted to three binary patterns. These three binary patterns are obtained as follows,
4 , 3 , 2 1 ) 1 ( 4 , 3 ,
2
2
*
(
(
))
|
)
(
= = − ==
∑
dir P D d d dirP
f
R
C
C
R
(14)
=
=
=else
p
s
if
C
R
f
c dir p,
0
)
(
,
1
))
(
(
θ
θ (15)
In Equ. (15),
θ
=
2
,
3
,
4
, after the computation of center pixel direction by Equ. (12), three binary patterns are computed by Equ. (15) and (16). In the same way, tetra pattern for center pixels having directions 2, 3 and 4 is computed. Thus, with four tetra pattern, 12 binary patterns are obtained from all directions (Subramanian Murala, Maheshwari and Balasubramanian,2012). Subsequently; the 13th binary pattern is computed by using the magnitudes of horizontal and vertical first-order derivatives. The magnitude pattern is computed as follows,2 90
2
0
(
))
(
(
))
(
))
(
(
L
C
dI
C
dI
C
dS
=
o+
o (16)Thus the obtained 13 binary patterns are utilized as the feature. Thus the texture features
tx
if obtained.Wavelet feature using orthogonal wavelet:
In a wavelet when the associated wavelet transform is orthogonal then it is said to be an orthogonal transform.
∑
∈−
=
z n ff
s
I
p
w
f
Where,
w
f denotes the wavelet function,s
f denotes the Scaling function,p
denotes the value of thepixel.
I
denotes the image. Thus by using the orthogonal wavelet, wavelet featurewv
if is obtained.Shape features: Area:
Shape features such as area and perimeter will be calculated from the segmented images. The area of a segmented image can be calculated using the equation given below,
)
(
)
(
)
(
,
w
img
h
img
f
A
Area
=
(18)
Where
img
(h
)
- Image height,img
(w
)
- Image widthPerimeter:
The perimeter of a segmented image can be calculated using the equation given below,
))
(
)
(
(
2
)
(
,
pr
f
img
h
img
w
perimeter
=
+
(19)
Classification Using ANFIS:
The features such color feature
Ih
if, texture featuretx
if, wavelet featurewv
if and shape feature)
(
),
(
f
pr
f
A
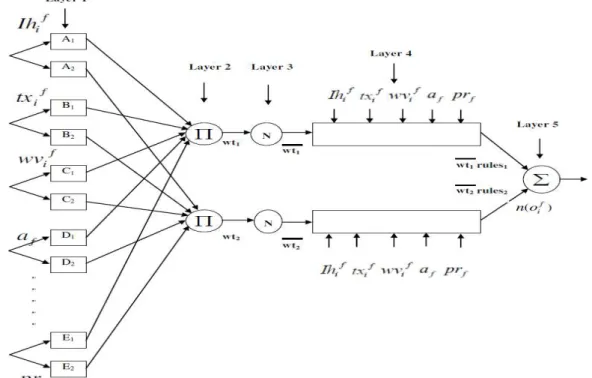
obtained from the feature extraction technique are classified using the well known classifier named ANFIS which comprises five layers of nodes. Out of five layers, the first and the fourth layers possess adaptive nodes whereas the second, third and fifth layers possess fixed nodes.In ANFIS the inputs are given to the input layer (as input membership function) and the output is obtained from the output layer (as output membership functions).The features are classified using the ANFIS. The Rule basis of the ANFIS is of the form:
i f
i f
i f
i i f
i i f
i i
i
A
Ih
B
tx
C
wv
D
A
E
P
f
Rules
=
(
)
+
(
)
+
(
)
+
(
)
+
(
)
+
(20)
Where,
(
Ih
if)
,(
tx
if)
,(
wv
if)
,(
A
f)
and(
p
f)
are the inputs,A
iB
iC
iD
i andE
iare the fuzzy sets,i
Rules
is the output within the fuzzy region specified by the fuzzy sets. The architecture of the ANFIS is givenin fig.2.
Layer 1:
Every node
i
in this layer is a square node with a node function.)
(
),
(
),
(
,
)
(
),
(
1, 1, 1, 1,,
1 i Di f i Ei f
f i Ci i f i Bi i f i Ai
i
Ih
O
tx
O
wv
O
A
O
P
O
=
µ
=
µ
=
µ
=
µ
=
µ
(21)Usually
µ
Ai(
Ih
if),
µ
Bi(
tx
if)
,
µ
Ci(
wv
if),
µ
Di(
A
f),
µ
Ei(
P
f)
are chosen to be bell-shaped with maximum equal to 1 and minimum equal to 0 and are defined asi q i i f Ei f Di f i Ci f i Bi f i Ai
p
o
x
P
A
wv
tx
Ih
−
+
=
=
=
=
=
21
1
)
(
)
(
)
(
)
(
)
(
µ
µ
µ
µ
µ
(22)
Where
o
i,
p
i,
q
iis the parameter set. These parameters in this layer are referred to as premise parameters.Layer-2:
Every node in this layer is a circle node labeled
Π
which multiplies the incoming signals and sends the product out. For instance,2
,
1
),
(
)
(
)
(
)
(
)
(
,2
=
wt
=
Ih
×
tx
×
wv
×
A
×
P
i
=
O
i iµ
Ai ifµ
Bi ifµ
Ci ifµ
Di fµ
Ei f (23)Each node output represents the firing strength of a rule.
Layer-3:
Every node in this layer is a circle node labeled
N
. Thei
thnode calculates the ratio of thei
thrules firing strength to the sum of all rule’s firing strengths:2
,
1
),
/(
1 2,
3
=
wt
=
wt
wt
+
wt
i
=
O
i i i (24)Layer-4:
Every node
i
in this layer is a square node with a node function2
,
1
.
,
4
=
wt
Rules
i
=
O
i i i (25)Where
wt
iis the output of layer 3.Layer-5:
The single node in this layer is a circle node labeled
Σ
that computes the overall output as the summation of all incoming signals:∑
∑
∑
=
=
i i
i i i
i i i i
wt
Rules
wt
Rules
wt
O
5, (26))
(
o
ifn
= 2 1 2 2 1 1wt
wt
Rules
wt
Rules
wt
+
+
(27) 2 1)
(
o
wt
Rules
wt
Rules
n
if=
+
(28)Thus the feature obtained is classified by ANFIS and the classified feature is denoted as
(
)
f i
O
n
RESULT AND DISCUSSION
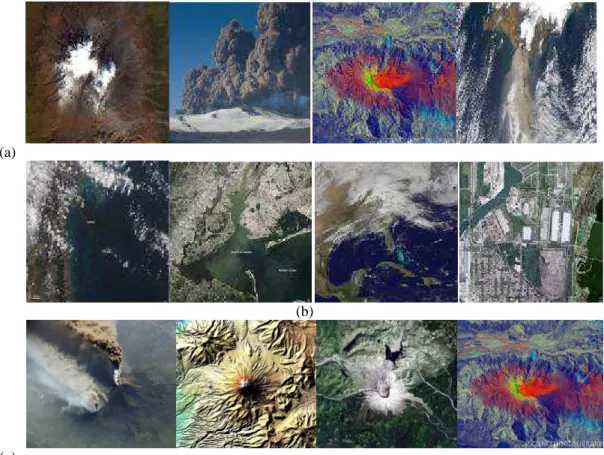
(a)
(b)
(c)
Fig. 3: a) Input Volcanic images, b) Input Non-volcanic images, c) hot spotted-volcanic images
Performance analysis:
The proposed technique is detail described in the previous Section and in this section the detail explanation on the implementation result and its performance is analyzed. By performing the statistical measures such as sensitivity, specificity and accuracy the performance of our proposed hotspot detection is examined. Error rate in terms of true and false positive and true and false negative as follows:
• (TP): the classification result is positive in the presence of the volcano hotspot.
• (TN): the classification result is negative in the absence of the volcano hotspot.
• (FP): the classification result is positive in the absence of the volcano hotspot.
• (FN): the classification result is negative in the presence of the volcano hotspot.
Table 1: Obtained values for our proposed evaluation metrics such as TP, TN, FP and FN
Evaluation Metrics Proposed System Existing System RBP Existing System OMBP
True Positive 47 45 48
False Positive 0 3 3
True Negative 50 47 47
False Negative 3 5 2
FP)
FN
TP
TP)/(TN
TN
(
Accuracy
=
+
+
+
+
FN)
TP/(TP
y
Sensitivit
=
+
Specificity
=
TN/(TN
+
FP)
Table 2: Comparison for the Performance Analysis
Measures Proposed System Existing System RBP Existing Method(OMBP)
Accuracy 0.97 0.92 0.95
Sensitivity 0.94 0.9 0.96
Specificity 1 0.94 0.94
Discussion:
(0.95). Correspondingly the specificity and sensitivity of the proposed method (1),(0.94) also gets increased as when compared to RBP of specificity (0.94) and sensitivity (0.9) and OMBP of specificity (0.94) and sensitivity (0.96). Likewise the performance gets improved in our proposed technique than the existing RBP and OMBP when compared to other terms such as Precision and Recall. This shows that our proposed technique detects the volcano hot spot more accurately than the existing technique because of its increased performance in accuracy, detection rate and specificity. The performance comparison of precision and Recall comparison is given in table.3
Table 3: Precision and Recall values for our proposed ANFIS and the Existing RBP, Existing OMBP. Comparative Analysis
Precision Recall
Proposed method Existing Method(RBP)
Existing Method(OMBP)
Proposed method Existing Method(RBP)
Existing Method(OMBP)
1 0.9375 0.9412 0.94 0.9 0.9592
Conclusion:
In this paper we have deliberated to propose an efficient MRG-ANFIS based remote sensing volcano hotspot detection system using MRG-ANFIS method. The proposed technique has higher precision rate and F-Measure than the other existing techniques. The comparison result shows that our proposed MRG-ANFIS technique detects the volcano hotspots more accurately than the existing methods. Hence, it is proved that our proposed techniques system using MRG-ANFIS technique more precisely and efficiently detect the volcano hotspots.
REFERENCES
Alvaro Linares-Rodriguez., José Antonio Ruiz-Arias., David Pozo-Vazquez and Joaquin Tovar-Pescador, 2013. An artificial neural network ensemble model for estimating global solar radiation from Meteosat satellite images. Elsevier journal, 61: 636-645.
Chandrakala and Amsaven., 2013. Classification of Remote Sensing Image Areas Using Surf Features and Latent Dirichlet allocation. International Journal of Advanced Research in Computer Science and Software Engineering, 3(9): 178-182.
Claudia, A., Soares Machado, M. Alessandra, Knopik Beltrame, J. Eduardo, Shinohara, A. Mariana, Giannotti, Laurent Durieux dTania and A. Jose, 2014. Identifying concentrated areas of trip generators from high spatial resolution satellite images using object-based classification techniques, 53: 271-283.
Ghayda and Ekhlas., 2013. A Survey Of Satellite ImageryClassification With DifferentApproaches. International Journal of Computer Science and Information Security, 11(6): 104-108.
Jay Narayan Thakre and Divakar Singh., 2013. A Survey on Knowledge Discovery from the Satellite Image Using Association Rule Mining. International Journal of Advanced Research in Computer Science and Software Engineering, 2(8): 881-886.
Jesús, M., Almendros-Jiménez., Luis Domene and José A. Piedra-Fernández, 2013. A Framework for Ocean Satellite Image Classification Based on Ontologies. IEEE Journal Of Selected Topics In Applied Earth Observations And Remote Sensing, 6(2): 1048-1063.
Kang., Z., Z. Luo, T. Hu and P. Gamba, 2015. Automatic Extraction and Identification of Lunar Impact Craters Based on Optical Data and DEMs Acquired by the Change Satellites. Journal of Selected Topics in Applied Earth Observations and Remote Sensing, 8(10): 4751-4761.
Kanika., Anil kumar and Rhythm Gupta, 2013. A Comparative Study of Supervised Image Classification Algorithms for Satellite Images. International Journal of Electrical, Electronics and Data Communication, 1(10): 10-16.
Mahmud, S., Alkoffash, Mohammed J. Bawaneh, Hasan Muaidi and Shihadeh Alqrainy, 2014. Software and Muath alzghool. International Journal of Computer Science and Network Security, 14(3): 65-71.
Mercy, W. Mwaniki., Moeller S. Matthias and Gerhard Schellmann, 2015. Application of Remote Sensing Technologies to Map the Structural Geology of Central Region of Kenya. IEEE Journal of Selected topics in Applied Earth observation and Remote Sensing, 8: 4.
Minu Nair and Bindhu., 2016. Supervised Techniques and Approaches for Satellite Image Classification. International Journal of Computer Applications, 134(16): 1-5.
Moisés Espínola., José A., Piedra-Fernández, Rosa Ayala, Luis Iribarne and James Z. Wang, 2015. “Contextual and Hierarchical Classification of Satellite Images Based on Cellular Automata. IEEE Transactions on Geoscience And Remote Sensing, 53(2): 795-809.
Muni Rathnam S and Dr.T. Ramashri., 2016. A Cascade stage of artificial neural network for Identifying Volcano Hotspots using Satellite Images. International Journal of Applied Research. ISSN 0973-4562, 11(7): 5067-5071.
Ravi, B., Mehta and Richard Sonaliya., 2014. Survey on Satellite Image Enhancement Techniques. International Journal of Computer Science and Information Technologies, 5(6): 7411-7414.
Saudagar Arshed Salim and Vinod Shinde., 2015. Survey Paper of Discrete Wavelet Transform-Based Satellite Image Resolution Enhancementmethod, International Journal & Magazine of Engineering, Technology, Management and Research, 2(5): 326-331.
Senthilnath., S.N. Omkar., V. Mani and P.G. Diwakar, 2013. Multi-Temporal Satellite Imagery for Flood DamageAssessment. Journal of the Indian Institute of Science, 93(1): 105-116.
Subramanian Murala., Maheshwari and Balasubramanian, 2012. Local Tetra Patterns: A New Feature Descriptor for Content-Based Image Retrieval. IEEE Transactions on Image Processing, 21: 5.
Suma Chappidi and Sandeep Kumar Mekapothula, 2014. A Novel Method for Enhancing Satellite & Land Survey Images Using Color Filter Array Interpolation Technique (CFA). International Journal of Emerging Trends & Technology in Computer Science, 3(5): 217-221.
Sunitha Abburu and Suresh Babu Golla., 2015. Satellite Image Classification Methods and Techniques: A Review. International Journal of Computer Applications, 119(8): 20-25.
Tochon., G., J.B. Ferret, S. Valero, R.E. Martin, D.E. Knapp, P. Salembier, J. Chanussot and G.P. Asner, 2015. On the use of binary partition trees for the tree crown segmentation of tropical rainforest hyper spectral images. Remote sensing and environment, 159: 318-331.
Vahid Sadeghi., Hamid Ebadi and Farshid Farnood Ahmadi, 2013. A new model for automatic normalization of multitemporal satellite images using Artificial Neural Network and mathematical methods. Applied Mathematical Modelling, 37(9): 6437-6445.
Vaibhavi, P Desai and Hetal Vala., 2014. Survey on Methods of Road Extraction using Satellite Image. International Journal of Engineering Research & Technology, 3(11): 1-3.