Effect of Driver Dynamic Visual Field on Safety Driving
Dianye Zhang1, Jian Jin2, Lili Luo, Jianli Zuo, Gang Chen and Min Mao3 School of Transportation Eng., Southwest Jiaotong University, Chengdu, 610031,ChinaTEL:(0086)-0287600824
E-mail:[email protected]
Abstract
The dynamic visual field (DVF) of two groups of about 220 accident and non-accident drivers (aged 20-30,30-40,40-50,and 50-60years) were measured. Results showed that (1) the DVF differed significantly between two groups whereas the static one is similar, (2) Real visual field can hardly be described only by the static one,(3) there were high correlations between the DVF and the maximum safety driving speed.
Keywords
dynamic visual field(DVF), static visual field(SVF), accident group driver,non-accident group, driver.
Summary
Despite the obvious relationship between the good visual field and the ability to drive safely, it is not clear how variations in the quality of visual field are related to change the probability of being involved motor vehicle accidents. Such a relationship is difficult to establish because there is little or no consensus on how to judge the level of an individual driver’s visual field. Fortunately, there is a growing interest in traffic department for the development of DVF that represent the range of objects, by presenting the two eyes’ views with sight which produce an enhanced perception of relative range among objects that can improve the perceptual discrimination of figure from ground (Yeh and Silverstein, 1990). As one example, McKenna, F.P has developed a system in which DVF measurement were carried(1982). Other applications of ones, such as selecting automobile drivers, train drivers and pilots, are discussed in an excellent review by Thomas A. Ranney (1990)
Method
The model of driver’s DVF
Drivers continuous to apperceive and judge moving and static objects outside automobile while driving, and the visual field scope is especially important for safety driving.
1
Prof.,Director,College of Transportation, Southwest Jiaotong Univ.,Chengdu,China,Pc:610031 2
College of Transportation, Southwest Jiaotong Univ.,Chengdu,China,Pc:610031 3
College of Transportation, Southwest Jiaotong Univ.,Chengdu,China,Pc:610031
The relationship between the DVF and driving speed attracts the attentions of scholars all over the world. Even though the driver visual field unchange in static station, the visual field’s the depth, width and the information are varying continuously in the course of driving. All these variations help drivers with operating their devices. But with the driving speed raising, the point of view gets nearer, the visual field scope becomes smaller, the info around gains less. (Fig.1) These are all disbenefit for the safety driving. Usually, the action of DVF is divided into three periods:(Fig.2): perceiving, judging and operating phase. Except the transportation background, many factors affect the perceiving phase, such as visual field impairment, the visual acuity and the visual field scope. The judging phase is directly influenced by the knowledge collected in the perceiving phase, as well as the driving speed, and the complexity of transportation. The operating phase is the stage to act quickly, coordinately and accurately with reference to the perceiving and judging phase.
37 29 20 13 9 150km/h 9 125km/h 13 97km/h 20 81km/h 29 64km/h 37
Fig. 1 the variation of visual field with the driving speed
Fig. 2 the model of driver’s DVF
The mechanism and test method of visual field
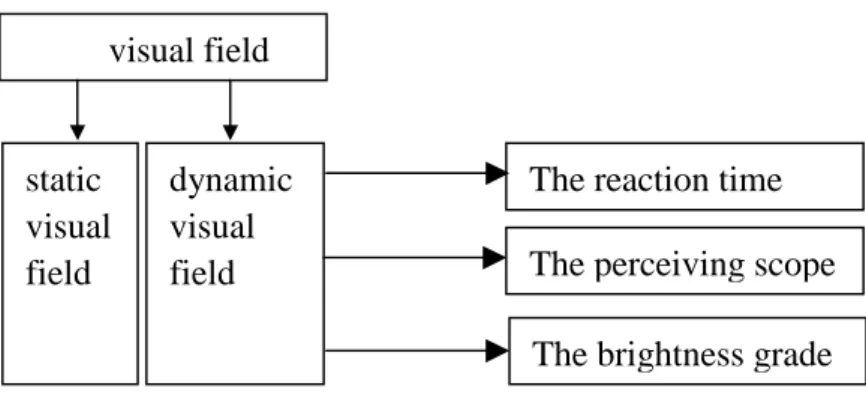
As a paticular form of the visual acuity, the visual field is the one in the visual area on the retina. Moreover, the DVF forms when time and brightness’ variation (e.g. the informing time, scope and the brightness grade ) appears .(Figure 3).
eye Operating system Judging system Perceiving system Perceiving phase- Judgement phase Operating accuracy Operating coordination Operating celerity information sensitivity impairment Speed info Option
Fig.4 the variation of the dynamic visual field with the brightness grade 0 0.5 1 1.5 2 2.5 3 3.5 4 4.5 100 200 300 400 500 600 cd/m2 decline brightness 20- 30- 40-
Fig. 3 the classification of visual field
We have researched a special instrument to test individual’s DVF, which is a display board. The device is about a square meter, with a red light tube lying in the center, and green light tubes distributing around. The brightness of the light is set into six grade:100cd/m2, 200cd/m2, 300cd/m2, 400cd/m2, 500cd/m2 and 600cd/m2; green light’s glimmering time is designed at six kinds•50ms, 100ms, 150ms, 200ms, 250ms and 300ms, with 1s breaking time. The visual field board is disparted into nine circular fields. In this aspect, the DVF level can be evaluated effortless with respect to the visual field fault point, the declining district of visual acuity and the bluntness district of response.
Table 1 indicates the quantity of the visual field impairment among the different age group. The result shows that (1)the quantity is significantly related to the driver’s age, (2)Especially, the quantity in 40- and 50- age groups is much greater than the one in other groups,(3) the quantity of the visual field fault point highly differs from different glimmering time. Glimmering time •ms• Group 50 100 150 200 250 300 20- 3±0.7 2±0.4 2±0.3 1±0.4 0±0.2 0±0.2 30- 3±1.0 2±0.6 2±0.4 1±0.6 1±0.3 0±0.2 40- 5±1.2 4±0.7 2±0.5 2±0.7 2±0.5 1±0.4 50- 6±1.1 4±1.1 3±0.4 3±0.8 2±1.0 1±0.6
Tab.1 the glimmering time and fault point of dynamic visual field
A further analysis represents that (1)the brightness grade has little effect on the dynamic visual field in 1~5 visual field districts, (2)in 6~9 visual field districts, however, the brightness grade produce notable influence on the DVF(Fig. 4). Based upon such conclusions, it is reasonable to separate the driver DVF reliability into 5 grades under the condition of 300 ms glimmering time and 500cd/m2 brightness.
Reliability grade • • • • •
Perceiving
reliability•Rs•
100 90 80 70 60
The fault point 0 1 2 3 4
Tab. 2 the impairment district and perceiving reliability static visual field visual field dynamic visual field
The reaction time The perceiving scope
Fig.5 dynamic visual field reliability and travelling speed division
0 50 100 150 200 250 300 50 60 70 80 90 100 reliability travelling spee d
The calculation of the DVF reliability
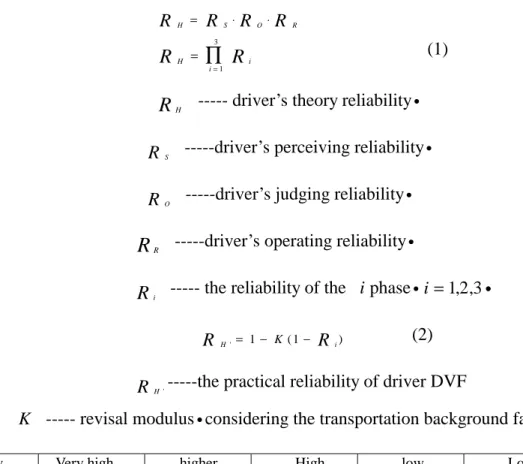
As being stated above, the three DVF phases(perceiving, judging and operating phase ) are series-wound. The DVF reliability is the product of the three phases’ reliabilities. The formula is as the following:
H S O R R = R ⋅R ⋅R H i i R = R = ∏ 1 3 (1)
R
H --- driver’s theory reliability•
S
R ---driver’s perceiving reliability•
O
R ---driver’s judging reliability•
R
R ---driver’s operating reliability•
i
R --- the reliability of the iphase•i=1 2 3, , ••
H i
R ' = 1− K(1− R ) (2)
H
R '---the practical reliability of driver DVF
K --- revisal modulus•considering the transportation background factors
Reliability grade
Very high higher High low Lower
Judging reliability 0.999•0.990 0.989•0.980 0.979•0.970 0.969•0.960 0.959•0.950 Operating reliability 0.999•0.993 0.992•0.986 0.985•0.979 0.978•0.972 0.971•0.965
Tab. 3 the judging and operating reliability of the dynamic visual field The reliability of the DVF and the safety driving speed
The most common measure to control the traffic accidence is to limit the driving speed, and previous research offered us the following formula on the maximal safety driving speed:
S W W D L A A t r v H v c ms c h m = β ( − − 2 − )R ' / •3•
Factors considered in the formula: highway width(W h) ,car width(W c) ,the minimal safety
distance between the car and the pavementD
ms,car
length
( )
, the angle of the car
( V)
,the reliability of the driver’s dynamic visual
field
H
R ',the driver’s reaction time ( )
t
r ,the modulus of the transportation informationcomplexity( β). Obviously, the DVF is an essential factor for the safety driving. In addition, another result infers two different driving speed districts concerning the different DVF reliability between the accident and non-accident group(Fig. 5).
The analysis of the fault point and the DVF reliability in accident and contrast group
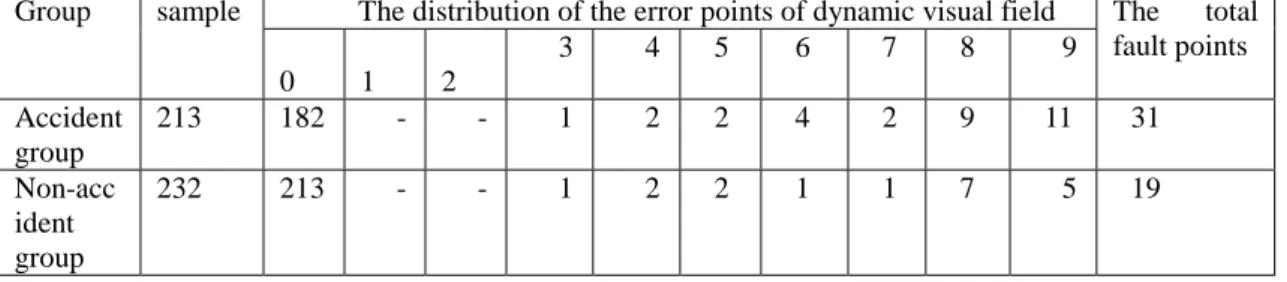
Subjects in the DVF experiment, were all selected by the similar SVF, aged 20-40 years. About one half of these subjects were 4 times’ accident drivers in spite of the others were non-accident. The distribution of the DVF is implied in table 4, which shows significant difference between the accident and non-accident group. That is to say, the fault points of the accident group are more than the one of the contrast group(p<0.05)(tab.5). All these suggests a closely association between the DVF and the safety driving.
The distribution of the error points of dynamic visual field Group sample 0 1 2 3 4 5 6 7 8 9 The total fault points Accident group 213 182 - - 1 2 2 4 2 9 11 31 Non-acc ident group 232 213 - - 1 2 2 1 1 7 5 19
Tab. 4 the distribution of the fault points of DVF in the two groups
Group Fault point Non-fault point total fault point rate
•%•
Accident 31 182 213 14.55
Non-accident 19 213 232 8.19
Total 50 395 445 1.12
Tab. 5 the comparison of the DVF between the two groups
Under the different brightness grade, the subjects were tested in another DVF measurement. Table 6 points out the distribution district of the visual field. It presents that the perceiving ability of the accident group is much lower than the one of the non-accident group.(p<0.05).(Tab. 7)
The distribution of the decline district of brightness
Group sample 0 1 2 3 4 5 6 7 8 9 total Accident 213 167 - - 1 4 5 6 5 12 13 46 Non-acci dent 232 205 - - 1 3 3 2 3 8 7 27
Tab. 6 the distribution of the decline district of brightness in the two groups Group Decline
brightness
normal Brightness total Decline rate•%•
Accident 46 167 213 46/213
Non-accident 27 205 232 27/232
total 73 372 445 73/445
Each reliability of the accident and contrast group(
H
R ') can be calculated from formula
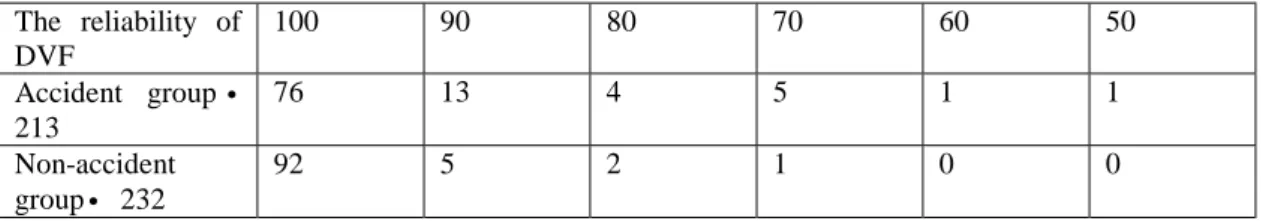
(2). The evidences make it clear that the accident group’s reliability is lower than the non-accident group’s (tab.8). In order to cut down the accidence, a useful database on drivers’ reliability should be created. When it well functioned, drivers, particularly for those make accidence easily, will be warned that they had better operate and control driving speed accustomed to their own DVF feature..
The reliability of DVF 100 90 80 70 60 50 Accident group• 213 76 13 4 5 1 1 Non-accident group• 232 92 5 2 1 0 0
Tab. 8 the distribution rate of reliability of the DVF in two groups
Conclusion
This study is conducted to set up the mode of the driver DVF, as well as the judgement of the visual field fault point associated with decreasing brightness in the visual field. Furthermore, the results of experiments illustrate the modulus system for the DVF.
The analysis of the DVF in the accident group and the non-accident group shows that the DVF reliability in the accident group is far lower than the one in the contrast group. Thus, according to above discussion, the model of the driver DVF is established.
High correlation is also found between the DVF reliability and the safe driving speed. In some degree, it is suggested that the maximum safe driving speed is restricted by the DVF reliability. Finally, the two different driving speed area (safety driving area & danger driving area) are put forward in the paper.
Reference
(1) McKenna, F.P.,(1982). The human factor in driving accidents: An overview of approaches and problems, Ergonomics, 25:867-877
(2) Thomas A. Ranney, (1994). Models of driving behavior : a review of their evaluation , (3) Yeh and Silverstein,(1990). Limits of fusion and depth judgment in stereoscopic color displays. Human Factors, 32, 45-60