Managing Performance Overhead of Virtual
Machines in Cloud Computing: A Survey, State
of Art and Future Directions
Fei Xu, Fangming Liu,
Member, IEEE,
Hai Jin,
Senior Member, IEEE,
Athanasios V. Vasilakos,
Senior
Member, IEEE
Abstract—Infrastructure-as-a-Service (IaaS) cloud computing offers customers (tenants) a scalable and economical way to provision virtual machines (VMs) on demand while charging them only for the leased computing resources by time. However, due to the VM contention on shared computing resources in datacenters, this new computing paradigm inevitably brings noticeable performance overhead (i.e., unpredictable performance) of VMs to tenants, which has become one of the primary issues of the IaaS cloud. Consequently, increasing efforts have recently been devoted to guaranteeing VM performance for tenants. In this survey, we review the state-of-the-art research on managing the performance overhead of VMs, and summarize them under diverse scenarios of the IaaS cloud, ranging from the single server virtualization, a single mega datacenter, to multiple geo-distributed datacenters. Specifically, we unveil the causes of VM performance overhead by illustrating representative scenarios, discuss the performance modeling methods with a particular focus on their accuracy and cost, and compare the overhead mitigation techniques by identifying their effectiveness and implementation complexity. With the obtained insights into the pros and cons of each existing solution, we further bring forth future research challenges pertinent to the modeling methods and mitigation techniques of VM performance overhead in the IaaS cloud. Index Terms—Cloud computing, virtualization, predictable performance, VM performance overhead.
F
1
I
NTRODUCTIONW
ITHthe ability to scale computing resources on de-mand and provide a simple pay-as-you-go busi-ness model for customers, cloud computing is emerging as an economical computing paradigm, and has gained much popularity in the industry. Currently, a number of big companies such as Netflix and Foursquare [1], have successfully moved their business services from the dedicated computing infrastructure to Amazon Elastic Computing Cloud (EC2) [2], which is a leading public Infrastructure-as-a-Service (IaaS) cloud platform world-wide. Undoubtedly, more individuals (tenants) and en-terprises will leverage the cloud to maintain or scale up their business while cutting down the budget, as reported by International Data Corporation (IDC) that the business revenue brought by cloud computing will reach1.1 trillion US dollars by 2015 [3].Unfortunately, the running performance of virtual machines (VMs) on the IaaS cloud platform is unpre-dictable, which significantly impacts the tenant’s Service-Level Agreement (SLA) offered by the cloud provider [4]. Specifically, due to the resource contention of VMs, the VM performance obtained in the IaaS cloud is severely
• Fei Xu, Fangming Liu and Hai Jin are with the Services Computing Technology and System Lab, Cluster and Grid Computing Lab in the School of Computer Science and Technology, Huazhong University of Science and Technology, 1037 Luoyu Road, Wuhan 430074, China. Email:
{xufei, fmliu, hjin}@hust.edu.cn.
• A. V. Vasilakos is with the Department of Computer Science, Kuwait Uni-versity, Safat 13060, Kuwait. Email:[email protected]. Manuscript received February XX, 2013; revised October XX, 2013.
degraded and highly variable, compared to the perfor-mance of VMs running in an isolated environment (e.g.,
running alone on a physical server in a local cluster) [5]. In this paper, we formally refer to such VM perfor-mance degradation and variation as VM performance overhead. Not surprisingly, several latest measurement studies on Amazon EC2 [2] have recently shown that diverse cloud applications listed in Table 1, ranging from latency-sensitive [6], network-sensitive [7], to data-intensive [5], suffer significant performance overhead, which consequently hinders users from moving their performance-critical business to the cloud. In particular, theperformance degradation and variationmetrics listed in Table 1 are measured as (1) the ratio of the degraded performance obtained in the IaaS cloud, in terms of the increased job execution time and the decreased network throughput, to the application performance obtained in isolated VMs, and (2) the variation of application performance obtained in the IaaS cloud over a period of time. Accordingly, these evidences bring forth a se-ries of urgent demands for managing the performance overhead of VMs and guaranteeing VM performance for tenants in the cloud.
From a high level perspective of the IaaS cloud, ex-isting studies control the performance overhead of VMs under three representative scenarios, ranging from the single server virtualization, a single large datacenter, to multiple geo-distributed datacenters, as summarized in Fig.1. On one hand, even with built-in resource isolation mechanisms on CPU cores, memory and disk capacities across VMs [8], the contention on shared cache and I/O
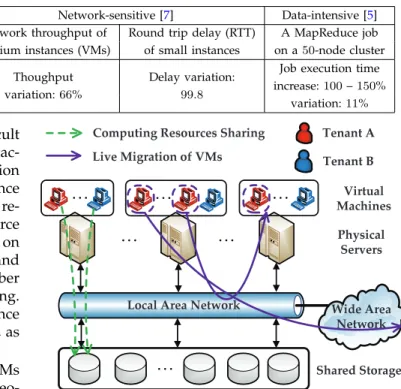
TABLE 1: Measurement Results of Application Performance on Amazon EC2 in Existing Literature Type of
applications
Latency-sensitive [6] Network-sensitive [7] Data-intensive [5] Doom3Game Apple’s Darwin Network throughput of Round trip delay (RTT) A MapReduce job Streaming Server medium instances (VMs) of small instances on a50-node cluster Performance Map load time
Throughput decrease:30% Thoughput variation:66% Delay variation: 99.8
Job execution time
degradation increase: increase:100–150%
and variation 25–110% variation:11%
bandwidth resources among co-located VMs is difficult to be alleviated by existing Hypervisors [9] in prac-tice [10]. Recent efforts on single server virtualization are primarily devoted to alleviating the VM performance overhead caused by the contention on shared server re-sources (e.g.,CPU cache and I/O bandwidth) by resource isolation. Moreover, to gain deep understandings on the relationship between the performance overhead and resource consumption of VMs, there have been a number of recent studies devoted to the performance modeling. With an accurate modeling method, the VM performance overhead can be alleviated in a cost-effective manner, as compared to the resource isolation techniques.
On the other hand, the performance overhead of VMs within a single mega datacenter and across multiple geo-distributed datacenters, however, can hardly be man-aged by the traditional resource isolation techniques. Specifically, in a single large datacenter, the distributed network and storage resources are shared among a huge amount of VMs leased by multiple tenants, as illustrated in Fig. 2. Such a cloud scenario undoubtedly makes the VM performance issue more intractable than the single server virtualization. Furthermore, among multiple geo-distributed datacenters, the issue of VM performance overhead becomes even more complicated due to the highly variable and scarce network resource over the Wide Area Network (WAN). While a number of solu-tions that mitigate such a VM performance issue have emerged recently, the fast innovations of these overhead mitigation techniques mandate comprehensive survey-ing of the state-of-the-art literature under the three cloud scenarios discussed above, with the aim of highlighting future directions in managing the performance overhead of VMs in IaaS clouds.
Therefore, we compare the latest solutions of manag-ing the performance overhead of VMs under the three cloud scenarios shown in Fig.1. The focus of this paper is on obtaining the insights into the benefits and costs of these solutions, as well as raising the future research challenges on the performance modeling methods and overhead mitigation techniques.
There also exists several alternative approaches deal-ing with the VM performance issue. For example, Cloud-Cmp [11] has been developed for guiding tenants in selecting the IaaS cloud platform with the best appli-cation performance from several cloud providers, such as Amazon EC2 [2], Microsoft Azure [12], and Rackspace Cloud Servers [13]. Several studies [14], [15] explore the hardware heterogeneity within the same type of Amazon EC2 instances (i.e.,VMs). Potential improvements of VM
Wide Area Network Local Area Network
Shared Storage Tenant A Tenant B Virtual Machines Physical Servers Computing Resources Sharing
Live Migration of VMs
Fig. 2: Typical architecture of the IaaS cloud datacenter. The running VMs of tenant A and B contend for the shared computing resources in datacenters, such as network and storage resources. In addition, the live migration of tenant A’s VMs severely impacts the performance of the applications running on tenant B’s VMs.
performance can accordingly be obtained by placing workloads onto the instances with good performance in the EC2 datacenters. The strategies above can provide ac-ceptable VM performance and reduce budgets on behalf of tenants, while they might hurt the benefits of cloud providers. Accordingly, we limit the scope of this survey to the solutions that alleviate VM performance overhead on behalf of both tenants and cloud providers.
The rest of this survey is organized as follows. Sec.2
explores the causes and summarizes the metrics of VM performance overhead by illustrating the representative scenarios of the IaaS cloud. The existing measurement and modeling methods of VM performance overhead as well as the future research issues are discussed in Sec. 3. Sec. 4 summarizes and compares the state-of-the-art solutions that manage VM performance overhead under diverse scenarios of the IaaS cloud, along with a fruitful discussion of future research challenges. Finally, we conclude this survey in Sec. 5.
2
C
AUSES ANDM
ETRICS OFVM P
ERFOR-MANCE
O
VERHEAD INI
AAS C
LOUDThere are various kinds of causes that can lead to the performance overhead of VMs in IaaS cloud datacenters, as illustrated in Fig. 1. In this section, we first expose and discuss these causes of VM performance overhead in detail, especially on single server virtualization, within a single datacenter, and across multiple geo-distributed datacenters, respectively. We next summarize the metrics of VM performance overhead used in the literature.
Performance Overhead of VMs in the IaaS Cloud
§4.1 Single Server
Virtualization §4.2 Within a Single Large Datacenter §4.3 Across Multiple Geo-distributed Datacenters
§4.2.1 Live Migration, Deployment and Snapshotting of VMs §4.1 CPU Cache Space,
Memory, Network and Disk Bandwidth §4.2.2 Shared Storage Resources Table 5 §4.2.3 Shared Network Resources §4.3.1 Live WAN VM Migration §4.3.2 Live WAN Storage Migration Hierarchy Causes Techniques §4.2.1 MECOM, CR/RT-Motion, PMigrate, iAware, VDN, VMTorrent, etc. Table 4 §4.1.1 Q-Clouds, NicPic, etc. §4.1.2 TRACON, DeepDive, Bobtail, etc.
Table 6 §4.2.2 PARDA,
SRP, Pisces, Horizon, QBox, Pesto, Romano, etc.
Table 7 §4.2.3 Seawall, EyeQ, Hadrian, ElasticSwitch, FairCloud, Gatekeeper, Falloc, Oktopus, etc.
Table 8 §4.3.1 VMFlockMS,
CloudNet, etc. §4.3.2 Hirofuchi et al.,
Nicolae et al., etc.
Fig. 1: Classification of causes and mitigation techniques of VM performance overhead from the viewpoint of IaaS cloud hierarchy. 2.1 Performance Impact of Single Server
Virtualiza-tion
The server virtualization technique [9], which serves as the cornerstone of cloud computing, multiplexes the computing resources of a physical server for mul-tiple co-located VMs. Current Virtual Machine Moni-tors (VMMs) or Hypervisors [9] (e.g., Citrix XenServer, VMware vSphere and Microsoft Hyper-V) have already provided good performance isolation mechanisms on sharing the resource of CPU cores, memory and disk capacities among co-located VMs. The isolation mecha-nisms can be implemented by fully-fledged CPU sched-ulers (e.g., Credit Scheduler in Xen [8]) and static par-tition of memory and disk capacities. However, server resources like CPU cache space, memory bandwidth, network and disk I/O bandwidth are very hard to be isolated in existing Hypervisors [10]. This inevitably leads to the contention on these aforementioned server resources among co-located VMs. As shown in [16], with each VM allocated to a dedicated CPU core, statically partitioned memory capacity and disk space, the exe-cution time of the lbm application from the SPECCPU 2006 benchmark [17] deployed on two co-located VMs on an Intel Core-2-Duo processor can be prolonged by up to 120%, compared with the performance of thelbm
application VM running alone. The above significant per-formance overhead of VMs is caused by the contention of cache and memory bandwidth on a physical server.
Furthermore, with the tide of green computing and the recent prevalence of deploying multi-core architecture systems in datacenters, VM consolidation is now widely used to improve the resource utilization of a multi-core physical server [18] and reduce the energy consumption of datacenters [19]. As more VMs are co-located on a physical server, VM consolidation, however, increases the severity of performance overhead of these co-located VMs on a physical server. As a result, the contention of shared cache and I/O bandwidth resources among co-located VMs on a physical server becomes one of the causes of VM performance overhead in the IaaS cloud.
2.2 Cause of VM Performance Overhead within a Single Datacenter
It is essential for tenants to lease a cluster of VMs from cloud providers when processing large jobs with a large amount of data (e.g., terabyte), such as MapReduce [20] and scientific workloads. In such cases, one natural question is that: are the performance isolation techniques for co-located VMs on a single physical server enough to eliminate the performance overhead among multiple VMs in a single datacenter? Unfortunately, the routine operations of the IaaS cloud datacenter, such as the (concurrent) live migration, deployment and snapshot-ting of multiple VMs, and the contention of multiple VMs on the shared cloud network and storage resources, complicate the issue of VM performance overhead and significantly degrade the performance of VMs. We elab-orate them in the following three cases, respectively.
The (concurrent) live migration of VMs [21] is an indis-pensable tool that enables the load balancing and power saving of a datacenter. It can nevertheless cause the per-formance overhead to the migrating VMs and co-located VMs on the migration source and destination servers, which is illustrated in Fig.2. As shown in [22], the live migration of a VM configured with 256 MB memory hosting the MySQL server, over a 100 Mbps Ethernet link, severely prolongs the end-to-end mean response time of the multi-tier Web applications (e.g.,RUBiS [23]) by 211%, compared with the application performance before the live VM migration. Undoubtedly, migrating multiple VMs simultaneously in a cloud datacenter will overload the datacenter network even worse, which further constrains the performance of CPU and network resources on the migration and destination servers, and incurs a long migration time (i.e., from several minutes to hours) [24].
The concurrent deployment and snapshotting of multiple VMsare two commonly occurring patterns of the routine operations in an IaaS cloud datacenter [25]. For example, to execute jobs with a large amount of data, it is the basic requirement of tenants to fast deploy (initialize) a
large number of VMs simultaneously in a public IaaS cloud platform [26]. As for the private cloud owned by a big IT enterprise, it is also the common demand of the employees for concurrently provisioning a large number of VMs fast in the daily working hours, even when there are a burst of VM deployment requests. Once the VMs are initialized and running, there is another basic requirement of tenants to fast take snapshots of their leased cluster of VMs simultaneously. Fast snap-shotting is also desired by Amazon Elastic Block Store (EBS) [27] for the checkpoint of VM states or the VM data sharing among workmates. Currently, both the public and private clouds, however, suffer the VM performance overhead caused by the concurrent deployment and snapshotting of multiple VMs. This is because these two operation patterns can generate a significant amount of network traffic, which inevitably interferes with the other VMs in the same datacenter [25].
The inability to isolate shared cloud network and storage resources among multiple VMs is another cause of perfor-mance overhead of VMs within a datacenter. In general, to serve the disk and network I/O requests for tenant VMs, the IaaS cloud datacenter deploys the shared back-end storage such as Storage Area Network (SAN), and shares the network resources such as network band-width on physical servers and switches, as shown in Fig. 2. This accordingly leads to the I/O contention on the shared storage and network resources among multiple VMs of tenants in a cloud datacenter. It is revealed by the latest measurements on Amazon EC2 that the standard medium instances experience up to
66% variation of the network I/O throughput [28], and the write I/O bandwidth of standard small instances can vary by as much as50% from the mean [6].
2.3 Cause from Live WAN Migration across Multiple Geo-distributed Datacenters
It is reported by Gartner Inc. that the hybrid use of public and private clouds becomes an imperative trend of the cloud computing [29], and more than half of large enterprises over the world will have such hybrid cloud deployments by the end of 2017 [30]. A commercial so-lution, Amazon Virtual Private Cluster (VPC) [31], now allows the private datacenter of IT companies connecting to a cluster of Amazon EC2 instances. These evidences above hence bring new challenges to manage VM per-formance overhead across the multiple geo-distributed datacenters, such as the performance overhead of VMs caused by the live migration of VMs and storage over the WAN connection.
Specifically, live migration of VMs and storage across geo-distributed datacenters over a WAN connection serves as an indispensable technique for managing com-puting resources of these datacenters. For big IT en-terprises with multiple geo-distributed datacenters, for example, live VM migration over the WAN enables the load balancing and power saving across datacenters, by
migrating several VMs from heavy-loaded datacenters to light-loaded datacenters and consolidating the VMs from the small datacenter into the large datacenter, respec-tively. For small IT companies deploying their business on the hybrid cloud, live WAN migration of VMs allows them to move or replicate their business services to the public cloud from the private cloud when the loads of service requests are bursting [32].
Different from the live VM migration in a Local Area Network (LAN) discussed in Sec. 2.2, the live WAN migration of VMs includes the data transfer of not only the VM memory state, but also the VM disk image and the on-going network connections [33]. Accordingly, this would cause a long VM migration time, application downtime, and a large amount of network traffic, which further leads to severe performance overhead to a certain number of VMs in the migration source and destination datacenters over the WAN, as well as the migrating VMs. Such performance overhead cannot be easily managed by VM performance guarantee solutions on a single server or in a single datacenter. For example, over the WAN with a maximum throughput of85Mbps, the live migration of a VM configured with1.7GB memory and
10GB disk hosting a Web service application, performed between the datacenters in Illinois and Texas, can un-dergo up to40minutes of disk transfer and210seconds of memory transfer. The response time of the Web service during the migration process is highly variable, can be degraded to52milliseconds on average, as compared to
10milliseconds before the migration [32]. Consequently, the migration of VMs over the WAN becomes another cause of performance overhead of VMs in IaaS clouds. 2.4 Evaluation and Metrics of VM Performance Over-head
After discussing the causes of VM performance over-head, the next natural and fundamental question is that:
how can we evaluate the performance overhead of VMs, and what are the metrics? To simply capture the performance overhead of VMs, the first type of metric is the per-formance degradation of various applications running in the IaaS cloud, compared with the application per-formance obtained in the VMs running in an isolated environment. Specifically, the performance degradation of VMsPd can be measured as
Pd=
|xiaas−xisolation| xisolation
, (1)
where xiaas and xisolation are the performance of VM applications running in the IaaS cloud and in isola-tion, respectively. The larger magnitude of performance degradation value Pd indicates the more severe perfor-mance overhead of VMs.
The second type of metric thatcapturethe performance overhead of VMs is the variation of VM performance obtained in the IaaS cloud over a period of time. Specif-ically, the VM performance variation Pv can be rep-resented by the Coefficient of Variation [34], which is
formulated as Pv= 1 ¯ x· v u u t 1 nx−1 · nx X i=1 (xi−x¯)2, (2)
where xi is the VM performance measured in the IaaS cloud over time. nx is the number of performance mea-surements. x¯ is the average of VM performance over time. The larger magnitude of performance variation valuePv implies the more severe performance overhead of VMs.
Due to the security concern and noticeable measure-ment costs, the performance degradation of VM applica-tions can hardly be obtained in several scenarios. In such cases, the third type of metric is required to reflect the performance overhead of VMs by examining the perfor-mance of routine operations in IaaS cloud datacenters, as introduced in Sec. 2.2and 2.3. Specifically, such a type of metric includes the duration of live VM migration (i.e., migration time), downtime of the migrating VM, energy consumption of live VM migration, the amount of network traffic caused by the live VM migration, deployment, and snapshotting. The smaller migration time, migration downtime, amount of network traffic and energy consumption implies the better performance of routine operations and lighter performance overhead of VMs. In summay, existing studies in the literature leverage the above three types of metrics to evaluate the performance overhead of VMs in the IaaS cloud.
3
M
ODELS ANDM
EASUREMENTS ONVM
P
ERFORMANCEO
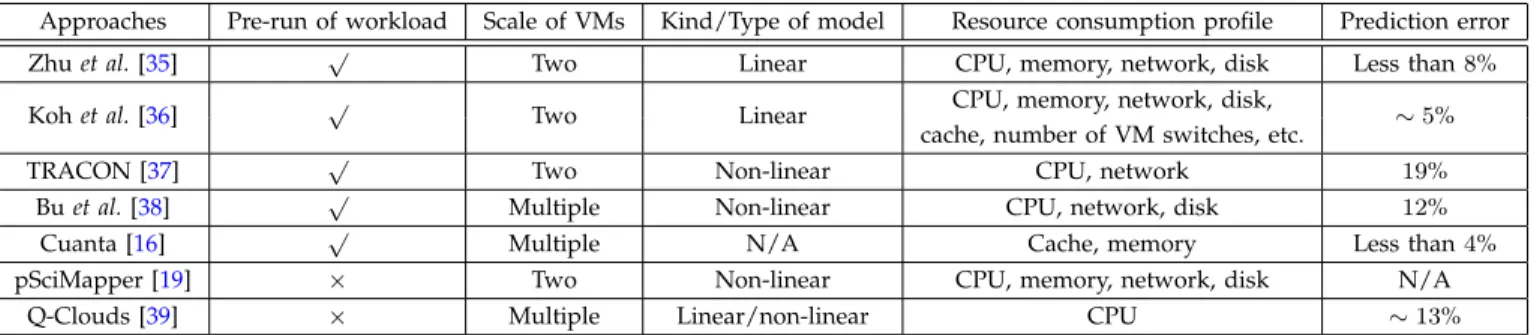
VERHEADIn order to well manage the performance overhead of VMs in datacenters, the primary requirement is to accu-rately model and measure VM performance overhead. Existing studies have devoted great efforts to modeling the performance overhead of VMs on two aspects: per-formance interference of co-located VMs on a physical server and VM performance overhead caused by the live migration of VMs. We review the representative performance modeling methods on the two aspects, and summarize them in Table 2 and Table 3, respectively. In particular, the table column of kind/type of model
indicates whether the model is linear or non-linear to its parameters. The column ofresource consumption profilein Table 2 represents the parameters of VM performance interference models. The table column of prediction error
shows the accuracy of the predicted VM performance overhead in comparison to the measured overhead data. Specifically, the smaller value of the prediction error implies the more accurate prediction modeling approach. 3.1 Models of VM Performance Overhead Caused by Single Server Virtualization
To model the performance interference of co-located VMs on a single server, the representative approach is to develop an accurate function of resource consumption
profile of these VMs. For example, Zhuet al.[35] propose a simple dilation factor to represent the performance interference between two co-located VMs on each of the four-dimensional resource consumption of VMs (i.e.,
CPU, memory, network and disk I/O). By pre-running each workload which is co-located with a background benchmark workload, this method manually varies the resource consumption of workloads (e.g., varying CPU consumption from10% to100% with a step of10%), and acquires the dilation factorsofflinefor the workloads. The larger dilation factor means the more severe performance interference of co-located VMs. Similar with the previ-ous approach, Koh et al. [36] predict the performance interference between two VMs by two linear statistical approaches (i.e., weighted mean method and linear re-gression analysis). In addition, this method enriches the resource consumption profile of VMs with other system-level workload metrics, such as the statistics of cache hits and misses, VM switches. The above linear statistical model of performance interference I is presented as
I=α0+ p
X
i=1
αiXi, (3)
whereXiis thei-th dimension of VM resource consump-tion. pis the dimensions of VM resource consumption, andα0,αi are the model coefficients.
With a particular focus on the co-located VMs host-ing data-intensive applications, two non-linear statistical models have been developed in [37] and [38]. Specifi-cally, by extending the linear model shown in Eq. (3), TRACON [37] models the performance interference I between two co-located VMs as a quadratic function of CPU and I/O bandwidth consumptionXiof VMs, which is given by I=α0+ X4 i=1 αiXi 2 , (4)
A more accurate model has been presented in [38], where the performance interference of multiple co-located VMs is modeled as an exponential function of VM CPU and I/O resource consumption, which is shown as below,
I=α0+α1exp X i γiX cpu i +α2exp X i ωiXiio , (5)
where Xicpu and Xio
i are the CPU and I/O resource consumption of VMs, respectively. γi and ωi are the model coefficients. Nevertheless, these above linear and non-linear statistical models in Eq. (3), (4) and (5) require theoffline-trainingof experimental statistics to obtain the model coefficients, e.g., αi, γi. To particularly predict the performance interference on the cache and memory bandwidth among multiple co-located VMs, Cuanta [16] first leverages a certain synthetic cache benchmark and an interference matrix to create the cache clones with the same cache behaviors of these VMs. This method then looks up a degradation table to model the effect of interference from co-located VMs. In particular, the
TABLE 2: Comparison of Modeling Performance Interference of Co-located VMs on a Physical Server
Approaches Pre-run of workload Scale of VMs Kind/Type of model Resource consumption profile Prediction error Zhuet al.[35] √ Two Linear CPU, memory, network, disk Less than8%
Kohet al.[36] √ Two Linear CPU, memory, network, disk, ∼5% cache, number of VM switches, etc.
TRACON [37] √ Two Non-linear CPU, network 19%
Buet al.[38] √ Multiple Non-linear CPU, network, disk 12%
Cuanta [16] √ Multiple N/A Cache, memory Less than4%
pSciMapper [19] × Two Non-linear CPU, memory, network, disk N/A
Q-Clouds [39] × Multiple Linear/non-linear CPU ∼13%
interference matrix and degradation table are generated
offlineby the pre-runs of the cache benchmark and VMs. Whereas the previous approaches require pre-run of workloads to acquire necessary parameters of the sta-tistical prediction model, several studies make efforts to break such a limitation. For example, pSciMapper [19] leverages the Pearson Correlation Coefficient [34] of multi-dimensional VM resource consumption (e.g.,CPU, memory, network and disk I/O), to estimate the perfor-mance interference IXY between two VMs. Specifically, the interference model is given by
IXY = pPX iYi−PXiPYi p pP X2 i −( P Xi)2· p pP Y2 i −( P Yi)2 , (6) whereXiandYiare the resource consumption of the two co-located VMs, andpis the dimensions of VM resource consumption. In particular, the larger correlation result IXY indicates the more severe VM performance interfer-ence. Q-Clouds [39] develops a discrete-time (linear or non-linear) model of history performance feedbacks and current CPU resource caps of VMs ui, to online predict the current performance of co-located VMs Pi. At each time step i, the discrete-time model is given by
Pi= Φ(Pi−1,· · ·, Pi−n, ui,· · ·, ui−m), (7) where m and n represent to what extent the history values of performance data and CPU resource caps im-pact the current performance, respectively. In particular, the model construction ofΦ(·)requires a learning phase using the historical observed performance data Pi and CPU resource caps ui of multiple VMs.
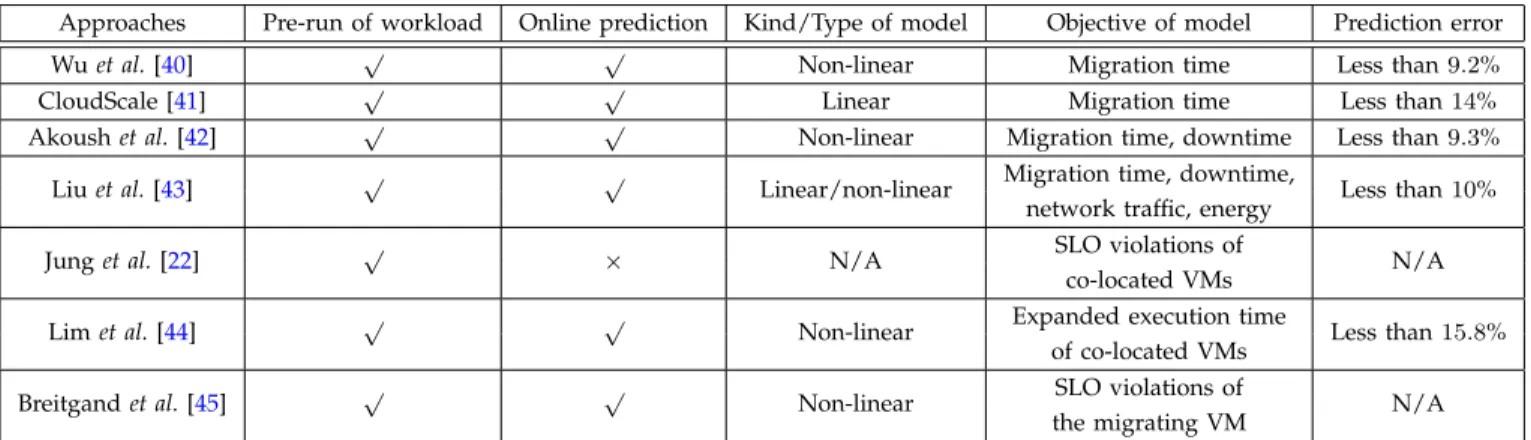
3.2 Models of VM Performance Overhead Caused by Live Migration of VMs
As discussed in Sec. 2.4, the migration time is an im-portant metric that reflects VM performance overhead caused by the live migration of VMs. A number of meth-ods have recently been proposed to model the migration time. For example, Wu et al. [40] particularly study the relationship between the domain-0 CPU allocation Ucpu and the live migration time Tmig. Specifically, given a VM to be migrated,Tmigcan be modeled as a non-linear function ofUcpu, which is given by
Tmig= β Uκ cpu
, (8)
where β and κ are the model coefficients, and β, κ ∈ (0,∞). In particular, these coefficients require the pre-run of workload applications and are trained offline using the experimental results of multiple pre-runs. Given a VM migration environment, CloudScale [41] estimates the migration time Tmig using a linear function of the memory size Vmem of the migrating VM. Similar to Eq. (8), such a linear function is also derived based on the regression analysis of experimental results of multiple migration pre-runs. The impact of another two parameters (i.e.,network link speedRand memory page dirty rate D) to the VM migration time Tmig has been examined by simulation models in [42], where Tmig is proved to be non-linear to Rand D.
Based on the four parameters (i.e.,Ucpu,Vmem,Rand D) above, an integrated model of the VM migration time Tmig has been developed in [43], which is given by
Tmig= n X i=1 ti, ti = ti−1·D r , i≥2 Vmem r , i= 1 , (9)
wherenis the total rounds of memory pre-copy phases1.
ti is the phase time for each round of memory pre-copy, and r is the network transmission rate for the live VM migration. Asrhighly correlates withUcpu[40] and is restricted by R, it can be further modeled as r = f(Ucpu, R), where f(·) is a non-linear function. In addition to the performance metric of migration time, Liuet al.[43] further develop a series of statistical models to predict several other important VM migration metrics including the network trafficNmig, energy consumption Emig, and application downtimeTdown, respectively. Ac-cordingly, the migration performancePmig of migrating a VM can be comprehensively evaluated as
Pmig=a·Tmig+b·Tdown+c·Nmig+d·Emig, (10) wherea,b,canddare the model coefficients. In particu-lar, the application downtimeTdown is the phase time for the last round of memory copy tr according to Eq. (9). The network trafficNmigis the total transferred memory pages during the live VM migration, which is calculated asVmem+Pni=1ti·D. The energy consumptionEmig is proportional to the network traffic Nmig, which can be modeled as ρ·Nmig+θ, where ρ and θ are the model
TABLE 3: Comparison of Modeling VM Performance Overhead Caused by Live Migration of VMs
Approaches Pre-run of workload Online prediction Kind/Type of model Objective of model Prediction error
Wuet al.[40] √ √ Non-linear Migration time Less than9.2%
CloudScale [41] √ √ Linear Migration time Less than14%
Akoushet al.[42] √ √ Non-linear Migration time, downtime Less than9.3%
Liuet al.[43] √ √ Linear/non-linear Migration time, downtime, Less than10% network traffic, energy
Junget al.[22] √ × N/A SLO violations of N/A
co-located VMs
Limet al.[44] √ √ Non-linear Expanded execution time Less than15.8% of co-located VMs
Breitgandet al.[45] √ √ Non-linear SLO violations of N/A
the migrating VM coefficients. In particular, these model coefficients are
ob-tained based on the regression analysis of experimental statistics which are measured offline.
The former approaches model the performance over-head of VMs caused by the live migration from the perspective of migration performance itself. While from the perspective of the migrating VM and other co-located VMs on the migration source and destination servers, VM performance overhead can simply be measured as
performance degradation for each specific application in an offline manner during the live migration [22], [41]. In addition, such a VM performance overhead can be modeled mathematically. Specifically, considering the live VM migration as a job that consumes the comput-ing resources of physical server, Lim et al. [44] predict the performance overhead (i.e.,the prolonged execution time Text) of co-located VMs on the migration source and destination servers, using a two-resource contention model which is given by
Text=τ(q1q2+ (1−q1)(1−q2)), (11) whereτ is the application execution time running alone on a physical server. q1, q2 are the probabilities of ac-cessing a kind of VM resource by the live VM migration and the co-located VM, respectively, and q1, q2 ∈ [0,1]. The parameters in Eq. (11) are acquiredoffline using the VM performance statistics. Especially for the migrating VM hosting a Web server, Breitgand et al. [45] adopt the queuing theory to model the Service Level Objective (SLO) violation of such a migrating Web application, which is quantified as a function of the network band-width allocated to the live VM migration Bm. Specifi-cally, given the SLO of the Web service tSLO and the maximum network bandwidth of the Web server B, the probability of SLO violationsP(t > tSLO)is modeled by P(t > tSLO) = exp(tSLO·(λ−µ(B−Bm))), (12) whereµ(B−Bm)denotes the requests’ response rate of the Web server, given the migration bandwidthBm.λis the requests arrive rate to the Web server.
3.3 Summaries, Insights and Open Research Issues From the above comparison of performance modeling methods summarized in Table2and Table3, we raise the
following conclusions, insights and open research issues:
First, statistical methods, such as regression analysis and correlation analysis [34], have been proved to be effective in the model construction and estimation of VM performance overhead caused by the single server virtualization and live VM migration. Although the sta-tistical methods are widely used in the existing modeling approaches with a high prediction accuracy, most of them require the pre-run of VM workloads to acquire necessary parameters of the prediction models of VM performance overhead. Such a requirement is not always practical in datacenters, as it is under the assumption that few kinds of workloads are running on the homoge-neous physical servers. In real-world cloud datacenters, the heterogeneity of hardwares [14] and workloads [46] becomes common. The pre-run of workloads or offline measurements on each type of hardware will undoubt-edly bring noticeable processing overhead to the model construction. Accordingly, how to develop a lightweight yet effective prediction model of VM performance over-head without the pre-run of workloads becomes an open research problem.
Second, from the above discussion on the complexity of model construction, we further obtain a key insight into the relationship between the accuracy and cost (e.g.,
pre-run of VM workloads) of the model of VM perfor-mance overhead. For example, although the correlation analysis of VM resource consumption in Eq. (6) does not require the pre-run of VM workloads, this method only provides an estimationof performance interference between two VMs, rather than an accurate value of the VM performance interference. As a result, the accuracy of the prediction model should be determined by its practical usage. On one hand, a lightweight estimation model that catches the qualitative trend of VM perfor-mance overhead is sufficient to guide in determining an appropriate assignment of VMs, for mitigating the performance overhead of VMs (e.g., [19]). On the other hand, a sophisticated prediction model that accurately quantifies the performance overhead of VMs is required to re-allocate the computing resources to the competing VMs within a single datacenter (e.g., [39]).
Third, although a number of performance models of single server virtualization have been proposed (refer to
Table2), there lacks a holistic prediction model to quan-tify the performance overhead of multiple (i.e.,more than three) co-located VMs on multi-dimensional resources of a single physical server (i.e., CPU cache, memory bandwidth, network and disk I/O bandwidth) without the pre-run of workloads. Hence, how to design such a holistic model of performance overhead among multi-ple VMs becomes a promising research problem. One potential modeling solution is to extend the discrete-time model of CPU resource in [39], i.e., Eq. (7), to support multi-dimensional server resources. However, this method requires learning the relationship between the current performance data and the historical resource consumption of VMs for the model construction. The overhead (e.g., CPU cycles) caused by such a learning phase cannot be neglected. Hence, it would be also interesting to mitigate such an overhead incurred by the learning phase for constructing this model.
Fourth, to quantify the performance overhead of VMs caused by live VM migration, existing modeling meth-ods focus on the performance of either the migrating VM or co-located VMs on migration source and desti-nation servers (refer to Table 3). Accordingly, it would be desirable to design a prediction model that jointly quantifies the performance overhead of the migrating VM and its co-located VMs, in order to comprehensively evaluate the performance overhead caused by the live VM migration process [47]. Furthermore, as the multi-tier application that requires multiple interdependent VMs are widely deployed in datacenters [22], the migra-tion of a VM (e.g.,the SQL server) can adversely impact the performance of other associated VMs (e.g., the Web server). Hence, the evaluation of performance overhead of live VM migration cannot be restricted to the single migrating VM (i.e., [45]). The cascading performance effects to other associated VMs should be incorporated into the model of VM performance overhead, particu-larly for evaluating multi-tier VM applications.
Last but not least, although the performance of live VM migration has been comprehensively studied and mod-eled (e.g.,[43]) in the LAN environment, the performance model of live VM migration over the WAN has not been investigated yet. Such a performance model would be beneficial for the tenant to utilize the computing resources in the hybrid cloud (i.e., public and priviate clouds across multiple geo-distributed datacenters). For example, the migration performance model in the WAN is effective in improving the performance of migrating VM and the migration itself, by selecting an appropriate migrating VM and a migration destination datacenter. However, the performance model of live VM migration in the LAN cannot be directly applied in the WAN environment due to at least two reasons: (1) the network link bandwidth can vary significantly over time in the WAN, and (2) the VM disk image is also required to be transferred over the WAN. Consequently, how to develop a performance model of live WAN migration of VMs becomes another future research problem.
4
M
ANAGINGP
ERFORMANCEO
VERHEAD OFVM
S INI
AAS C
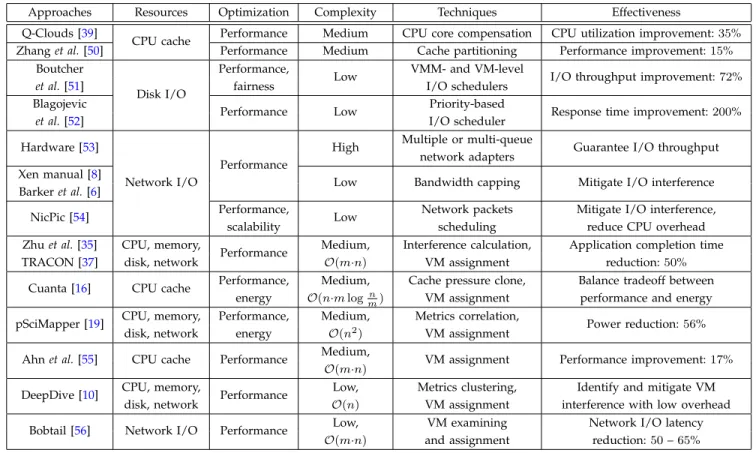
LOUDA large number of approaches have recently been pro-posed to manage VM performance overhead and guar-antee the performance of VMs in the IaaS cloud. We broadly classify and summarize these solutions accord-ing to the high-level hierarchy of IaaS cloud datacenters shown in Fig. 1. We compare these solutions on single server virtualization, within a single mega datacenter, and across multiple geo-distributed datacenters, in the following three subsections, respectively. These overhead mitigation techniques are summarized in Table4– 8. In particular, the table column ofcomplexityrepresents the implementation complexity of techniques introduced to the original systems (e.g., Hypervisors, shared storage and networks). It also shows the time complexity of VM assignment algorithms in a number of overhead mitigation techniques (e.g.,pSciMapper [19],iAware[47], Pesto [48] and Oktopus [49]). The time complexity no-tationsm and n denote the number of physical servers and virtual machines in a datacenter, respectively. 4.1 Alleviating VM Performance Overhead Caused by Single Server Virtualization
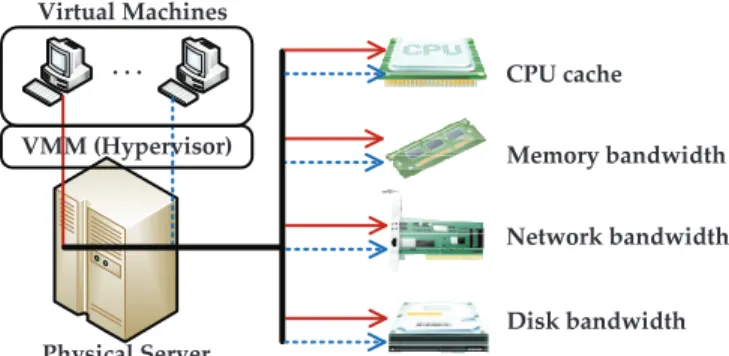
Currently, Hypervisors [9] such as Citrix XenServerand Microsoft Hyper-V, provides a baseline of performance isolation on CPU, memory and disk resources by simply allocating each VM (including domain-0) with dedicated CPU core(s) and an amount of non-overlapped mem-ory and disk capacities. However, the cache and I/O bandwidth resources shared among multiple co-located VMs shown in Fig.3, cannot be easily isolated in existing Hypervisors, as we have discussed in Sec. 2.1. To deal with such a performance issue, a number of approaches have been proposed to mitigate the performance over-head of VMs caused by the single server virtualization. We summarize these solutions in Table4.
. . . Virtual Machines Physical Server Memory bandwidth Network bandwidth Disk bandwidth CPU cache VMM (Hypervisor)
Fig. 3: Shared computing resources among co-located VMs on a physical server. The CPU cache and I/O bandwidth resources can bring performance interference to co-located VMs in existing Hypervisors.
4.1.1 Resource Isolation among Co-located VMs
To alleviate performance overhead of VMs on a single physical server, one conventional approach is to isolate the computing resources among co-located VMs. To mitigate the performance interference on the CPU cache
TABLE 4: Comparison of Approaches to Alleviate VM Performance Overhead Caused by Single Server Virtualization Approaches Resources Optimization Complexity Techniques Effectiveness Q-Clouds [39]
CPU cache Performance Medium CPU core compensation CPU utilization improvement:35% Zhanget al.[50] Performance Medium Cache partitioning Performance improvement:15%
Boutcher
Disk I/O
Performance,
Low VMM- and VM-level I/O throughput improvement:72%
et al.[51] fairness I/O schedulers
Blagojevic
Performance Low Priority-based Response time improvement:200%
et al.[52] I/O scheduler
Hardware [53]
Network I/O
Performance
High Multiple or multi-queue Guarantee I/O throughput network adapters
Xen manual [8]
Low Bandwidth capping Mitigate I/O interference Barkeret al.[6]
NicPic [54] Performance, Low Network packets Mitigate I/O interference,
scalability scheduling reduce CPU overhead
Zhuet al.[35] CPU, memory,
Performance Medium, Interference calculation, Application completion time TRACON [37] disk, network O(m·n) VM assignment reduction:50%
Cuanta [16] CPU cache Performance, Medium, Cache pressure clone, Balance tradeoff between energy O(n·mlog n
m) VM assignment performance and energy
pSciMapper [19] CPU, memory, Performance, Medium, Metrics correlation, Power reduction:56% disk, network energy O(n2) VM assignment
Ahnet al.[55] CPU cache Performance Medium, VM assignment Performance improvement:17%
O(m·n)
DeepDive [10] CPU, memory, Performance Low, Metrics clustering, Identify and mitigate VM disk, network O(n) VM assignment interference with low overhead Bobtail [56] Network I/O Performance Low, VM examining Network I/O latency
O(m·n) and assignment reduction:50–65% and memory bandwidth, Q-Clouds [39] dynamically
provisions the underutilized or idle CPU resource to the impacted (victim) VMs using closed loop resource management. Accordingly, the workload SLAs can be guaranteed and the datacenter utilization is improved. Page coloring mechanism2 assigns the virtual memory
pages and physical cache pages with different colors, where the virtual memory page can only be allocated to the physical cache page with the same color. Such a technique can accordingly be used to partition the cache space and control the contention on the cache resource among co-running applications [50]. However, whether page coloring can alleviate the performance interference on the cache and memory bandwidth resource among co-located VMs requires to be further investigated.
To control the disk I/O contention among co-located VMs on a physical server, one possible solution is to leverage the disk I/O scheduling technique on the VM and VMM level. For example, Boutcheret al.[51] empiri-cally show that the aggregate amount of I/O throughput of co-located VMs can significantly be improved, by choosing the appropriate disk I/O schedulers of VM and VMM from the existing Linux I/O schedulers. In particular, the disk I/O fairness among co-located VMs can only be achieved at the cost of I/O throughput and latency. To improve the response time for I/O requests with a high priority, a priority-based scheduler has been proposed in [52]. This scheduler intercepts I/O requests at the VM level, and re-orders these requests in the disk 2. Page coloring mechanism is the traditional cache and memory management technique in theOperating System.
I/O queue of a physical server according to their priority information at the VMM level.
The performance interference on network bandwidth among co-located VMs is managed through two kinds of solutions in existing studies. On one hand, it is reported that the network bandwidth of VMs can be isolated from the other co-located VMs by hardware solutions, such as installing multiple network adapters or multi-queue network adapters for the VMs on a physical server [53]. On the other hand, the network bandwidth of VMs can be guaranteed by software solutions (i.e.,bandwidth capping techniques), via statically setting a bandwidth cap in the VM configuration file before booting the VM [8], or limiting the network bandwidth using the
“tc” utility in the Linux kernel [6]. To allow scalable and dynamic programmable rate limiting with low CPU overhead, NicPic [54] classifies and stores the network packets in transmit queues in memory, and schedules the packets from memory to NIC using direct memory access according to the rate limits of VMs.
4.1.2 Optimization of VM Assignment
In addition to the resource isolation techniques, it is also effective in alleviating VM performance overhead by finding an optimal mapping of VMs to physical servers. Specifically, by greedily minimizing the VM performance overhead calculated by the model introduced in Eq. (3), (4), or (5), such an optimized VM assignment3 can
ac-cordingly minimize the performance interference among 3. VM assignment decides that which VM is assigned to which physical server. It requires the live migration of VMs.
co-located VMs [35], [37]. As more physical servers are provisioned, the performance interference of VMs will be reduced while leading to higher energy consump-tion. Accordingly, to jointly balance the tradeoff between energy consumption and VM performance, Cuanta [16] and pSciMapper [19] determine the VM assignment and the number of physical servers, by greedily maximizing the ratio of VM performance to VM power. A similar performance-aware VM assignment mechanism has been proposed in [55], where the cloud scheduler greedily alleviates the VM contention on Last-Level Cache (LLC) in the entire cloud system. Specifically, for the physical server with maximum LLC misses and the physical server with minimum LLC misses, this approach itera-tively swaps the VM with maximum LLC misses on the former server and the VM with minimum LLC misses on the latter server, via live migration of VMs.
To efficiently identify and manage the performance interference of VMs, DeepDive [10] first qualitatively pinpoints culprit resource (i.e.,the resource which is the source of interference) using a clustering technique of low-level VM metrics. Then, this approach migrates the VM consuming the culprit resource most aggressively to other servers, so that the VM interference is sufficiently mitigated or totally eliminated. With a particular focus on the network I/O resource, Xu et al.[56] observe that the co-scheduling of CPU-bound and latency-sensitive applications on a physical server can cause long I/O la-tency to VMs. Based on such an observation, they further design a simple VM examining method, which assigns latency-sensitive applications to good-performing VMs, avoiding the co-location with bad-neighboring VMs. 4.2 Mitigating VM Performance Overhead within a Single Datacenter
As analyzed in Sec.2.2, the routine operations of an IaaS cloud datacenter including the (concurrent) live migra-tion, deployment and snapshotting of multiple VMs, and the contention of multiple VMs on the shared datacenter network and storage resources, can severely degrade the performance of VMs. We review and summarize the existing approaches that mitigate the performance overhead of VMs within a single datacenter in Table 5, Table 6 and Table 7, according to the aforementioned three aspects, respectively.
4.2.1 Live Migration, Deployment and Snapshotting of Multiple VMs
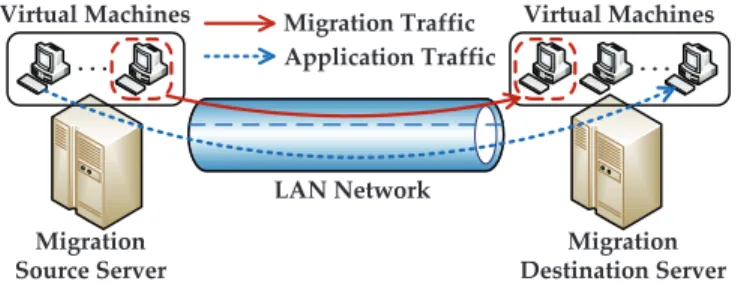
Live Migration of VMs. The migration process causes different aspects of performance overhead to VMs in terms of migration time, application downtime, network traffic, and energy consumption [43]. To alleviate such performance overhead, one intuitive method is to reduce the amount of transferred data during the live migration of VMs. For example, by taking advantage of plenty multi-core CPU resource, MECOM [57] utilizes the tra-ditional data compression technique to significantly re-duce the amount of transferred memory pages on the
Migration
Source Server Destination ServerMigration
. . . .
Virtual Machines Virtual Machines
LAN Network Migration Traffic Application Traffic
Fig. 4: Typical live migration process of a single VM. The migration traffic occupies a certain amount of network bandwidth, which inevitably constrains the performance of co-located VMs on migration source and destination servers during live migration of VMs.
migration source server. Yet, this method requires de-compressing those transferred memory pages to restore VM memory state on the migration destination server.
To further reduce the network traffic during live mi-gration of VMs, several practical approaches have been proposed in existing studies (e.g.,[58], [60], [61]). Specif-ically, instead of transferring the entire dirty memory pages in each round of pre-copy [21] phase, (1) the delta compression technique [60] compresses and transfers the data changes between the current and previous version of memory pages, particularly for the applications with a fast dirty rate of memory pages over a slow network. (2) The memory “pruning” approach [58], [59] identifies and transfers the necessary VM memory pages which are mandatory for the VM to run correctly on the destination server after the VM migration, such as the application data and OS kernel data. (3) CR/RT-Motion [61] first transfers a small amount of logs for the VM execution events traced on the migration source server. Then, the VM memory state can be restored by replying the execution trace logs on the migration destination server. (4) Joet al.[62] only transfer the memory pages that are not available on the shared storage, along with a list of storage blocks with the memory page locations, in order to restore the VM memory state on the destination server. While the approaches above focus on reducing the amount of transferred data to improve the performance of live VM migration itself, PMigrate [63] aims to paral-lelize the data and processes of the migration operation using abundant CPU and network resources, in order to accelerate the live migration of VMs. Different from these approaches above, Liu et al. [43] alleviate the performance overhead of the migrating VMs by selecting the VM with the smallest migration cost for migration. In particular, the migration cost is quantified by the migration performance model described in Eq. (10).
Furthermore, the migration process also deteriorates the performance of VMs (including the migrating VM) on the migration source and destination servers [47]. As shown in Fig.4, the migration traffic interferes with the application traffic among the co-located VMs on both migration source and destination servers. In addition, the migration process consumes a certain amount of CPU cycles in domain-0 [44]. (1) To mitigate the perfor-mance overhead on the migrating VM, CloudScale [41] chooses to migrate the VM with the smallest SLO penalty
TABLE 5: Comparison of Approaches to Manage VM Performance Overhead Caused by Live Migration, Deployment and Snapshotting of Multiple VMs within a Single Datacenter
Approaches Objective Optimization Complexity Techniques Effectiveness MECOM [57] Live migration of a VM Migration time, application downtime, network traffic
Medium Compression Migration time reduction:32% Kotoet al.[58]
Low Filter un-useful Migration time
Chianget al.[59] memory pages reduction:34–68.3%
Svardet al.[60] Medium Compression, page Migration time
delta transfer reduction:40% CR/RT
Medium Transfer and replay Migration time
-Motion [61] of execution logs reduction:31.5%
Joet al.[62] Low Transfer storage Migration time
locations of memory reduction: over30% PMigrate [63] Migration time, Low Parallelizing Migration speedup
application downtime migration factor:2.49–9.88
Liuet al.[43] Migration performance, Medium, Migrate the VM Migration cost energy O(n) with minimum cost reduction:72.9% Breitgand Performance of migration
Low Migration bandwidth minimize SLO
et al.[45] and the migrating VM allocation violations
CloudScale [41] Resource conflict Performance of Low, Migrate the VM with minimum cost on VM performance
SLO violation
handling co-located VMs O(m·n) reduction:83%
iAware[47] Load balancing, Performance of VMs on Low, Performance power saving source and destination O(m·n) improved:16–65% Deshpande Concurrent migration Concurrent migration
Medium De-duplication Network traffic et al.[24] of multiple VMs time, network traffic reduction:75%
VDN [64] Concurrent deployment and snapshotting of multiple VMs Startup delay
High De-duplication, Speedup factor:
of multiple VMs chunking 30–80
Razaviet al.[65] Scalability, VM Low VM image caching Speedup factor:
booting delay 8
Nicolaeet al.[25]
Performance of VM
Medium
Lazy VM deployment, Speedup factor: snapshotting and store incremental 2–25, bandwidth
deployment update reduction:90%
VMTorrent [26] Scalability, VM Medium VM image profile, Speedup factor:
booting delay block pre-fetching 30
which is measured offline for each VM application. (2) To further alleviate the performance overhead of VMs on migration source and destination servers,iAware[47] chooses to migrate the VM with the least performance interference among the co-located and migrating VMs. In particular, the interference is predicted online by a multi-resource demand-supply model. With a particular focus on the performance of migrating VM and the migration itself, Breitgandet al.[45] develop a mathematical model to learn the tradeoff between the migration time and VM performance, as described in Eq. (12). By jointly minimiz-ing the migration time and improvminimiz-ing the performance of migrating VM, this approach allocates an appropriate network bandwidth to the live VM migration.
Given the same VM candidates for live migration, it has been shown that the performance of concurrent live migration of these VMs is much worse than that of se-quential live migration of these VMs [44]. To mitigate the migration performance overhead (i.e.,reducing the net-work traffic and migration time), the approach proposed in [24] still focuses on reducing the amount of transferred data. Specifically, this method de-duplicates the memory pages among co-located VMs and transfers the identical memory pages only once, during the concurrent live
migration of the VMs hosted on a physical server.
Deployment and Snapshotting of VMs. To reduce the deployment time of multiple VMs, traditional ap-proaches adopt the Peer-to-Peer (P2P) technique, which allows the VMs booting from the same image to share the content of VM image among themselves [74]. How-ever, it cannot mitigate the potential VM performance overhead caused by a significant amount of network traffic due to the concurrent VM deployment. To mitigate such a traffic overhead, VDN [64] proposes a VM image distribution network based on the cross-image duplica-tion characteristic, i.e., the similarity among real-world VM disk images (e.g., VMware images and Amazon machine images) can be as high as60% [75]. Specifically, this method divides VM images into disjoint chunks, and allows the VMs to share these chunks in a topology-aware network during provisioning these VMs.
As observed that only a small part of the VM image is required to be loaded for the VM startup [65], the booting part of VM images can be cached in compute nodes, in order to reduce the VM booting time and the traffic load to datacenter networks. In addition, a lazy VM deployment mechanism has been proposed in [25], where the VM image blocks are fetched as required by
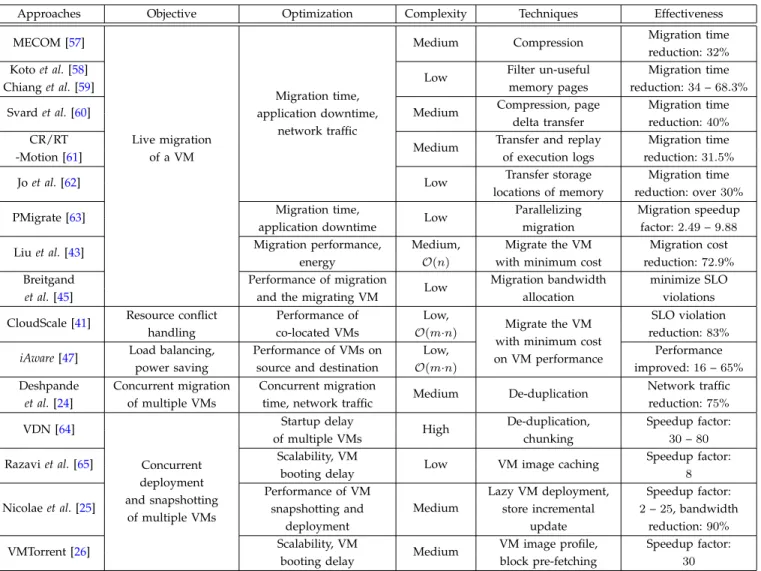
TABLE 6: Comparison of Approaches to Mitigate Contention of VMs on Shared Storage Resource of a Single Datacenter Approaches Objective Optimization Complexity Techniques Effectiveness PARDA [66]
Storage I/O isolation and
fairness
Weighted sharing Medium I/O queue control,
Guarantee I/O performance, fairness fair I/O scheduler
SRP [67] Minimum guarantee, Medium I/O queue control, limits, weighted sharing demand prediction Pisces [68] Weighted sharing,
high utilization Medium
I/O queue control, max-min ratio:0.99, data placement, I/O throughput replica selection improvement:20%
Tarasov Storage cache
Medium I/O classification, I/O throughput et al.[69] allocation data pre-fetching improvement:11–95% Soundararajan
SLO guarantee of storage I/O service
I/O bandwidth
Low I/O bandwidth Minimize SLO violation
et al.[70] allocation partitioning of I/O service
Horizon [71], Storage I/O requests
Low I/O requests re-ordering 92–99% deadlines of
QBox [72] scheduling I/O requests are met
Pesto [48] Storage I/O hotspot mitigation
I/O Load balancing, Medium,
VM assignment, I/O performance
modeling
Peak I/O latency migration cost, benefit O(m·n) reduction:19%
Romano [73] Migration benefit, High, Average I/O latency
storage I/O interference O(n2) reduction:58%
the execution of applications, so as to avoid transferring and loading the unnecessary image data to VMs. VM-Torrent [26] further refines this lazy deployment method by pre-fetching the image data blocks, according to the offline profile information of data block accessing for each specific pair of a workload and a VM image. To reduce the network traffic caused by the concurrent VM snapshotting, Nicolae et al.[25] propose to save the im-age difference between the current imim-age snapshot and the former-stored VM image to the persistent storage, rather than the snapshot of a whole image file.
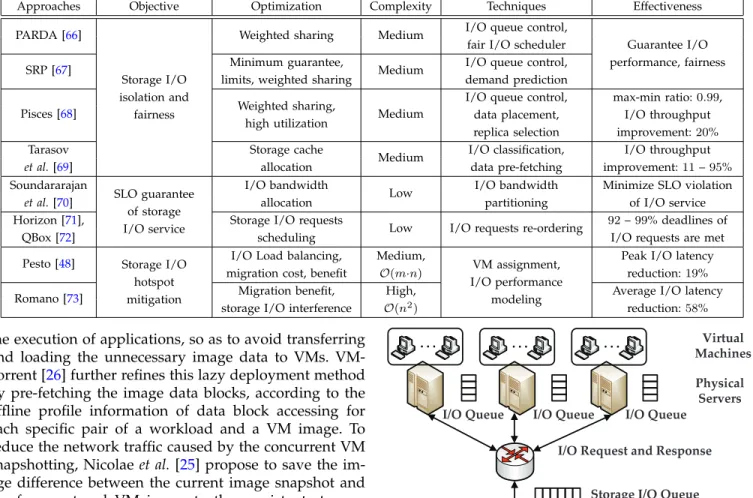
4.2.2 Contention of Multiple VMs on Shared Storage Resources
Different from the disk I/O sharing among co-located VMs on a single physical server discussed in Sec. 4.1, shared cloud storage service deploys an entire storage system, such as Network Attach Storage (NAS) and Storage Area Network (SAN), to support I/O requests from multiple VMs hosted on multiple physical servers, as illustrated in Fig.5. To isolate the storage I/O resource among multiple VMs, the straightforward approach is to well manage and schedule the requests in I/O queues on each physical server and shared storage system. For example, PARDA [66] first controls the length of I/O queue on each physical server based on the aggregated weights of the hosted VMs. Then, this method uses a local fair I/O scheduler to achieve proportional-share fairness of storage I/O resource among co-located VMs within each physical server.
In addition to the proportional share of storage I/O resource, SRP [67] further provides several other storage resource controls, such as the minimum guarantee and limits of storage I/O bandwidth for an individual VM or a group of VMs. In particular, the I/O reservations, limits, and proportional shares of I/O queue capacity for each VM and physical server can be determined by periodically predicting the workload demands. With
Shared Storage Physical Servers Virtual Machines
I/O Request and Response I/O Queue I/O Queue I/O Queue
Storage I/O Queue
Fig. 5: Typical shared storage architecture in the datacenter.
a particular focus on the replicated key-value shared storage, Pisces [68] deploys a series of novel mecha-nisms to achieve the performance isolation and max-min fairness among tenants (rather than VMs). Specifically, these mechanisms includes placing and replicating the data blocks across multiple storage devices based on the weights of tenants, as well as scheduling VM I/O requests to storage devices using the Deficit (Weighted) Round Robin algorithm. To alleviate the interference on the shared cache of storage arrays among VMs, Tarasov
et al.[69] fairly allocate the storage cache space according to the classification of VM I/O operations and data. The data prefetching in the storage cache is further applied to improve the I/O throughput of shared storage.
While the former approaches provide the isolation on sharing storage I/O resource among multiple VMs or tenants, they cannot guarantee the SLO of VM applica-tions, such as the latency and throughput of storage I/O service, due to the storage I/O contention. To achieve this goal, Soundararajanet al.[70] first translate the SLO into the storage I/O allocation by a reinforcement learn-ing algorithm. Then, this method dynamically partitions the I/O bandwidth based on the translated storage I/O
allocation using I/O schedulers on physical servers and shared storage. Two SLO-oriented storage I/O schedul-ing approaches have been proposed in [71], [72], where the high-level SLO of VM application is translated into a series of deadlines for application I/O requests based on the historical I/O statistics. These I/O requests can be completed before their specific translated deadlines, by re-ordering them in the storage I/O queue using the Early Deadline First (EDF) scheduling algorithm.
To mitigate the disk I/O contention in the cloud storage, another practical approach is to leverage the live migration of virtual disks with heavy I/O requests. For example, Pesto [48] first constructs an empirical linear model of latency and throughput of I/O requests in the shared storage. Then, such a model is leveraged to perform I/O load balancing with a cost-benefit analy-sis for all migration choices of virtual disks, so as to alleviate the I/O performance variation, i.e.,Eq. (2). As compared with the former method, a more accurate I/O performance model has been developed in [73], which uses statistical modeling approaches (i.e.,the analysis of variance and linear regression) and takes the interference of co-located virtual disks into account. Based on such a model, Romano [73] designs an algorithm to find the global pseudo-optimal mapping of VMs to physical servers using the simulated annealing approach, to re-duce the variation of storage I/O latency in datacenters.
4.2.3 Contention of Multiple VMs on Shared Network Resources
Currently, several commercial cloud providers (e.g.,
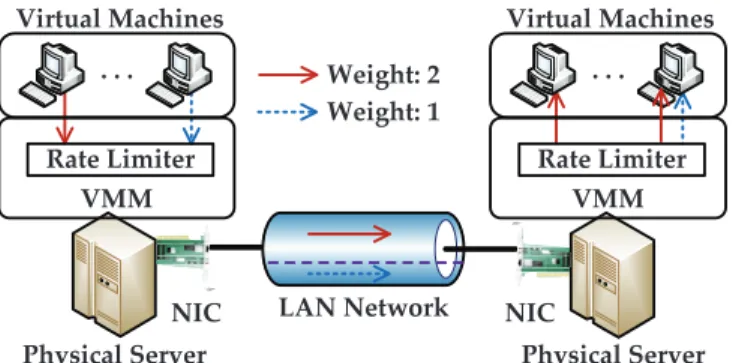
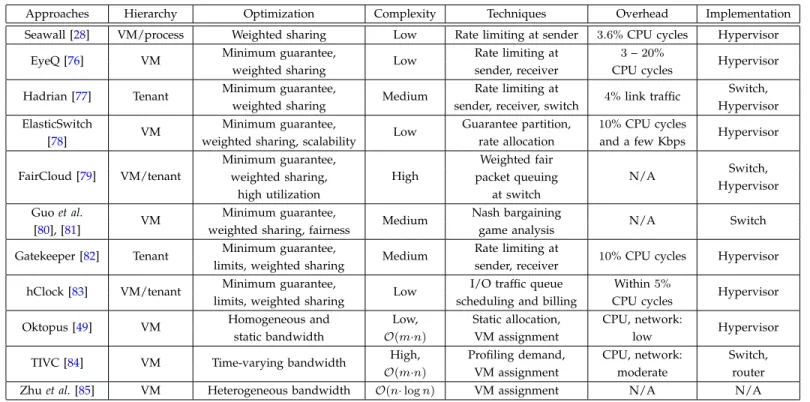
Amazon EC2 [2]) cannot provide the performance guar-antee of network resource for tenants (or VMs). As discussed in Sec.2.2, the network bandwidth and latency between two VMs can vary significantly over time. Fortunately, the issue of network performance isolation among tenant VMs in an IaaS cloud datacenter has been extensively studied by recent research, which can be broadly classified into two categories: weighted compe-tition sharing and VM assignment based sharing.
Weighted Competition Sharing Approach. The weighted competition approach is to share the network resource among competing entities (i.e., processes, VMs or tenants) according to their weights, as illustrated in Fig. 6. In particular, the weights of entities can be assigned by cloud providers [81] or according to minimum bandwidth guarantees [76] and tenant pay-ments [77]. A typical example of this approach has been proposed in Seawall [28], where the network bandwidth on the contention links is fairly allocated among multi-ple data senders using a VMM-based rate limiter (e.g.,
NicPic [54]) according to their assigned weights. How-ever, this approach fails to offer minimum bandwidth guarantees to VMs or tenants.
To support minimum guarantees of network band-width and share the network resource among VMs in a fine-grained timescale (i.e.,milliseconds), EyeQ [76] pro-poses an end-to-end rate control mechanism along the
. . . Virtual Machines Physical Server VMM LAN Network Rate Limiter . . . Virtual Machines Physical Server VMM Rate Limiter NIC NIC Weight: 2 Weight: 1
Fig. 6: Network bandwidth sharing among VMs according to their respective weights.
data transmission path, by implementing rate limiters on the data sender and congestion detectors on the data receiver, respectively. This approach also achieves high utilization of the cloud network resource. To particularly provide bandwidth guarantees for inter-tenant com-munication, Hadrian [77] allocates the network band-width to inter-tenant flows using the rate limiters on data senders, receivers and weighted fair queueing in switches. As this approach requires traffic shaping (e.g.,
vShape [86]) in network switches, the implementation complexity is increased accordingly. ElasticSwitch [78] allocates the pairwise VM-to-VM bandwidth based on the network bandwidth guarantees of VMs, and dis-tributes the unused bandwidth to VMs according to their weights. To reduce the implementation overhead and im-prove the scalability, this approach is fully implemented in Hypervisors and without centralized coordination.
By proposing and comparing three bandwidth alloca-tion policies: Proporalloca-tional Sharing at the Link level (PS-L), at the Network level (PS-N), and on the Proximate link (PS-P), FairCloud [79] experimentally explores the tradeoff space among three requirements for weighted bandwidth sharing of datacenter networks, including minimum guarantee, network proportionality, and high utilization. Specifically, the minimum guarantee and net-work proportionality cannot be achieved simultaneously (i.e., hard tradeoff), and there exists a tradeoff between the network proportionality and high utilization. To obtain a theoretical insight into the tradeoff between minimum guarantee and proportional bandwidth share, Guo et al. [80], [81] model the bandwidth allocation as a Nash bargaining game [87], and design a distributed algorithm named Falloc to fairly allocate bandwidth to VMs in a cooperative manner.
In addition to achieving the weighted sharing and minimum guarantees of VM network bandwidth, two approaches [82], [83] further provide another Quality of Service (QoS) control for VM bandwidth allocation,i.e.,
limits of VM bandwidth. Specifically, Gatekeeper [82] guarantees the network bandwidth of VMs by imple-menting a weighted packet scheduler on data senders, and determining the bandwidth allocation according to the minimum and maximum rates on data receivers. In particular, this method focuses on guaranteeing the aggregate end-to-end network bandwidth of VMs for
TABLE 7: Comparison of Approaches to Mitigate Contention of VMs on Shared Network Resource of a Single Datacenter
Approaches Hierarchy Optimization Complexity Techniques Overhead Implementation Seawall [28] VM/process Weighted sharing Low Rate limiting at sender 3.6% CPU cycles Hypervisor
EyeQ [76] VM Minimum guarantee, Low Rate limiting at 3–20% Hypervisor weighted sharing sender, receiver CPU cycles
Hadrian [77] Tenant Minimum guarantee, Medium Rate limiting at 4% link traffic Switch, weighted sharing sender, receiver, switch Hypervisor ElasticSwitch
VM Minimum guarantee, Low Guarantee partition, 10% CPU cycles Hypervisor [78] weighted sharing, scalability rate allocation and a few Kbps
FairCloud [79] VM/tenant Minimum guarantee, High Weighted fair N/A Switch, Hypervisor weighted sharing, packet queuing
high utilization at switch
Guoet al.
VM Minimum guarantee, Medium Nash bargaining N/A Switch
[80], [81] weighted sharing, fairness game analysis
Gatekeeper [82] Tenant Minimum guarantee, Medium Rate limiting at 10% CPU cycles Hypervisor limits, weighted sharing sender, receiver
hClock [83] VM/tenant Minimum guarantee, Low I/O traffic queue Within5% Hypervisor limits, weighted sharing scheduling and billing CPU cycles
Oktopus [49] VM Homogeneous and Low, Static allocation, CPU, network: Hypervisor static bandwidth O(m·n) VM assignment low
TIVC [84] VM Time-varying bandwidth High, Profiling demand, CPU, network: Switch,
O(m·n) VM assignment moderate router
Zhuet al.[85] VM Heterogeneous bandwidth O(n·logn) VM assignment N/A N/A
tenants in datacenters. hClock [83] allocates VM band-width in a hierarchical manner through maintaining and scheduling I/O requests in the leaf queue of VMs. In more detail, the requests are scheduled by periodically checking the minimum guarantees, limits and weights of VMs, and the scheduling of I/O requests is started at the root node of the leaf queue in the hierarchy.
VM Assignment Based Sharing Approach. In re-spond to the VM leasing request from tenants, the VM assignment based approach allocates the network resource to tenant VMs and meets their bandwidth requirements, by assigning these VMs to an appropri-ate network location (physical server). A representa-tive example of this approach has been presented in Oktopus [49], where the VM leasing request is simply abstracted to a tuple hN, Bi(i.e., the number of VMsN with a homogenous network bandwidth B). According to the network abstractions of VM leasing requests, the network resource is statically allocated to tenant VMs, by greedily assigning these VMs to the smallest sub-tree (i.e., a server, a rack, a pod) that can host them.
To break the assumption of static and homogeneous network bandwidth B of the VM leasing request, two approaches [84], [85] extend the basic network abstrac-tion model hN, Bi to more realistic models, where ten-ants are allowed to specify time-varying (i.e., temporal) and heterogeneous (i.e., spatial) allocations of network bandwidth for their leased VMs, respectively. The ob-jective of VM allocations in these two approaches is to improve the utilization of network resource, so as to allocate more tenant VMs in a datacenter. Specifically, by profiling the network bandwidth demands offline for each VM application, TIVC [84] fits the leased VMs into four types of network abstractions with the time-varying
bandwidth. According to the fitted abstraction models of these VMs, this method then assigns them to the datacenter by a first-fit VM assignment algorithm. Zhu
et al.[85] propose an abstraction model of heterogeneous VM network bandwidth allocations, and mathematically prove the problem of VM allocations with heterogeneous bandwidth demands to be NP-complete. In addition, an online heuristic VM assignment algorithm is developed to allocate the leased VMs with heterogeneous band-width demands from multiple tenants in a datacenter. 4.3 Controlling VM Performance Overhead across Multiple Geo-distributed Datacenters
The live migration of VMs or storage over the WAN is a common tool to manage computing resources of multiple geo-distributed datacenters (e.g.,load balancing among datacenters and disaster recovery of IT systems). However, it brings noticeable performance overhead of VMs in IaaS clouds, as we have discussed in Sec. 2.3. In this subsection, we review and compare the solutions that alleviate the performance overhead of VMs caused by the live WAN migration in Table8.
WAN SAN LAN SAN LAN VM state migration VM disk migration
Fig. 7: Live WAN migration of a single VM across multiple geo-distributed datacenters.