Suprihati IJSRE Volume 05 Issue 04 April 2017 Page 6346
Volume||5||Issue||04||April-2017||Pages-6346-6356||ISSN(e):2321-7545 Website: http://ijsae.in Index Copernicus Value- 56.65 DOI: http://dx.doi.org/10.18535/ijsre/v5i04.07
Effect of Asia-Pacific Stock Index And Exchange Rate Movements on Stock Price
Index in Indonesia Stock Exchange
Author
Suprihati
STIE AAS Surakarta
Email : [email protected] ABSTRACT
This research has aimed to illustrate the effect of Stock Market Index Asia Pacific (Kospi, Taiex, HSI, Nikkei) and the exchange rate against Indonesia stock exchange either partially or simultaneously on the Indonesia Stock Exchange. The sample used in this study is the Stock Market Index Asia Pacific and the exchange rate, sample consisted 430 samples. The analyses used in this study were multiple linear regressions. Partially share price index Kospi Asia Pacific market and HSI affect the Indonesia stock exchange while the Taiex and Nikkie no effect influence on Indonesia stock exchange. The rupiah exchange rate has no effect on Indonesia stock exchange. Simultaneously stock market price index of Asia Pacific (Kospi, Taiex, HSI and Nikkie) as well as the exchange rate together affects the IHS in Indonesia stock exchange.
Key Words : Kospi, Taiex, HSI, Nikkei, Exchange Rate, Composite Stock Price Index
INTRODUCTIONS
The development of the global economy is currently dominated by the role of the capital market. Globalization has allowed the relationship interrelated and influence each other from almost all capital markets in the world. The facts show that every capital market in the world has a network connected online trading shares quotations built by the company trading services such as Bloomberg. The development of the information systems world, especially the application of information technology has also had a progression process of globalization of stock trading. The development and application of information technology such as this, the dissemination of information, capital markets have become more sophisticated and equitable to investors worldwide. In a country's economy, the capital markets have an important role for capital markets work in two ways: first as a means for financing the business and as a means for companies to obtain funds from investors. The funds obtained from the capital market can be used for business development, expansion and additional public capital can put its own funds in accordance with the characteristics of the benefits and risks of each instrument in the capital market. Facts show that the capital market is one indication of the economic development of a country that signaled the importance of the capital market in a country. Capital market of Indonesia through the Indonesian stock exchange is an integral part of the activities of global stock markets. Results of research Durand (2001) market indices, interest rates (short and long term) and the spot exchange rate relation to the seven Pacific marketRim (Australia, Hong Kong, South Korea, Malaysia, Singapore, Taiwan and Thailand)tarperubahaban facing the US and Japanese financial variables. Found there is the influence of the seventh (Australia, Hong Kong, South Korea, Malaysia, Singapore, Taiwan and Thailand) the stock market affect the US stock market and the Japanese stock market is affected half of the seventh of the stock market.
Suprihati IJSRE Volume 05 Issue 04 April 2017 Page 6347
significant effect on Composite Stock Price Index From description, need to be analyzed the influence of the stock market price index of Asia Pacific stocks (Kospi, Taiex, HSI, Nikkei) and the exchange rate against Composite Stock Price Index in BEI. The formulation problem in this study is whether the stock price index stock exchange Asia Pacific countriesn (Korea, Taiwan, Hongkong, Japan) affects Composite Stock Price Index on the Indonesia Stock Exchange? And What is exchange rate affect the Composite Stock Price Index on the Indonesia Stock Exchange?. While the purpose of this study is to determine the effect of the stock market share price index of Asia-Pacific countries (Korea, Taiwan, Hongkong, Japan) to Composite Stock Price Index on the Indonesia Stock Exchange. And to determine the effect of the rupiah against Composite Stock Price Index on the Indonesia Stock Exchange.
THEORETICAL FRAMEWORK AND REVIEW OF LITERATURE
According to Samuelson and William (1994) is the investment expenditure made by investors concerning the use of resources such as equipment, buildings, production equipment and new machineslain's or inventories that are expected to benefit from the investment.
Investment process explains how should an investor invest in securities with making decisions regarding the types of securities that will be selected, how much and when the investment would be carried out. According Husnan (1996), there are five steps that underlie decision-making in investment, which was to determine the investment policy, securities analysis, portfolio formation, the revision of the portfolio, and portfolio performance evaluation.
Suprihati IJSRE Volume 05 Issue 04 April 2017 Page 6348
Based on these definitions it is clear that the capital marketis the place to bring together sellers and buyers to trade in a fund made up of various financial instruments (or securities) with a maturity of more than one year in the form of official institutions, namely the stock exchange.Types of StocksAccording Siamat (2005) and Jogiyanto (2007) ordinary shares can be divided into various types, among others:Superior stocks (blue chips), the shares issued by major companies and well-known longer to show its ability to gain profits and payment of dividends.Growth stocks are stocks issued by companies that are good sales, the acquisition of their profits, and market share is progressing faster than the industry average. Emerging growth stocksthey are stocks issued by companies that are relatively small and have strong endurance despite the unfavorable economic conditions.Income stocksthey are stocks that pay dividends more than the amount of the average income.bCyclical stocks they are stocks of companies whose profits fluctuate widely. Defensive stocks they are stocks that the company can survive and remainstabil of a period or uncertainty, and recession.
Securities or stock exchange is an organized system that brings together sellers and buyers of securities is done either directly or through their representatives. The function of the stock exchange, among others, maintain market community and create effects of price reasonable through the mechanism of demand and supply (Siamat 2005) In order activity emissions and transactions on the stock exchange can be fast, efficient and trustworthy it is necessary role of institutions supporting capital markets.
This will be explained participated index of each country that will be the object of research: Composite Stock Price Index Escort .Composite Stock Price Index is a depiction of the overall state of the stock price at the price of a stock for a certain time compared to the overall stock price at different times so that it can be seen tendency of increase or decrease.
Hang Seng Index (HSI) is a stock market index by capitalization in the Hong Kong Stock Exchange. This index is used to record and monitor daily changes of the largest companies in the Hong Kong stock market and as a leading indicator of market performance in Hong Kong. All 34 companies representing 65% of market capitalization in this exchange.
HSI began on 24 November 1969 are summarized and maintained by HSI Services Limited, which is a full subsidiary of Hang Seng Bank, the second largest bank in Hong Kong by market capitalization. The company is responsible to create, publish, and set the Hang Seng Index and several other stock indexes, such as the Hang Seng Composite Index calculations using a sample of all shares listed on the Taiwan Stock Exchange using the weighted value. The index base year is 1966. HSI is Hang Seng Index This is an index which recorded a market capitalization stock index in Hong Kong. The Hang Seng Index is a leading indicator of overall market performance in Hong Kong. HSI consists of 45 companies listed in the Stock Exchange of Hong Kong where the Hang Seng alone represents about 67% of the market capitalization of all companies listed on the stock exchange of Hong Kong. Starting on November 24th 1969 being managed by HSI Services Limited, which is a subsidiary owned by Hang Seng Bank, the largest bank listed in Hong Kong in terms of market capitalization (Wikipedia,2016)
Taiwan Index (Taiex), is a stock market index for companies traded on the Taiwan Stock Exchange (TWSE). TAIEX covers all of the listed stocks excluding preferred stocks, full-delivery stocks and newly listed stocks, which are listed for less than one calendar month. It was first published in 1967 by TWSE with 1966. (Wikipidia 2016)
Suprihati IJSRE Volume 05 Issue 04 April 2017 Page 6349
the Composite Stock Price Index . H2: Taiwan stock index (Taiex) affect the movement of the Composite Stock Price Index (CSPI). H3: The Hang Seng Index (Hang Seng) affect the movement of the Composite Stock Price Index (CSPI).H4: Japan Stock Index (Nikkei 225) affect the movement of the Composite Stock Price Index (CSPI).H5:Exchange rate rupiah affect the movement of the Composite Stock Price Index (CSPI).
The sample in this study include Korea Composite Stock Price Index (Kospi) represents the Korean Stock Exchange, Taiex represents the Taiwan Stock Exchange, Hangseng in this case the Hang Seng Index Stock (HSI), which represents Hong Kong shares, the Nikkei 225 which represents the Japanese stock market, the exchange rate of the rupiah against the dollar represents the exchange rate and Jakarta Stack Excahange representing the Composite Stock Price Index . The samples in this study to determine the level of significance of the influence of the independent variable on the dependent variable.
The target population of this research is the daily share price index of Asia Pacific Regional Committee member who is the organization of the Capital Market Authority of Asia Pacific Region consists of 19 countries. With a sample of 4 countries and the exchange rate against the US dollar after the subprime mortagage daily to avoid anomalies that since January 5th, 2015 until November 30th, 2016. Sampling historical data used in this study using purposive sampling. Criteria for selectionsampel is the price of stock index closing time until the first day of trading with the stock price at closing time each day until the thirtieth day as 430day which is expected to represent the population. Variable Composite Stock Price Index (CSPI)., Kospi index Taiex index, Nikkei index the exchange rate at downloaded from Yahoo finance wibesite of January 5th 2015 to November 2016. The stock price index stock markets Asia-Pacific countries that have working hours almost simultaneously with the Indonesia Stock Exchange and has exis comprising Kospi represent the Korea Stock Exchange, representing Taiex Taiwan stock exchange, HSI representing the Hong Kong stock exchange and Nikkei 225 Japanese stock market. and the exchange rate of against the dollar selling daily taken down loaded from the website of Bank Indonesia, exchange rate and stock index taken on the same date.
The author in this study using secondary data. Secondary data is data that has been published for public consumption or unpublished obtained from third parties. Secondary data were used as material in this study as data taken from research-studies that have been done before, scientific journals, as well as the published literature on a freelance basis, either in the form of reference books, magazine articles, and Internet sites that are relevant, as well as through the selection process according to the quality and compliance with the study. Analysis model used in this research is multiple linear regression. Model of multiple linear regression analysis is used to determine the influence of the Asia-Pacific stock index and exchange rate against Composite Stock Price Index (CSPI) simultaneously or partial.
Calculation accuracy and reduce human error this study did not do it manually but by using a computer program to process statistical data, the program SPSS version 20.0. SPSS well as to obtain accurate and precise results, also with fast data processing.
Interest normality test is to determine the regression model, the dependent variable, independent variable or both normal distribution or not. A good model is a model that is defined by variables that have or approximately normally distributed.
Normality test is done by using test-Smirnor Kolmoggorov by comparing the probability value (p-value) obtained with a significance level that has been determined is 0.05mbasis for decision making in the normality test is as follows:If the probability value (p-value) of each independent variable is greater than 0.05 then the normal distribution of data.If the indigo probability (p-value) of each independent variable over ketch than 0.05 then the data are not normally distributed.
Suprihati IJSRE Volume 05 Issue 04 April 2017 Page 6350
situation where one or more independent variables correlationwith other independent variables, or in other words an independent variable is a linear function of other independent variables. Multikolinearitas their standard errors tend to cause greater with increasing degree of correlation between variables and standard error becomes very sensitive to changes in the data. Consequently their multikolinearitas is estimate will be affiliated causing in the specification.
Mulitikolinearitas can be seen from Toleranci Value (TV) or variance Inflation Factor (VIF). Tolerance Value is a number that indicates that the independent variable can not be explained by other independent variables in a regression equation. Or we can say Tolerance Value is a value that indicates the absence of multicollinearity in the regression equation. Limit of Tolerance Value is 10, if the Tolerance Value under 10 then there multikolinearitas.
While Variance Inflation Factor (VIF) is the opposite of Tolerance value, because VIF = 1 / VIF. VIF is a number that indicates that an independent variable can be explained by other independent variables in the regression equation. VIF limit is 10, if VIF above 10 then it occurred multikolinearitas.
Run test used to detect autocorrelation. Run test section of non-parametric statistics can be used to test whether there is a correlation between high residual. If there is no relationship between the residual correlation it is said that the residuals are random or random. Runs test was used to see if the data residual occur randomly or not (systematically) (Ghozali, 2006). H0: residual (res_1) random (random), and HA: residual (res_1) are not random.
In the style oft analysis used is Multiple Regression Analysis (Ghozali ,2006), which is formulated as follows:
IHSGt -IHSGt-1 = a + b1 (Kospi1t - Kospi1t-1) + b2 (Taix2t - Taiex2t-1)
+ b3 (HSI3t - HSI3t-1) + b4 (Nikkei4t - Nikkei3t-1) + b5 (Exchange5t - Exchange 5t-1) + vt. In this study, the value of t is used to determine the significance of the partial effect of each independent variable on the dependent variable. If the probability value(p-value) < 0.05 then H0 means that there is significant influence partially a ntara independent variable on the dependent variable, and vice versa if the value probabilias (p-value) > 0.05 then H0 is accepted to mean there is no significant effect partially between the independent variable on the dependent variable.If the probability value (p-value) < 0.05 then H0 means that there is significant influence partially between the independent variable on the dependent variable and vice versa if the value probailitas ( p value ) > 0.05 then H0 means that there are no significant influence jointly between the independent variable on the dependent variable.
RESULT
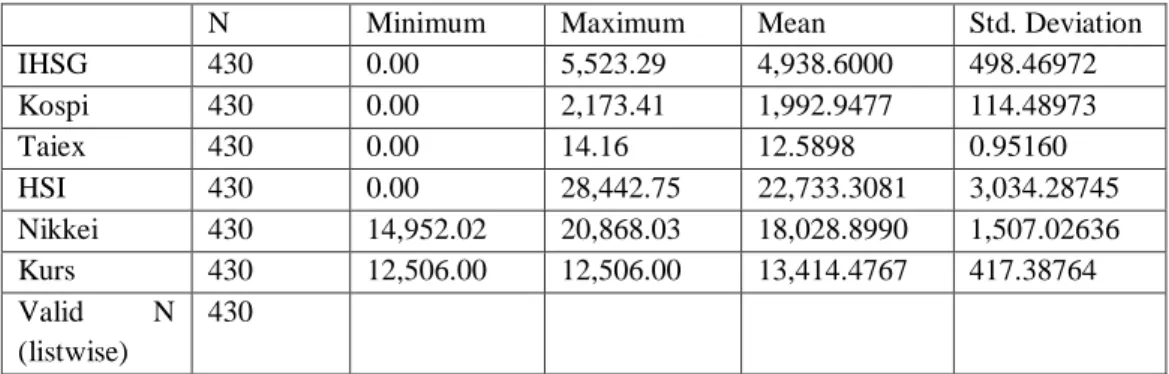
Descriptive statistics for each dependent and independent variables analyzed are presented in Table 4.1. The dependent variable is Composite Stock Price Index . nd the independent variables used in this analysis as much as 5 (five) variables with each of the Kospi, Taiex, HSI, Nikkei, Exchange Rate. The results listed in Table 4.1 as follows:
Table 4.1 Statistics Descriptive
N Minimum Maximum Mean Std. Deviation
IHSG 430 0.00 5,523.29 4,938.6000 498.46972
Kospi 430 0.00 2,173.41 1,992.9477 114.48973
Taiex 430 0.00 14.16 12.5898 0.95160
HSI 430 0.00 28,442.75 22,733.3081 3,034.28745
Nikkei 430 14,952.02 20,868.03 18,028.8990 1,507.02636
Kurs 430 12,506.00 12,506.00 13,414.4767 417.38764
Valid N
(listwise)
430
Suprihati IJSRE Volume 05 Issue 04 April 2017 Page 6351
Kospi is Korea stock price index in the period of daily 5th January 2015 until 30th November 2016 the magnitude of the average value of 1992.95 Kospi stock index Kospi stock index value is high of 2.173.41 with the lowest Kospi stock index 0.00 with a standard deviation of the average Kospi stock index amounted to 114.49.
Taiex is a Taiwan stock price index in the period 5th January2015 until30th November 2016 the amount of
the average value of 12.59 Taiex stock index value Taiex stock index highs of 14.16 to lows Taiex share index 0.00 with a standard deviation of average Taiex stock index of 0.95
Hangseng Index is Korea stock price index in the period 5thJanuary 2015 until 30thNovember 2016 the amount of the average value of the Hang Seng stock index at 22733.31. Hang Seng stock index values high of 28442.75 with the Hang Seng stock index lows 0:00 with a standard deviation of the average of the Hang Seng stock index at 3034.29
Nikkei is Korea stock price index in the period of 5thJanuary 2015 until 30thNovember 2016 the magnitude
of the average value of the Nikkei stock index at 18028.90, the highest Nikkei stock index value of 642.38 with the Nikkei stock index with the lowest standard deviation 14952.02 Average Nikkei stock index at 1507.03.
Exchange rate of rupiah against dollar. Based on Table 4.1 shows that the exchange rate against the dollar in the period 5thJanuary 2015 until 30thNovember 2016with an average exchange rate of Rp 13414.48, the highest rate of Rp 14.783.00 and the lowest published rate of Rp 12506.00 with a standard deviation of the mean average exchange rate of Rp 417.399
Composite Stock Price Index is BEI stock price index in the period 5thJanuary 2015 until 30thNovember 2016 the value of the average stock index at 4938.60 Value Composite Stock Price Index . Composite Stock Price Index stock index highs of 5523.29 with the lowest stock index Composite Stock Price Index 0.00 with a standard deviation of average -rata Composite Stock Price Index stock index of 498.47.
According Ghozali Gujarati (2011) to generate an accurate data analysis, a regression equation should be free from classical assumptions that must be met, including normality test, multicollinearity, autocorrelation and heteroskedasitas.
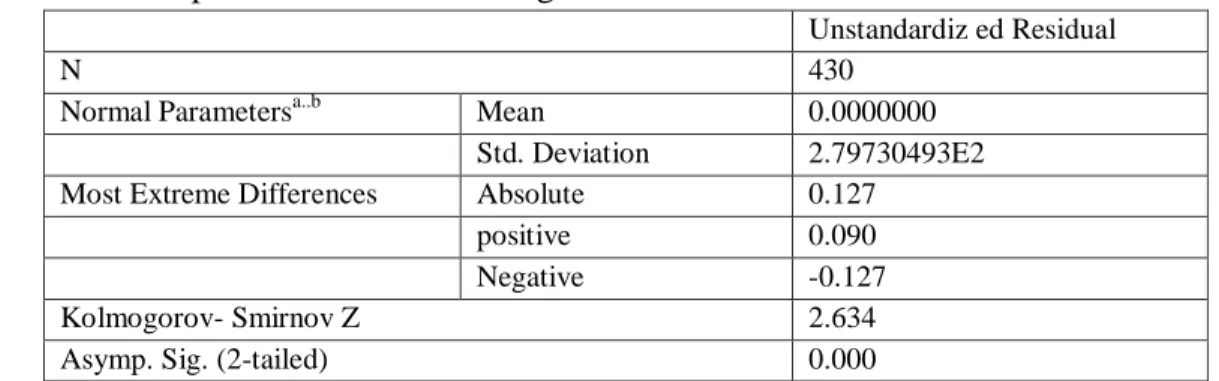
Normality test aims to test whether the regression model, the dependent variable and the independent variables both have distribution normali or not. A good regression model is to have a data distribution normal or nearly normal. Normality test aims to see whether the regression model, or residual confounding variables normal distribution. For that test one sample Kolmogorov-Smirnov Test. The test results presented in Table 4.2 below:
Table 4. One-Sample Test Results Kolmogorov-Smirnov Test
Unstandardiz ed Residual
N 430
Normal Parametersa..b Mean 0.0000000
Std. Deviation 2.79730493E2
Most Extreme Differences Absolute 0.127
positive 0.090
Negative -0.127
Kolmogorov- Smirnov Z 2.634
Asymp. Sig. (2-tailed) 0.000
Source : Secondary data were processed
Test results seen in the seemingly Tabel 4.2 the value of Kolmogorov-Smirnov was significant in 2634 and 0.000. This means that H0 accepted, which means the data residual normal distribution.
Suprihati IJSRE Volume 05 Issue 04 April 2017 Page 6352
presence of multicollinearity is to look on; First, the value of tolerance and its opponent. Second, the variance inflation factor (VIF) ie if the tolerance value is not less than 0.1 and VIF no more than 10 then the model can be said to be free from multicollinearity. Based on the results SPSS processing on the data obtained, it can be seen in Table 4.3 below:
Table 4.3 Test Results Multicollinearity
Model Collinearity Statistics
Tolerance VIF
(constant)
Kospi 0.625 1.601
Taiex 0.447 2.236
HSI 0.348 2.871
Nikkei 0.344 2.910
Kurs 0.706 1.416
Source : Secondary data were processed
Table 4.3 can be seen that the VIF value for each variable is less than 10 and not less than 0.1 Tolerance. This proves that the regression model used in this study there are no symptoms multikolinearitas (homoskedasitas).
Autocorrelation was detected using the test Test Run. According Ghozali (2011) Run the test as part of a non-parametric statistics may be used to test whether there is a correlation between high residual. If there is a correlation between residual it is said that the residuals are random or random. Run a test used to see whether the data residual occur randomly or not (systematically). H0; residual (rse_1) random (random), andHa; residual (res_1) are not random.SPSS processing results on the data obtained, it can be seen in Table 4.4 below:
Table 4.4 Test Results Run Test
Unstandardiz ed Residual
Test Valuea 8.64311
Cases < Test Value 215
Cases >= Test Value 215
Total Cses 430
Number Runs 54
Z -15.643
Asymp. Sig. (2-tailed) 0.000
Source : Secondary data were processed
Autocorrelation in Table 4.4 value is 8.64 with a probability test 0.00tidak significant at 0.05 which means that the null hypothesis is accepted, so it can be concluded that the residual random or not autocorrelation between residual value.
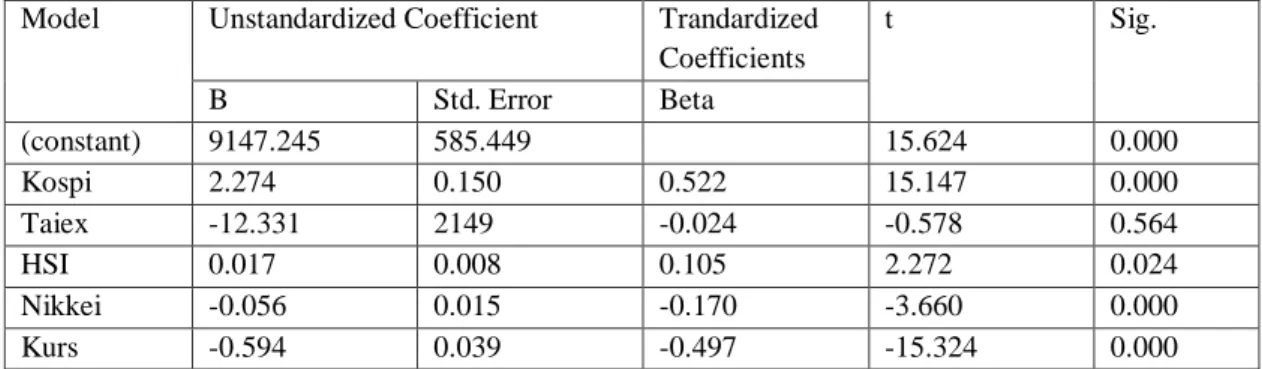
Partially variables that have a significant effect, namely Kospi, Taiex, HSI, Nikkei and Exchange. It can be seen from the test results of the t test variables can be seen in Table 4.5 below:
Table 4.5 t Test
Model Unstandardized Coefficient Trandardized
Coefficients
t Sig.
B Std. Error Beta
(constant) 9147.245 585.449 15.624 0.000
Kospi 2.274 0.150 0.522 15.147 0.000
Taiex -12.331 2149 -0.024 -0.578 0.564
HSI 0.017 0.008 0.105 2.272 0.024
Nikkei -0.056 0.015 -0.170 -3.660 0.000
Kurs -0.594 0.039 -0.497 -15.324 0.000
Suprihati IJSRE Volume 05 Issue 04 April 2017 Page 6353
Variable Kospi ttest 15.15 while ttable at 95% confidence level is 1.960 (15.15 > 1.960). Because ttest > ttable
then H0 is rejected. Thus the reception area is outside the reception area hypothesis H0. Variable Taiex ttest
-0.58 while ttable at 95% confidence level is – 1.960 (-0.58 > -1.960). If ttest< ttable then H0 is accepted. Thus
the reception area in denial of the hypothesis H0.Variable HSI ttest 2.27 while solid ttable 95% confidence
level is 1.960 (2.27 > 1.960). Because ttest> ttable then H0 is rejected. Thus the reception area is outside the
reception area hypothesis H0.Variable Nikkei ttest 3.01 while ttable at 95% confidence level is 1.960 (- 3.66 < -
1.960). because ttest> ttable then H0 is rejected. Thus the reception area is outside the reception area
hypothesis H0.Variable Exchange ttest -15.32 while ttable at 95% confidence level is 1.960 (-15.32 < -1.960).
because ttest> ttable. Then H0 is rejected. Thus the reception area is outside the reception area hypothesis H0.
From coefficient table then the regression model can be established.Composite Stock Price Index = 9,147.25 + 2,274 Kospi - 12.331Taiex + 0.017 HSI - 0.056Nikkei - 0.594Exchange Rate. Constant value of 9,147.25 means that if the value of, Kospi, Taiex, HSI, Nikkei and Exchange zero, then the value of at 9,147.25. Coefficient Kospi regression of 2.27 means that if the value of Kospi rose 1 point, the Composite Stock Price Index will rise by 2.27 points. The regression coefficient of - 12.33 Taiex means if the value Taiex rose 1 point, the Composite Stock Price Index will fall by 12.33 points. Composite Stock Price Index regression coefficient of 0.017 means that if the value HSIan increase of 1 point, the Composite Stock Price Index will rise by 0.017 points. The regression coefficient of the Nikkei – 0.056 means that if the value of the Nikkei rose 1 point, the Composite Stock Price Index will drop by 0.056 points. The regression coefficient of Exchange rate 0.594 means that if the value increased by 1 point, the Composite Stock Price Index will drop by 0.594 points.
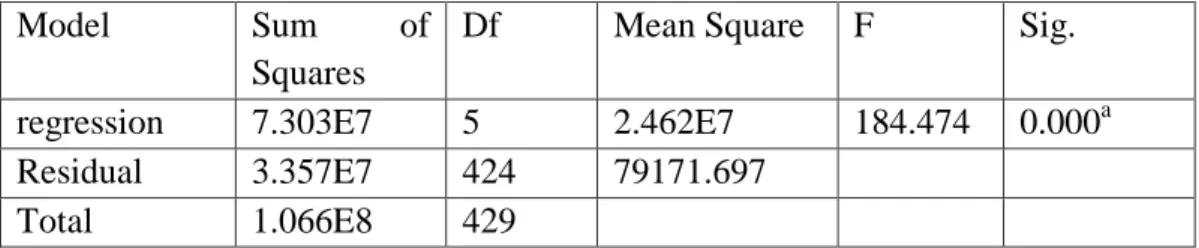
From the test results of the F test the hypothesis that the stock market stock index of Asia Pacific countries (Kospi, Taiex, HSI and Nikkei) and the exchange rate significantly affect the Composite Stock Price Index movement simultaneously. Fisher (F Test) with a level of confidence (confident level) by 95%. Testing criteria to be used if Ftes > Ftable then H0 is rejected and if Ftes ≤ Ftable H0 acceptable. Above it is based on an
overview of the test contained in Table 4.6 below:
Table 4.6 F Test
Model Sum of
Squares
Df Mean Square F Sig.
regression 7.303E7 5 2.462E7 184.474 0.000a
Residual 3.357E7 424 79171.697
Total 1.066E8 429
Source : Secondary data were processed
Table 4.6 shows that the value of F 184 474 with a significant level of 0.000. Average Ftable at the 95% level (α = 0.05) is 2.25, Therefore in both the calculation of Ftes > Ftable (184.47 > 2.25). This shows that the
influence of the independent variable stock price index stock exchange Asia Pacific countries (Kospi, Taiex, HSI and Nikkei) and the exchange rate effect on either simultaneously Composite Stock Price Index acceptable overall.
Goodness of fit testing is done to determine the feasibility of a regression model, because the variables more than two variables, the feasibility can be seen from the value of Adjusted R Square. Adjusted R Square use values obtained from the data processing results can be seen in table 4.7 bellow:
Table 4.7 Table Test Coefficient of Determination
Model R R Square Adjusted R
Square
Std. Error of the Estimate
1 0.828a 0.685 0.681 281.37501
Suprihati IJSRE Volume 05 Issue 04 April 2017 Page 6354
Adjusted R Square use values in Table 4.6 above by 0.68. It is addressing that 68% of Composite Stock Price Index variables can be explained by the stock index of Asia Pacific countries (Korea, Taiwan, Hong Kong and Japan) and the exchange rate. The remaining 32% by other variables that are not described in this study.
DISCUSSION
Analisis against Kospi significant effect on HSG. The results of the study in line with research Mansur (2005) and Hasibuan (2009) and Maulino (2009). With the regression coefficient Kospi at 2,274 gives the sense that the Kospi variable changes by 1 point will give the effect of rising stock index of 2,274 points. This shows that the increase in the index in Korea a good result against Indonesia, it also means that the trend of foreign investors especially from Singapore to Indonesia Stock Exchange also affect the movement of a special index of Singapore to the Indonesian market also affected. Thus it appears that the effect of the increase in the Singapore stock exchange is beneficial to the Indonesian stock exchange. Analysis on the significant effect on the Hang Seng Composite Index. The results of this study are consistent research Mansur (2005), Maulino (2009) and contrary to the findings of research Darmawan (2009).
Analisis the Taiex index was not significant. The results of the present study is in line with research findings Hasibuan (2009). And contrary to the findings of research Mansur (2005) for different time periods from 2000 to 2002 with a sample of monthly stock price index. Taiex with a regression coefficient of-12.331gives the sense that the Taiex variable changes by 1 point will impact change Composite Stock Price Index by 12.331 points in the opposite direction, this means that when the Taiex index rose by 1 point the composite index will fall 12.331 points. This means Taiex index did not significantly affect the Composite Stock Price Index due to better respond to market movements more influential foreign markets like Kospi and HSI. Analysis the Nikkei did not significantly affect the Composite Stock Price Index. The results of this study are not consistent with research Mansur (2005), Darmawan (2009) and the findings Hasibuan (2009) direction is different because it uses the stock price index in the period from 2000 to 2008 while the study period was taken after the subprime mortagage with price indices daily stock more shows real change. And this study are consistent with the findings Maulino (2009), which states no effect on the Nikkei stock index to a monthly time period 2004-2009. With a regression coefficient of - 0.056 gives the sense that the Nikkei change as much as 1 point will impact the value of the Nikkei - 0056 with the rise in the same direction, this means that when the Nikkei index rose 1 point, the stock index to fall by 0.056. These results indicate that the Nikkei 225 index has a negative influence direction it indicates that the increase in the index in Japan resulting weakening of confidence among economic actors on the Indonesian stock market may be due to heated political conditions that lead to opportunities to invest in Indonesia is less demand from foreign parties.
Suprihati IJSRE Volume 05 Issue 04 April 2017 Page 6355
CONCLUSION
Based on data analysis and discussion above it can be concluded: Partially share price index Kospi Asia Pacific market and HSI affect the Composite Stock Price Index while the Taiex and Nikkie no effect influence on Composite Stock Price Index. The results of this study are consistent Maulino (2009) and contrary to the findings of research Darmawan (2009) and Mansur (2005) for different time periods from 2000 to 2002 with a sample of monthly stock price index. The rupiah does not effect on the Composite Stock Price Index movement. This is not in line with the research Hasibuan (2009) theory that explains that the rupiah exchange rate with foreign exchange rates will affect the stock price. And in line with the research Maulino (2009) who concluded the exchange rate does not affect the Composite Stock Price Index. Simultaneously, the stock market price index of Asia Pacific (Kospi, Taiex, HSI and Nikkie) as well as the exchange rate together affect the IHS in BEI. This is in line with research Mansur (2002), which is jointly global stock price index Composite Stock Price Index effect on both positive and negative and in line with the research Hasibuan (2009) where the exchange rate and world stock prices affect the stock price index.
REFERENCES
1. Bahmani Oskooee & Sohrabian,1992, Stock Prices And The Effective Exchange Rate Of The Dollar,
Applied Financial Economics, Volume 24, Hal. 459 – 464
2. Bank Indonesia.(2016). the BI rate, www.bi.go.id. accessed December 15, 2016. 01:30 PM
3. Bapepam. (2016) .Capital Market, www.wikipedia.org. accessed. December 12, 2016 10:30 PM
4. Darmawan, Dawn Budhi, 2009. Effect Index of 100, 225 and DJI NKY, FTSB Against Composite
Stock Price Index Before, When And Mortagage After Subprime in 2006-2009, MM UGM.
5. Durand, Robert B., Koh Sze Kee, Iain Watson (2001) .Who Moved Asian-Pacific Stock Markets? A
Further Consideration Of The Impact of the US and Japan, Australian Journal of Management, Vol.26 (2)
6. Finance. (2016) .index stock prices, www.yahoo finance.com accessed December 13, 2016 1:30 PM
7. Ghozali, Imam. 2006 Applications Multivariate Analysis with SPSS Program, Agency
publisher-Diponegoro, Semarang
8. Gitman, Lawrence J. 2003. Principles of Managerial Finance, seventeenth edition. Massachusetts: Addison-Wesley Publishing Company
9. Gujarati, Damodar (2011) Essentials of Econometrics, New York: The Mc Graw-Hill Companies,
Inc.
10.Habibullah and Baharumshah (996), Money, Output and Stock Prices in Malaysia; An Applicatio of
the Cointegration Tests, International Economic Journal, Vol.10 (2): 121-130.
11.Hasibuan, Ali Fikri. (2009). Effect of Currency Exchange and Price Index Global Stocks Aagainst JCI Movement, USU Repository
12.Husnan, Suad, (1996), Financial Management-Theory and Application, fourth edition, part one,
Yogyakarta: BPFE.
13.Jogiyanto. 2007, Portfolio Theory and Investment Analysis. The first edition, Yogyakarta BPFE
14.Kuncoro, Mudrajad, 2001. Financial Management International, publisher BPFE Yogyakarta
15.Mansur Moh .. 2002. Effect of Global Stock Index on Stock Price Index Garelationship (JCI) on the
Jakarta Stock Exchange (JSX) Period 2000-2002, FE Padjadjaran Accounting.
16.Mauliano, Deddy Azhar, 2009. Analysis of Factors Affecting Movement Composite Stock Price
Index (CSPI) in Indonesia Stock Exchange, University Gunadarma
17.Milliaris, AG, and Urritia, Jorge L., 1992, The International Crash of October 1987; caousality Test.
Suprihati IJSRE Volume 05 Issue 04 April 2017 Page 6356
18.Pratikno, Dedy, 2009. Analysis of Effect of Exchange Rate, Inflation, SBI and Dow Jones Against
Composite Stock Price Index (CSPI) in Indonesia Stock Exchange (BEI), Post graduate USU.
19.Reilly, Fank, K and Norton, Edgar, A, 2003. Investments, sixth edition, Thomson South-Western, Canada.
20.Salvatore, Dominic, (2004), Managerial Economics in a Global Economy with Economic
Application Card, 5th Edition-South Westrn.
21.Samuelson dan William (1994), Economics Macro, Erlangga, Jakarta
22.Shapiro, Alan C., 2006, Multinational Financial Management, Eight Edition, John WIley & Sons (Asia) Pte Ltd.
23.Siamat, Dahlan, (2005), Management of Financial Institutions, second edition, Jakarta: Issuing
Faculty of Economics, University of Indonesia.