TECHNICAL UNIVERSITY OF CLUJ-NAPOCA
ACTA TECHNICA NAPOCENSIS
Series: Applied Mathematics, Mechanics, and Engineering Vol. 61, Issue IV, November, 2018
MODERN METHODS AND TOOLS TO IMPROVE THE PRODUCTION
PROCESSES FROM SMALL SERIES AND UNIQUE PRODUCTION
Daniel FILIP
Abstract: This paper highlights the increase of small and unique serial production relative to world production due to the increasing diversification of consumer demand. The enterprises need to adopt the modern methods, techniques and tools to reduce the production costs. These methods and tools have been implemented in several Romanian companies and have generated considerable results.
Key words: Methods, tools, Production Management, Small and unique series production.
1. INTRODUCTION
Due to the increasingly diverse demand from consumers for personalized products and services, the enterprises are forced to adapt as quickly as possible to market demands for survival or growth. By implementing the product personalization process, the enterprises tend to adopt features characteristic of small series and unique production.
Including the traditional industries that have achieve large series and mass production such as the chemical, food, energy, automobile, etc. industries, they have developed facilities of production to personalize the products as required by the customer.
Fig. 1.1. Evolution of demand and offer for the products Currently, the gap between offer and demand is very large in most industrial areas, as outlined in figure 1.1. This situation requires the enterprises to take measures to obtain products at competitive prices:
• reducing the costs of production; • compliance to quality standards; • continuous improvement of processes; • compliance of the delivery terms; • efficiencies the logistics chain;
• working with minimum stocks "just in time"; • etc.
The organizational method implemented in the production unit is defined according to the type of production adopted. This is evidenced by the following characteristics: the product catalog to be manufacture, the volume of production made from each assortment, the degree of specialization for the workplace and the way transferring the products from one job to another, these being some elements that influence decisively the type of production adopted by an enterprise.
The type of production that exists or proposed determines how to select the organizational method for the production unit, the type of specific management required to preparation, execution, tracking and control of production.
In specialty literature there is at least one specific method for each type of production, namely:
• the large series and mass production is
organized according to the production line method, which can be of two types with continuous or discontinuous flow;
years 50’- 60’
years 70’- 80’
Present
OFFER
• the small and unique series production can be
organized by several methods, such as: the principle of homogeneous machine groups, the principle of fixed position, etc.;
• the middle series production can be defined as
a mixed method of the above mentioned according to the size of batch production. The higher it is volume and number of cycles from the same product, the more it tends towards an organizational method in the form of production lines. The lower it is volume and number of cycles of the same assortment, the more it tends towards a unique organizational method of production.
Within an industrial enterprise, there are not only characteristic features of a single type of organizational method, in most of the situations there are elements of all types presented above, and the method chose to implemented is that in which the elements of characteristic is predominant.
2. ORGANIZATION OF PRODUCTION
2.1. The small and unique series production
The small series and unique production can be identified by a few basic elements, such as:
• large range of products and instability; • Machine, technological equipment must be
with a universal character;
• high degree of flexibility for the
manufacturing process;
• highly skilled workforce.
The organization of the production unit can be done by several methods, the most common one being is the method of technological principle. Machine organization is done by the production groups method and each group contains a few homogeneous of machines;
Another method of organizing production unit can be the principle of fixed position, this method applies when we have to manufacturing the parts or products with dimensions very large. The method consists in a fixed position and the teams of workers with necessary equipment moving from one place to another, the phases or operations are required by the product technology.
The equipment and machines must be with a universal character, capable to easily adapting the requirements manufacturing technology of the product in a very short time and with a few adjustments.
The small and unique series production presents a lot of advantages and disadvantages, the most important are:
a) advantages:
• the used universal machines and equipment
with ensuring a high-flexibility;
• a highly skilled for the workforce that adapts
rapidly to any situation;
• etc.
b) disadvantages:
• high cost per unit of product;
• high volume of transport and handling; • the workforce has a high level of
qualification;
• long production cycle;
• quality control is more complex; • etc.
2.2. Design and manufacturing technology choice
Manufacturing technology is all the methods, processes, operations made or applied to raw materials, materials and data for any particular industrial or commercial product.
Preparing technological includes design of new processes or improving existing ones, both for the production of basic and auxiliary processes or tracking and quality control.
The preparation phase should identify technological solutions to solve the following problems:
• new technological processes developed must have a high level of mechanization and automation;
• to ensure production through consumption of raw materials rationally;
• to ensure manufacturing quality products with minimized costs.
In turn technological preparation consists of a set of activities. The most important are as follows:
b) the choice of equipment necessary for the operations and establish working arrangements for each operation separately;
• in the production of small series and
unique, you must specify the types of equipment, operating mode, the precision of execution, etc.;
• the mass production and mass must be
established tools, their full name and number of their inventory, which will be processing the part.
c) develop standards for labor;
d) the determination of the raw materials, energy, etc.;
e) developing the necessary technology and quality control tracking.
Manufacture of a product can be achieved through several technological processes, but the important thing is choosing technological options that we offer the many advantages of economically. Identification of the optimal variant can be achieved through an economic analysis based on indicators considered important. These indicators can be of two types namely: in kind and value of cost indicators.
Types of indicators in kind, which can be used in the analysis:
• consumption standards for raw materials, fuel, energy, etc.;
• way equipment, number of machines, equipment complexity, the new equipment and technological equipment necessary; • required amount of work;
• complexity of the manufacturing process. Types of indicators of cost values, which may be included in the analysis:
• technology cost per product unit; • total cost of product technology
The cost of conventional technology is a term consists of the sum of those expenses that are specific to a particular technological options. Getting technology unit cost reduction is achieved by those expenses that are not influenced by the technology of choice of unit cost of product.
In turn the cost of technological unit is divided into two types of expenditure, namely:
• variable costs per product; • fixed costs per product.
The product variable costs are those costs which change their size proportional to the amount of products made (cost of raw materials, fuel, energy, direct labor, etc..).
Product fixed costs are those costs which change their size in relation to the quantity of products manufactured (staff salary costs not directly related to product realization, lighting and space heating costs etc..).
Calculation of cost per product unit technology and total cost by analytical technology:
Ctu = Cv + Cf/Q (1)
Ctt = Cf + Cv*Q (2)
where:
Cv - variable costs per unit;
Cf - fixes costs
Q - quantity of product manufactured; Ctu - technological unit cost;
Ctt - total cost technology.
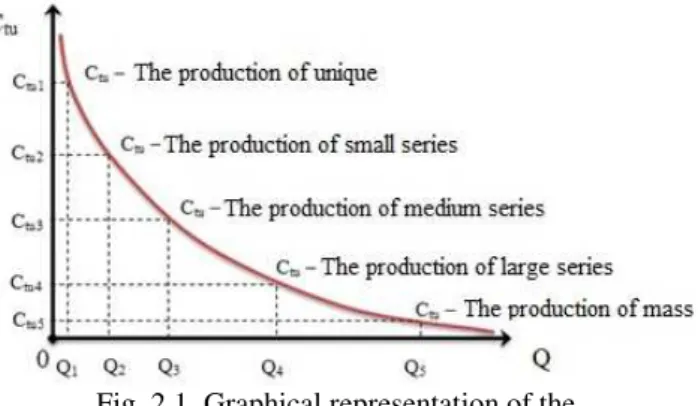
Graphic method, the cost per product unit technology can be highlighted with a curve asymptotic to the two coordinate axes. Vertical axis indicates the value of the product unit cost and the horizontal axis expresses the large volume of products made of the same variety.
Fig. 2.1. Graphical representation of the technology unit cost by type of production
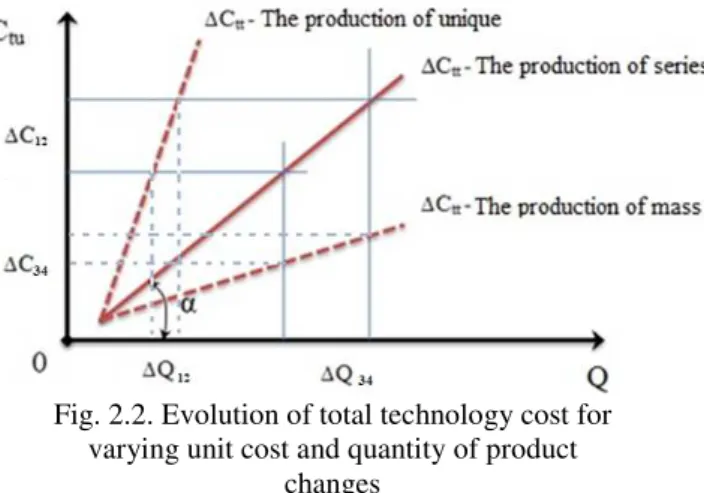
Total cost of technology by the graphic method may be determined by a straight and angular coefficient α:
The chart technology unit cost (Figure 2.1), we see that a small change in the quantity of products ∆Q12, specific transition from unique
products in small series production, technological change in unit cost is higher ∆C12
production to mass production, technological change unit cost is lower ∆C34.
Fig. 2.2. Evolution of total technology cost for varying unit cost and quantity of product
changes
In conclusion (Figure 2.2), where the angle α tends to a value of 45°, technological variant to be taken is the medium series production. When the angle α tends to value of 90° then adopt technological variant for unique products and the value towards 0° to follow technological variant for mass production.
3. METHODS AND TOOLS USED IN PRODUCTION MANAGEMENT
3.1. Planning the production process
The production of small series and unique, planning is one of the most important activities in the process of obtaining products, because at this stage should be set order of operations, time required for completion of each operation, equipment involved, staff, skills and knowledge employees must have etc. It should be noted that the order of operations is required, the manufacturing technology. After the normalization process operations, each operation is assigned a safety margin that has a value of 10-15% during the implementation of the operation, for it to be carried out safely
The data required to complete the calendar plan of the manufacturing process are:
• list of new products to be treated during the
time under consideration;
• have determined the time required for
completing each transaction. This time consists of actual execution time and preparation time plus the margin of safety of operation of each operation.
• input and output of the manufacturing of new
products;
In order to highlight better planning of the production process, using Gantt Chart. This is a drawing table that will define the following fields: business name, time of execution of work, contractor operation, start date, end date and an order of operations by establishing predecessors or successors. A widely used planning tool is the Microsoft Project 2016.
Fig. 3.1. Using a software tool in achieving planned In Figure 3.1, you can easily view composition (there are two stages) namely planning Design process and Manufacturing process (data are fictitious). The design process consists of four distinct activities, with a different conduct. We also notice that the first activity that takes place is activity A, activity carried out within 3 days, with good success as B and C activity, which in turn achieve lasting 2 days and 1 days. Activity ABC Finished from this stage is the type of event and lasts for achieving zero. As our name suggests, this type of work force that is so far completed all three activities predecessor.
In this planning activity is taking place in parallel, for example, the first stage B and C are activities which have as its predecessor activity A and the successor Finish ABC. As you can see activity C can start work without delay to influence critical path
The critical path is that path with the longest length of a project, but that also needs to ensure all activities needed to achieve the objective and gives the minimum to achieve that project. A project can have one or more critical roads, these roads may change if the activity exceeds its time for achievement.
In conclusion, if the change occurs within a project critical path means that the project completion date does not correspond with the original set. This can be delayed or advanced.
Determining the duration of an activity is determined using the following days relations:
K n d N
t
T ⋅
⋅ ⋅
= (3)
where:
t - time required to complete a task;
N - number of people working simultaneously to perform the activity;
d - during a change in hours; n - load factor down;
k - factor additional time required for endorsement or approval of the activity.
When drawing up the planning process of manufacturing a product is recommended to use Gantt chart, to easily identify the type of activities, the order of achievement and duration. Provided to allow parallel execution of activities is the successor activity is not subject to the completion of predecessor activities.
3.2 Value analysis method
This method is very simple and involves going through several phases:
• the first phase occurs drafting a document, which answers the following questions: what products will be manufactured? in what quantity will be produced? which is the product life cycle? if the product meets the market requirements? and if costs have been revised?
• phase two is the analytical where he will try to answer three questions, namely: what are the functions? how much? and how the product should cost?
• the third phase attempts to find solutions to resolve the following issues: how to develop
future product? if you can make innovations? how complex this problem?
• fourth phase is allocated is the evaluation and measurement of results of the previous phase. This is done by comparing the results obtained from the method of value analysis and choice of method of manufacture.
• fifth phase is to verify the solutions obtained by answering three questions: who we are marketing revenue with new product? as product cost us? and the risks that could occur?
• the sixth phase, any recommendations are made after the solution has been adopted, such as: what courses of action there? Now everything is prepared implementation plan.
For to implement the solution adopted to take account of all factors taken based on the previous phases.
3.3 Integration of production
Integration of production is an important feature for an industrial, representing the possibility of executing the conditions of profitability of all parts of the composition of a product which is intended to be made. If certain operations, technology research phase or cannot perform under the profitability may be adopted solution cooperation with other enterprises specialized field.
Collaboration means an economic relationship in scale enterprise, which is governed under a contract. The purpose of this collaboration is to develop a complex product or service that otherwise would not have been achieved by producing a single entity. Each of these enterprises specializing in producing parts or operations of manufacturing the product.
These collaborative activities are quite complex and may take place in phases to achieve the final product, the cooperation can be achieved by companies in the country and / or abroad.
The second phase is to determine the equipment capacities if they are able to make all parts of the composition of a product covered by this option from implementation within the company or through cooperation with other companies.
Determination of total capacity is achieved by the relationship:
Ctot = Cip + Cppe + Cpc (4)
where:
Ctot - total production capacity;
Cpi - internal production capacity;
Cppe - production capacity is more profitable
to be made to external;
Cpc - production capacity can be achieved
only through collaboration.
The third phase is to determine the costs per unit of product, made in the manufacturing process to obtain parts. Processing operations involving parts including alternative-specific costs (and transport costs) not just overhead.
In the last phase to help establish a mathematical model which is chosen best production alternative. It wants to manufacture a product that contains a number of "m" types of marks, of which the first "k" can run at all internal operations to "i" and the following parts of the "j = k +1" to the "m" can be made only through external cooperation. Next, we develop a matrix array, which leads to the following linear programming model based on the objective. If the objective is to maximize profits by minimizing costs. [2]
⋅ + ⋅
∑
∑
= = + k j m k i C ij C opij I ij Iopij X C X
C 1 1 ) ( ) (
min (5)
with restrictions:
• not exceeded the amount planned:
j C ij I
ij X Q
X + ≤ (i=1,m; j=k+1,n;) (6)
• not exceeded production capacity of the link
of production:
∑
∑
+ = = ≤ ⋅ + ⋅ n k i di C j ij k j I jij X t X T
t
1 1
(i=1,m) (7)
• non-negativity constraint:
0 , ijC ≥ I
ij X
X (i=1,m; j =1,n;) (8)
where:
j
Q - all parts of the product "j";
C ij I
ij X
X , - amount of the mark "j" that will process the operation "and" at the company internally and that spouses;
ij
t - processing time for operation "i" a landmark "j", both internally and through cooperation;
di
T - time available to link the production remaining after operations were conducted;
C opij I
opij C
C , - value cost of operation "i" the mark "j" for domestic production, that through cooperation.
Development of cooperation links with other enterprises in carrying out operations on parts or parts under maximum profitability, contributing to decrease the integration of production and hence the increased specialization of the beneficiary company.
Determining the degree of integration of production to achieve a product in a company is determined as a percentage with the following equation: [2] 100 1 1 1 ⋅ ⋅ + ⋅ ⋅ =
∑
∑
∑
= = = n k C pk C k k j I pj I j k j I pj I j rif C R C R C RG (9)
where:
Grif - is the integration of manufacturing a
product;
C k I
j R
R , - total amount of items that will be processed domestically, that through cooperation;
C pk I
pj C
C , - internal processing cost is a landmark that cooperative
In conclusion, if the degree of integration Grif
takes the value 100 means that all production is done either internally within the company, and if the value is less than 100 when the difference obtained is achieved through cooperation
3.4. Order of production
parts ordered according to sequence of operations required for manufacturing technology and equipment availability. Marks are allocated to machinery and equipment in optimal quantities for manufacturing to be as effective.
In the process of authorization, the objective function is to minimize expenses by the following conditions:
• compliance logical sequence of operations
required for manufacturing technology;
• the conditions of noninterference of
operations;
• optimal loading capacity of production.
Types of models used in the production of industrial enterprises for authorization: [2]
• Deterministic model with discrete and
continuous structure:
∑
∑
− = − = + + − + = 1 0 1 00 [ ()] [ () () ( )]
p
t p
t
s P t C t S o
c t v f Z
∑
− = ⋅ + + − + 1 0 0 )] ( ) ( ) ( [ p t n p C t P t S o p Ic (10)
and
∫
+∫
− + +=
t b
a
s Pt C t S o dt c dt t v f Z 0 '
0 { [ ()] [ () () ( )]
(11) } )] ( ) ( ) ( [ 0
∫
− + + ⋅ + b a np C t P t S o dt p I
c
• Probabilistic model with discrete and
continuous structure:
∑
∑
− = − = + ⋅ + − + ⋅ = 1 0 1 00 [ ()] [ ()] [ () () ( )] [ ()]
p
t p
t
s Pt Ct S o PCt
c t v P t v f Z
∑
− = ⋅ ⋅ + ⋅ + − + 1 0 0 0 )] ( [ )] ( ) ( ) ( [ p t n p C t Pt S o pC t p p Ic (12)
∫
+ = t t v d t v P t v f Z 0 '0 { [ ( )] [ ( )] [ ( )]
∫
− + ++
b
a
s Pt Ct S o PCt dC t
c [ () () ( )] [ ()] () (13)
} ] [ ) ( )] ( [ )] ( ) ( ) (
[ 0 0
∫
− + + ⋅ ⋅+
b
a
n p C t Pt S o PC t dCT p p I c
where:
f(v) - is the production function; P(t) - resources;
C(t) - demand S(o) - initial stock; cs - Cost of storage;
cp - shortage cost;
p[v(t)] - probability of production; p - number of calculation steps;
P[C(t)] and P0 - probability of demand and
investment;
a, b, c, d, T - limits of variation of stock shortages and production function.
In the relationships described above for production authorization can define the following objective function: [2]
⋅ + ⋅ =
∑∑
= = 1 2 1 1 0 0 min min a i a j n ijij X p I
p Z
(14)
with the following restrictions:
ij i
j t t
t − ≥ (15)
i C j C i ij i
j t t V t T t
t − ≥ ⋅ ( − )≥ (16)
cj i c i
j t t T
t − ≥ − (17)
c j i c i
c t t t
T ≥ + − (18)
0 > j
x xi >0 (19) where:
ti, tj - is the duration of the operation "i" and
"j";
Tc - manufacturing cycle.
3.5. Tracking and control method for manufacturing orders
The tracking and control of the products in the manufacturing process is very important because that do not follow a manufacturing line but each piece or product has its own route according with to the technological itinerary.
This method has been successfully implemented in a lot of industrial enterprises with remarkable results.
Fig. 3.1. Label tracking and control The information can be gathered from labels
are very important and that can be used in decision making process.
Activities planning of small series and unique production is a very complex process, especially when you wanted to maximum possible loaded the workplace to get the lowest production costs for a certain period. An optimal loaded for the equipment requires a precise activity planning for workplace, which means that the parts must reach the planned hour and minute at to operations. The marks often get delayed due to unforeseen factors, difficult to identify in the planning work. For these factors when planning we allocate a safety margin 10-15% for each operation from the calculated time.
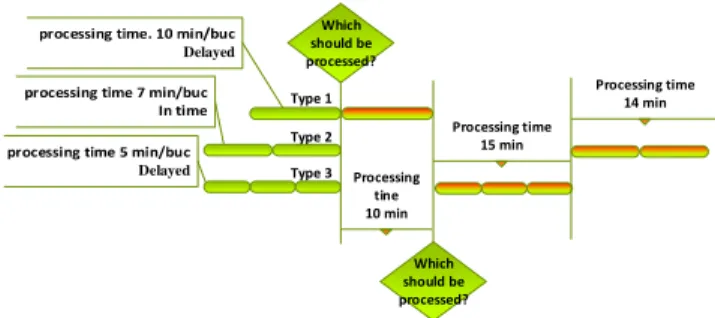
A situation frequently occurrence in the production unit is when the worker must get choose from three types of parts to be processed, two of them arrive late, the type 1 and 3, while type 2 is on schedule. Which type should be processed?
Case 1. Setting priorities based on a single
parameter, namely "time” With these labels, and a few simple calculations, the operator can decide which is the order of processing. If we look at Figure 3, we see that the construction of the first type of play we need 10 minutes to achieve the type we need two 2 * 7 or 14 min and the third type 3 * 5 or 15 min. In the event that there are other factors that influence the decision, the proposal is the operator commences with the type of play that is the total time to achieve the smallest of parts delayed, type 1. [4]
???
In time Delayed parts Type 1
Type 3
Type 2
Delayed parts
Fig. 3.2. Graphical representation of a job
After the song type 1 left, we proceed to analyze the situation. What will be the next type of work piece: Type 2 or 3? The same rule applies - the type of track with the total time to achieve the smallest of parts delayed, processed first. At the time set for the two remaining pieces come together the 10 min that was processed first type. After calculating the time, we have the following situation: for parts of type 3will have 10 minutes to existing time delay. he maximum delay for parts of type 2 will be up to 10 minutes. In the planning of operations, we allocate additional time, as the safety margin for operations to be conducted safely (in time). [4]
Which should be processed?
Which should be processed? Type 1
Type 2 Type 3
Delayed
Delayed Processing
tine 10 min
Processing time 15 min
Processing time 14 min
Fig. 3.3. Processing decisions when the safety margin is> 10 min
The second situation (Figure 3.4) is the margin of safety is worth less than 10 min, then the pieces of type 2 are also in the delay but will have the shortest time to achieve, so the following items will be processed the type 2.
Which should be processed?
Which should be processed? Type 1
Type 2
Type 3
Delayed
Delayed Processing
tine 10 min
Processing time
14 min Processing time 15 min
Fig. 3.4. Processing decisions when the safety margin is <10 min
Case 2. Setting priorities for when we have
several important parameters such as: the value
of the part / product, "urgency" to achieve the part / product, parts/ products with very large delays, etc. [4]
If we have several important parameters that must be taken into account in the planning process is proposed the following solution: determining a level of significance for each parameter and a scale drawing of priorities (Figure 3.5.) [4].
Depending on the priority we attach a color and it will be background labeling (Figure 3.6.). If it encounters a situation where we have two labels the same way, the rule will be applied like in case 1.
Setting priorities considering the importance of parameters
P
ri
o
ri
ty
1
P
ri
o
ri
ty
0
P
ri
o
ri
ty
2
N
o
p
ri
o
ri
ty
Color scale of priority
If the background color of the label is red, it means it will be processed as soon as the machine is released.
If the background color of the label is orange, it means that it will be processed as soon as the machine is released, provided there
is no label of red color.
If the background color of the label is yellow, it means that it will be processed as soon as the mark / batch is finished, provided
there are no more other labels of red or orange color. If the background color of the label is white, it means it will be processed after the machine is released, provided there are no more other labels of different color, and the priority criterion will
be the shortest delay time than the late ones.
Fig. 3.5. Color priorities settings
Fig. 3.6. Label high priority "0" After the parts or products are completed,
that labels should be collected by the production manager and analyzed them. With this information recorded on labels the production planner can take an efficient decision for the future activity to planning process of production:
• can be identify which the operations are most
degree loaded (low, maximum or over capacity);
• can be identify the places where are
• can be identify the worker who has not done
his work on time and what problems have occurred, etc.
• can be to improve the planning activity of
production which contribute to reduce the fixed costs per unit product through the optimal level charge of machines;
• can be ensure transparency of the
manufacturing process and better control of resources.
4. CONCLUZIONS
The small series and unique production gains an increasing share of world manufacturing of products which implies the adoption of new measures to improve the activity of production from an enterprise.
Designing or developing products involves a lot of processes that have to solved, the most important ones can be mentioned:
• product design;
• an analysis of the capability and capacity for
the enterprise to manufacturing the new products;
• suppliers’ identification for raw materials and
equipment;
• choosing all the necessary equipment and
build the technological itinerary for the manufacturing process of product;
• determining the time norms for each
operation of the new product;
• planning operations to manufacturing the
product on workplaces;
defining the tracking and control methods for the product in the manufacturing process
For the all aforementioned, there are solutions proposed in this paper to make more efficiently the production activity of an enterprise.
5. REFERENCES
[1] Filip D., Lungu F., The management of small and unique production series, LAP LAMBERT Academic Publishing, ISBN-13:973-3-659-31753-8, Germany, 2013. [2] Florica, B., Managementul producției,
Publisher ALL, ISBN: 9735491554, București, 2002.
[3] Abrudan, I., Cândea, D. (coord.), Programarea producției de unicate, Manual de Inginerie Economică - Ingineria si Managementul Sistemelor de Producție., Editura Dacia, ISBN: 973-35-1588-4, Cluj-Napoca, 2002.
[4] Filip, D., Lungu, F., Oțel, C., Dan, I., S., A method for the management of the small and unique production series, Review of Management and Economic Engineering, ISSN 1583-624X, Vol. 11, No. 1, 2012, [5] V. Firescu, R. Vlad, N. Toderici, “The
Application of the Lean Management Principles and Methods - Opportunities and Hedges from the Romanian Employees,” Proceedings of the 1st Management Conference: Twenty Years After - How Management Theory Works, Cluj-Napoca, 2010, pp. 73-89.
[6] https://www.britannica.com/technology/ production-management
Metode și instrumente moderne pentru îmbunătățire proceselor din producția de serie micăși unicate
Această lucrare scoate în evidență creșterea dimensiunii producției de serie mică și unicate în raport cu producția realizata la nivel mondial datorită cereri tot mai diversificata din partea consumatorilor. Întreprinderile sunt obligate să adopte metode, tehnici și instrumente moderne pentru reducerea costurilor de fabricație. Acestor metode și instrumente au fost implementate în mai multe întreprinderi din România și au generat rezultate considerabile.
Daniel FILIP, Ph.D., Lecturer, Technical University of Cluj-Napoca, Management end Economical