TECHNICAL UNIVERSITY OF CLUJ-NAPOCA
ACTA TECHNICA NAPOCENSIS
Series: Applied Mathematics, Mechanics, and Engineering Vol. 62, Issue III, Septembrie, 2019
MATERIAL PARAMETERS IDENTIFICATION OF CARBON FIBRES
COMPOSITES WITH STRAIN GAUGES
Mihaela SIMION, Cristian DUDESCU, Paul BERE, Călin NEAMȚU, Cătălin COCEAN
Abstract: The paper presents experimental identification of the elastic constants of two types of carbon fibers composites with the same stacking sequence but made of different carbon fabrics (plain and twill). The two materials are the face sheets of a sandwich structure. For accurate strain measurements biaxial strain gauges have been applied on standard specimens. Tensile modulus was measured on specimens with the warp fibers parallel to the load and specimens with warp fibers perpendicular to the load. Shear proprieties required specimens with a 45° orientation of fibers with the loading directions. Four-point bending test completed the analyses. The obtained values can be used for homogenization of a sandwich material or in the numerical simulations of composite parts.
Key words: carbon fiber composites, material constants, strain gauges.
1. INTRODUCTION
The composite materials used in the construction of structures in various fields (automotive, naval, civil, aerospace) are becoming more and more effective in providing
good mechanical properties, temperature
resistance, abrasion and cracking resistance, high resilience, stability to chemical agents, etc. Carbon fiber reinforced plastics (CFRP) is one of the most used composite material because of its excellent properties, such as light weight, high strength, high modulus, good fatigue resistance and corrosion resistance. Sandwich composite structures consist of two thin, stiff and strong fiber reinforced composite face sheets (skins) separated by a thick layer of low-density material (core) with lower stiffness. Due to their higher elastic properties the role of the skins is to withstand bending and in-plane actions, while the transverse shear loads are sustained by the core [1]. The bending stiffness of this type of structural lay-up is larger than that of a single solid plate of same total weight made of the same materials as the faces [2]. For this reason, composite sandwich structures are widely used in high-performance applications where weight
must be kept to a minimum and higher bending stiffness is required, such as aerospace structures, racing cars, trains and many more [1-5].
Determining the mechanical properties of composite materials is necessary to know the
mechanical behavior of the mechanical
structures made from CFRP in different applications. Experimental measurements like tensile test and four-point bending test combined with the strain gauge technique for accurate strain measurement are a common and classical approaches to identify the mechanical property of CFRP.
2. MATERIALS AND METHODS
This chapter presents the technology for obtaining the specimens from composite material, as well as their structure, respectively the methods applied and the equipment used for
the experimental determination of the
mechanical characteristics of the composite material.
The composite materials used in the present paper have been manufactured through vacuum bagging process cured in autoclave. To perform the experimental determinations, flat plates have been manufactured from which standardized specimens were cut by water jet. The two types of investigated composite materials (denoted A1 and A2) have three layers with the following stacking sequence [0/90/+45/-45/0/90]. The difference between the two analyzed materials is that the sample A1 is made of a plain fabric with
density 90 g/m2 and the sample A2 of twill fabric
with a density of 240 g/m2. The layers were
bonded with a 160 g/m2 thin glass fiber adhesive
and the used epoxy resin was R806. These materials will form the faces of a sandwich structures with the honeycomb filling material.
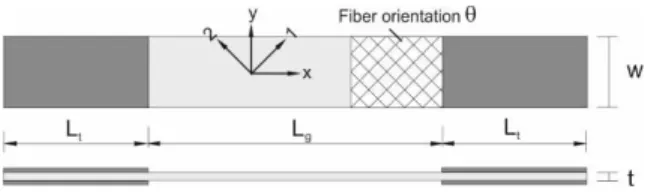
The specimen geometry is presented in Fig. 1 and their dimensions are reported in Table 1.
Fig. 1. Specimen geometry considering the fibers orientation and loading direction.
Table 1
Dimension of tested specimens
Sample Lg
[mm]
Lt
[mm] w [mm]
t [mm] A1
150 20 25 0.5
A2 1
2.2 Methods
With carbon fiber reinforced plastics, the spatial arrangement of the fibers embedded in the plastic matrix causes a pronounced anisotropy of the material behavior.
With unidirectional and bidirectional
reinforcement, the material properties are orthotropic. From this reason several types of specimens with different orientation of the fibers
or layers with respect to loading direction (θ=0°,
θ=90° and θ=45°) from the same material are
necessary (Fig. 2). Specimens with θ=0° and
θ=90° have the same structure.
Tensile tests were run in one series of 5 specimens with the warp fibers parallel to the
load and in a second series (containing 5 specimens) with warp fibers perpendicular to the load. These tests were performed in accordance with the ASTM D3039M standard [6]. Elastic modulus, and Poisson ratio have been derived for both wrap and fill directions. Shear tests were performed in accordance with the ASTM D3518M standard [7]. Shear modulus have been derived by these tests. The bending modulus of elasticity was determined by the four-point bending method. The procedure for preparing the samples and performing the tests was realized according to ASTM D7264/D7264M-07 standard [8].
Fig. 2. Designation of the samples relative to the direction of the fibers (A24 is a given material code).
For both in-plane tensile, shear and bending tests bidirectional strain gauges (1-XY91-6/120,
HBM, Germany) with 120 Ω electrical
resistance and 6 mm gauge length were applied to each specimen to monitor the longitudinal and transverse strain (Fig. 3). The bidirectional strain gauges used for strain measurement have two overlapped grids able to measure the strains in the same point into two directions. A half-bridge set-up with passive strain gauges mounted on a non-loaded specimen of the same composite
material was used to compensate the
temperature variation.
The tests for elastic constants identification were conducted on an INSTRON 3366, USA (10 kN) universal test frame controlled by an electronic control unit which allows monitoring of the applied load and the speed of the cross head. Strain signals and a second load cell were acquired by a digital data acquisition system (HBM Spider 8, Germany).
x y
x y
Fig. 3. The CFRP tensile specimens equipped with bidirectional strain gauges.
To break the specimens the INSTRON 8801, USA servohydraulic test system with a maximum force of ±100 kN has been used. Tests were conducted at a constant cross head speed of 1 mm/min for tensile, shear and bending tests.
2.2.1 Tensile tests
To obtain the tensile elastic constants
(longitudinal elastic moduli Ex, Ey, shear
modulus Gxy and Poisson ratio νxy) of the
composite materials type A1 and A2 tensile tests
were performed according to the
above-mentioned standards specifications. Specimens with fiber layers orientation of 0° and 90° with respect to loading direction were used to
determine the longitudinal elastic modulus (Ex
and Ey) and specimens cut at 45° for shear
modulus identification.
The experiment consists in the application of tensile force to achieve the stress-strain curve
(σ - ε), from which the elastic constants of
composite material can be determined. In figure 4 is presented the experimental set-up for the determination of the material elastic constants by tensile test.
Fig. 4. Experimental set-up for tensile test.
2.2.2 Four-point bending tests
The bending modulus of elasticity (Eb) of
composite materials type A1 and A2 was also determined by the four-point bending test. The procedure for preparing the samples and performing the tests was realized according to ASTM D7264/D7264M-07. The span distance was 90 mm and the distance between the applied forces was 65 mm. The strain gauges signal and the applied force was simultaneously recorded. The calculation method presented in the standard was used for determination of the elastic constants.
3. RESULTS
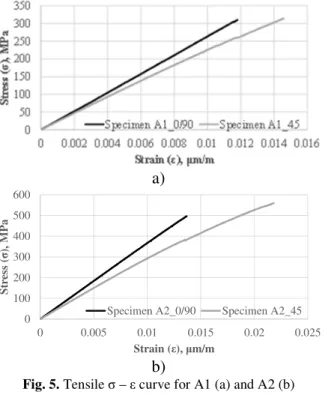
The stress-strain curves of the CFRP composite materials are obtained by tensile tests (Fig. 5) for the A1 and A2 specimens with the fibers oriented at 0°/90° and ± 45° respectively. Load
at break (Fmax) and tensile stress at break (UTS)
are given in Table 2.
a)
b)
Fig. 5. Tensile σ – ε curve for A1 (a) and A2 (b) composite specimens.
Table 2
The values of the mechanical properties obtained by tensile tests for A1 and A2 specimens
Specimen Fmax
[kN]
UTS [MPa]
A1 0°/90° 4.28 310.48
±45° 3.45 314.20
Specimen
Force transducer
Tensile gripper
Instron Bluehill program
0 100 200 300 400 500 600
0 0.005 0.01 0.015 0.02 0.025
S
tr
es
s
(
σ
),
M
P
a
Strain (ε), μm/m
A2 0°/90° 12.81 496.24
±45° 13.87 559.40
According to standard procedure to
determine the chord modulus of elasticity (Echord) and Poisson ratio (ν) the strains values
for calculations were in the range of
1000 με ÷ 3000 με for A1 and A2 0°/90° samples
and 1500 με ÷ 2500 με for A1 and A2 ±45°
samples, respectively, as is presented in Fig. 6.
Fig. 6. Experimental strains range to calculate Echord
(example).
Thus, for each sample, was calculated the
chord elastic modulus (Echord) with the relation
given in the ASTM D3039/D3039M-00: Echord =
Δσ/Δε, where Δε represents the strains
difference in above mentioned range and Δσ is
the difference between the corresponding stresses.
a)
b)
Fig. 7. Chord modulus of elasticity (a) and Poisson’s ratio calculation (b) for specimen A1 - orientation 0°.
a)
b)
Fig. 8. Chord modulus of elasticity (a) and Poisson’s ratio calculation (b) for specimen A2 - orientation 0°.
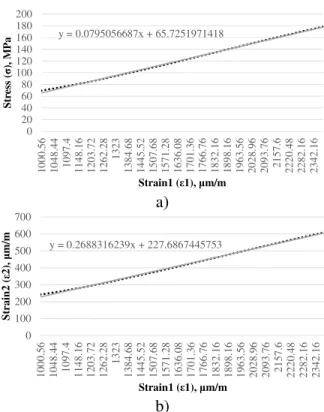
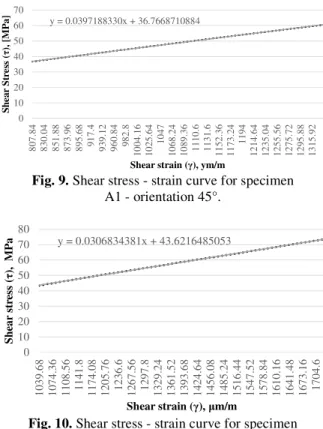
Figures 7 and 8 show the strain-stress curves in the above-mentioned range obtained for samples A1 and A2 with 0 °/90° fiber orientation and figures 9 and 10 present the strain-stress curves obtained for samples A1 and A2 with ±45° layers orientation about loading direction. These curves allow determination of the chord
elastic modulus (Echord) and the Poisson ratio (ν)
of the composite materials. In these figures, the dotted lines represent the experimental curves and the grey lines represent the fitting curves with a linear function expressed by the equation given in each figure. The experimental results of elastic constants of A1 and A2 composite material samples are given in Table 3 and 4. Δσ
Δε
y = 0.0725398944x + 63.5468678443
0 20 40 60 80 100 120 140 160 180 200 1 0 0 0 .6 8 1 1 0 6 .8 8 1 2 1 1 .1 6 1 3 1 3 .2 8 1 4 1 2 .5 2 1 5 0 7 .4 4 1 5 9 5 .8 8 1 6 7 4 .8 4 1 7 4 9 .8 4 1 8 2 8 .3 2 1 9 1 6 .1 6 2 0 0 3 .6 4 2 0 9 0 .6 4 2 1 7 0 .3 2 2 2 5 5 .7 6 2 3 4 1 .3 2 2 4 2 6 .6 4 2 5 1 1 .6 2 5 9 5 .6 2 6 7 9 .7 2 2 7 6 1 .3 2 2 8 4 2 .2 2 9 2 3 .9 2 S tr es s ( σ ), M P a
Strain1 (ε1), μm/m
y = 0.27516x + 246.56609
0 100 200 300 400 500 600 700 800 1 0 0 0 .6 8 1 1 0 6 .8 8 1 2 1 1 .1 6 1 3 1 3 .2 8 1 4 1 2 .5 2 1 5 0 7 .4 4 1 5 9 5 .8 8 1 6 7 4 .8 4 1 7 4 9 .8 4 1 8 2 8 .3 2 1 9 1 6 .1 6 2 0 0 3 .6 4 2 0 9 0 .6 4 2 1 7 0 .3 2 2 2 5 5 .7 6 2 3 4 1 .3 2 2 4 2 6 .6 4 2 5 1 1 .6 2 5 9 5 .6 2 6 7 9 .7 2 2 7 6 1 .3 2 2 8 4 2 .2 2 9 2 3 .9 2 S tr a in 2 ( ε 2 ), μ m /m
Strain 1 (ε1), μm/m
y = 0.0795056687x + 65.7251971418
0 20 40 60 80 100 120 140 160 180 200 1 0 0 0 .5 6 1 0 4 8 .4 4 1 0 9 7 .4 1 1 4 8 .1 6 1 2 0 3 .7 2 1 2 6 2 .2 8 1 3 2 3 1 3 8 4 .6 8 1 4 4 5 .5 2 1 5 0 7 .6 8 1 5 7 1 .2 8 1 6 3 6 .0 8 1 7 0 1 .3 6 1 7 6 6 .7 6 1 8 3 2 .1 6 1 8 9 8 .1 6 1 9 6 3 .5 6 2 0 2 8 .9 6 2 0 9 3 .7 6 2 1 5 7 .6 2 2 2 0 .4 8 2 2 8 2 .1 6 2 3 4 2 .1 6 S tr es s ( σ ), M Pa
Strain1 (ε1), μm/m
y = 0.2688316239x + 227.6867445753
0 100 200 300 400 500 600 700 1 0 0 0 .5 6 1 0 4 8 .4 4 1 0 9 7 .4 1 1 4 8 .1 6 1 2 0 3 .7 2 1 2 6 2 .2 8 1 3 2 3 1 3 8 4 .6 8 1 4 4 5 .5 2 1 5 0 7 .6 8 1 5 7 1 .2 8 1 6 3 6 .0 8 1 7 0 1 .3 6 1 7 6 6 .7 6 1 8 3 2 .1 6 1 8 9 8 .1 6 1 9 6 3 .5 6 2 0 2 8 .9 6 2 0 9 3 .7 6 2 1 5 7 .6 2 2 2 0 .4 8 2 2 8 2 .1 6 2 3 4 2 .1 6 S tr a in 2 ( ε 2 ), μ m /m
Fig. 9. Shear stress - strain curve for specimen A1 - orientation 45°.
Fig. 10. Shear stress - strain curve for specimen A2 - orientation 45°.
In table 3 are given the obtained results from the tensile test of A1 and A2 specimens. The values represent mean values.
Table 3
The values of elastic constants obtained by tensile tests for A1 and A2 0°/90° specimens
Sample Ex
[MPa] Ey [MPa] Gxy [MPa] Poisson
ratio, ν
A1 72359 73146 39718 0,275
A2 79505 78915 35433 0,268
3.2. Four-points bending test
The four-points bending tests were performed only for A2 sample because the composite material A1 presents a very low bending stiffness. Thus, for A2 sample with 0° and 90° fiber orientation was determined the chord
elastic modulus (Echord_flexural), respectively has
obtained (σ – ε) characteristic curve. The normal
stress (σ) required to achieve the characteristic
curve was calculated for each recorded value of force using the expression given in the standard ASTM D7264/D7264M-07.
Fig. 11. Bending stress-strain curve for specimen A2 - orientation 0°.
Table 4
The bending modulus obtained by four-points tests for specimen A2 0°
Sample Echord_flexural [MPa]
A2 73278
To obtain the chord modulus of elasticity (Table
4) from the characteristic curve (σ – ε) shown in
figure 11, are used the experimental values of the
strains (ε) in the range of 2600 με ÷ 3000 με. The
characteristic curve σ - ε from figure 11 obtained
on the basis of the experimental values was represented by the dotted line and the grey line represents the linear function approximating the experimental curve whose expression is given in the diagram.
4. CONCLUSIONS
To identify the material proprieties of the composite materials, type A1 and A2, two types of measurements were performed: tensile test for identification of tensile (E) and shear (G) moduli, and the Poisson’s ratio, respectively the load at break and the ultimate tensile strength for the A1 and A2 samples and four-point bending test for identification of flexural elastic modulus for A2 composite. Tensile modulus was measured on specimens with the warp fibers parallel to the load and specimens with warp fibers perpendicular to the load. Shear proprieties required specimens with a 45° orientation of fibers with the loading directions. Four-point bending test completed the analyses. The obtained results represent mean values of several tests with a low standard deviation. The obtained values can be used for homogenization
y = 0.0397188330x + 36.7668710884
0 10 20 30 40 50 60 70 8 0 7 .8 4 8 3 0 .0 4 8 5 1 .8 8 8 7 3 .9 6 8 9 5 .6 8 9 1 7 .4 9 3 9 .1 2 9 6 0 .8 4 9 8 2 .8 1 0 0 4 .1 6 1 0 2 5 .6 4 1 0 4 7 1 0 6 8 .2 4 1 0 8 9 .3 6 1 1 1 0 .6 1 1 3 1 .6 1 1 5 2 .3 6 1 1 7 3 .2 4 1 1 9 4 1 2 1 4 .6 4 1 2 3 5 .0 4 1 2 5 5 .5 6 1 2 7 5 .7 2 1 2 9 5 .8 8 1 3 1 5 .9 2 S h e a r S tr e ss ( τ ), [ M P a ]
Shear strain (γ), ym/m
y = 0.0306834381x + 43.6216485053
0 10 20 30 40 50 60 70 80 1 0 3 9 .6 8 1 0 7 4 .3 6 1 1 0 8 .5 6 1 1 4 1 .8 1 1 7 4 .0 8 1 2 0 5 .7 6 1 2 3 6 .6 1 2 6 7 .5 6 1 2 9 7 .8 1 3 2 9 .2 4 1 3 6 1 .5 2 1 3 9 3 .6 8 1 4 2 4 .6 4 1 4 5 6 .0 8 1 4 8 5 .2 4 1 5 1 6 .4 4 1 5 4 7 .5 2 1 5 7 8 .8 4 1 6 1 0 .1 6 1 6 4 1 .4 8 1 6 7 3 .1 6 1 7 0 4 .6 S h ea r st re ss ( τ ), M P a
Shear strain (γ), μm/m
y = 0.0732780577x + 204.3724980208
0 50 100 150 200 250 300 2 6 0 0 .6 4 2 6 2 0 .5 6 2 6 3 9 .2 8 2 6 5 8 .7 2 2 6 7 7 .6 8 2 6 9 5 .6 8 2 7 1 4 .8 8 2 7 3 3 .1 2 2 7 5 1 .8 4 2 7 6 9 .1 2 2 7 8 7 .6 2 8 0 7 .5 2 2 8 2 4 .8 2 8 4 1 .8 4 2 8 5 9 .6 2 8 7 7 .6 2 8 9 6 .0 8 2 9 1 5 .2 8 2 9 3 4 2 9 5 2 .4 8 2 9 7 0 .4 8 2 9 8 7 .0 4 S tr es s ( σ ), M P a
of a sandwich material or in a numerical simulation of a part consisting of such materials.
5. REFERENCES
[1] Zinno, A., Fusco, E., Prota, A., Manfredi G.,
Multiscale approach for the design of composite sandwich structures for train
application, Composite Structures 92, pp.
2208–2219, 2010.
[2] Belouettar, S., Abbadi, A., Azari, Z., Belouettar, R., and Freres, P., Experimental investigation of static and fatigue behaviour of composites
honeycomb materials using four-point
bending tests. Composite Structures, 87, pp.
265-273, 2009.
[3] Ahmed, A., Koutsawa, Y., Carmasol, A., Belouettar, S., Azari, Z., Experimental and numerical characterization of honeycomb
sandwich composite panels, Simulation
Modelling Practice and Theory, Vol. 17, pp. 1533–1547, 2009.
[4] Meifeng, H., Wenbin, H., A study on composite
honeycomb sandwich panel structure,
Materials and Design, Vol. 29, pp. 709–713, 2008.
[5] Qiang, L., Yongzhou, L., Zhijian, Z., Guangyong Sun, Qing Li, Lightweight design of carbon twill weave fabric composite body structure
for electric vehicle, Composite Structures 97,
pp. 231-238, 2013.
[6] ASTM D3039/D3039M-00, Standard Test
Method for Tensile Properties of Polymer Matrix Composite Materials.
[7] ASTM D3518/D3518M – 94, Standard Test
Method for In-Plane Shear Response of Polymer Matrix Composite Materials by Tensile Test of a ±45° Laminate.
[8] ASTM D7264/D7264M – 07, Standard Test
Method for Flexural Properties of Polymer Matrix Composite Materials.
Acknowledgement
This work was supported by the project “Advanced
technologies for intelligent urban electric vehicles”-
URBIVEL - Contract no. 11/01.09.2016, project co-founded from the European Regional Development Fund through the Competitiveness Operational Program 2014-2020
IDENTIFICAREA CONSTANTELOR ELASTICE
PENTRU MATERIALE COMPOZITE ARMATE CU FIBRE DE CARBON PRIN TENSOMETRIE ELECTRICA REZISTIVA
Rezumat: Lucrarea prezintă identificarea experimentală a constantelor elastice pentru două tipuri de materiale
compozite armate cu fibre de carbon cu aceeași arhitectură a straturilor dar realizate din țesături de carbon diferite.
Cele două materiale reprezintă fețele ale unei structuri de tip sandwich. Pentru măsurători exacte ale deformațiilor
specifice au fost aplicate pe epruvete standardizate tăiate din cele două materiale, mărci tensometrice biaxiale. Modulul
de elasticitate longitudinal a fost măsurat pe epruvete cu țesătura paralelă cu direcția de solicitare și epruvete cu țesătura
perpendiculară pe direcția de solicitare. Identificarea modulului de forfecare a necesitat epruvete cu o orientare a
fibrelor la 45 ° față de direcția de solicitare. Analiza a fost completată cu încercări de încovoiere în ptru puncte. Valorile
obținute pot fi utilizate pentru omogenizarea unui material de tip sandwich sau simulări numerice ale unor materiale
compozite.
Mihaela SIMION, Ph.D, Eng, Lecturer, Technical University of Cluj-Napoca, Mechanical Engineering Department, E-mail: [email protected], No.103-105, Muncii Blvd., 400641, Cluj-Napoca
Cristian DUDESCU, Ph.D, Eng, Professor, Technical University of Cluj-Napoca, Mechanical Engineering Department, E-mail: [email protected], No.103-105, Muncii Blvd., 400641, Cluj-Napoca
Paul BERE, Ph.D, Eng, Associate Professor, Technical University of Cluj-Napoca, Department of Manufacturing Engineering, E-mail: [email protected], No.103-105, Muncii Blvd., 400641, Cluj-Napoca
Călin NEAMȚU, Ph.D, Eng, Professor, Technical University of Cluj-Napoca, Department of Design Engineering and Robotics, E-mail: [email protected], No.103-105, Muncii Blvd., 400641, Cluj-Napoca