Role of Segmentation in Medical Imaging:
A Comparative Study
Preeti Aggarwal
UIET, Panjab University,
Chandigarh
Renu Vig
UIET, Panjab University,
Chandigarh
Sonali Bhadoria
MAE, Pune
C.G.Dethe
PIET, Nagpur
ABSTRACT
Rapid advances in the field of medical imaging are revolutionizing medicine. The determination of the presence or severity of disease will impact clinical care for a patient or outcome status in a study. The use of computer-aided diagnosis (CAD) systems to improve the sensitivity and specificity of lesion detection has become a focus of medical imaging and diagnostic radiology research. Accurate segmentation of medical images is a key step in contouring during radiotherapy planning. In this paper, segmentation problems in medical imaging modalities especially for lung CT as well as for thyroid ultrasound (US) are discussed along with their comparative results are shown using automatic tools as well as with some specific algorithms. Various automatic tools have been used and discussed. The results shows that though segmentation is the crucial, required and most difficult phase yet the outcome is really advantageous in medicine for the perfect diagnosis of any disease. Both the outcomes either from automatic tool as well as using an algorithm provide the required ROI (region of interest).
Keywords
CT, US, Region of Interest (ROI), Interstitial Lung Disease (ILD).
1.
INTRODUCTION
Medical Imaging technologies, such as CT, MRI, Positron emission tomography (PET), US have been widely applied to various medical procedures. Compared to traditional medical diagnosis, they provide non-invasive yet powerful means to investigate the internal structures and activities of human bodies. With the help of such technologies 8 , doctors can obtain multi-dimensional information such as 2-D slices, 3-D volumetric images and videos of ROI, which facilitates the performance of both qualitative and quantitative analysis. Segmentation is a main domain of medical image processing [2]. Medical image segmentation is usually the first step of most analysis procedures [3]. It is often important to separate regions or objects of interest from other parts of the body. If we can define the borders of the ROI (segment the image) we can often simplify the decisions [3]. It is also a crucial step that determines the final result of the entire application, since the rest of the analysis fully relies on the output from segmentation step. Any approaches for the segmentation proposed in literature vary widely depending on the specific application, imaging modality CT, MRI, US etc.), and other factors. The algorithm, which gives perfect results for one application, might not even work for another. Mostly, segmentation is semi-automatic and a seed point is needed.
Then, the structure is being segmented as exactly as possible, for example to measure its size, volume or form, in the case of a tumor. Even now a day’s researchers as well physician’s try to make this crucial step as easy as possible either with the help of automatic software tools or my means of any algorithm. In this paper, after discussing two most important imaging modalities CT and US, we have discussed and compared the outputs of CT lung and US thyroid segmentation using automatic tools as well as specific algorithm.
2.
MEDICAL IMAGE MODALITIES
Various medical imaging are available like MRI, CT, US, positron emission tomography (PET), etc. depending upon need, disease type and body organ. Here we will discuss the two most common imaging modality CT and US in details.
2.1
Computed Tomography (CT)
Fig 1: 322x 286 MRI Scan of chest showing cancer Fig 2: 1280x 1025 CT scan of 72 years old woman with lung cancer
2.2
Ultrasounds
Medical ultrasound, also called sonography, is a mode of medical imaging that has a wide array of clinical applications, both as a primary modality and as an adjunct to other diagnostic procedures. The basis of its operation is the transmission of high frequency sound into the body followed by the reception, processing, and parametric display of echoes returning from structures and tissues within the body. US are an ideal imaging modality for detection and assessment of a thyroid nodule. It is easy to perform, widely available and does not involve ionizing radiation. The use of high frequency transducers has significantly improved the spatial and
contrast
resolution in evaluating superficial structures including the thyroid gland.Ultrasound imaging of thyroid gland provides the ability to acquire valuable information for medical diagnosis. Physicians usually diagnose the pathology of the thyroid gland by its volume. However, even if the thyroid glands are found and the shapes are hand-marked from US images, most physicians still depend on CT images, which are expensive to obtain, for precise measurements of the volume of the thyroid gland and detection of nodules in it. This approach relies heavily on the experience of the physicians and is very time consuming. US imaging is thus one of the most commonly used auxiliary tools in clinical diagnosis. This test is helpful in determining if a thyroid nodule is solid or filled with fluid. It can also be used to check the number and size of thyroid nodules. Ultrasound features can sometimes suggest a nodule is likely to be cancerous, but can't predict malignancy for certain 0. Figure 3 shows the presence of nodule in US Thyroid image.
Fig 3: Ultrasound Image of Thyroid Showing Nodule
3.
PROBLEMS IN SEGMENTATION
Segmentation has an important role in medical imaging as it helps in extracting the organ of interest. For the diagnosis of lung it is necessary to segment the chest images and extracts the lungs and further the nodule. Following are the problems generally noticed while segmenting CT lung and US thyroid.
3.1
CT Lung
Here, we are listing some of the problems faced by physicians as well as the researchers while segmenting CT lung images: i. First, for Ground Glass Opacity (GGO) nodules [9] , the
low contrast and fuzzy margins make accurate segmentation of GGO very hard.
ii. Second, the usually long duration (one year for example) and the different conditions
between
two sets of CT scan cause large non-rigid deformation of lung, and intensity differences within the same tissue.iii. Thirdly, the large data size of high-resolution CT scanning can cause problems for 3D segmentation, due to the need of significant memory and computational resources.
iv. Inferior soft tissue contrast compared to MRI as it is X-ray-based.
v. Conventional methods of lung segmentation rely on a large gray value contrast between lung fields and surrounding tissues. These methods fail on scans with lungs that contain dense pathologies, and such scans occur frequently in clinical practice.
Despite of all the above problems, still segmentation of CT images plays an important role in final diagnosis of a disease especially nodule detection and growth.
3.2
US Thyroid
Despite of various advantages in using US images for detection of nodules there are few problems faced during segmentation as follows [10].
i. US imaging suffers from the presence of a granular pattern termed as speckle. Due to this finding accurate texture features for segmentation gets difficult.
ii. There are random fluctuations in the image’s intensity profile. Reverberation, shadowing, refraction, side and grating lobes deteriorate the resolution of the US image, thus degrade its overall quality. This cause extraction of spatial and statistical features difficult.
iii. During analyzing the image, muscles present in image may be misinterpreted as a nodule because it gives very similar visual effects in US images.
iv. Boundary of the image is not fixed as it is dependent on the angle of image taken.
[image:2.612.121.230.562.677.2]4.
SEGMENTATION
METHODS
FOR
LUNG CTS
For the detection of lung diseases generally X-rays of lungs are performed but for more details physicians recommend the CT scan of the patient’s lung. The purpose of the segmentation of the lung region in the CT image is to achieve a better orientation in the image. A lot of articles can be found regarding segmentation of the lung region in CT images. Now, it’s necessary to understand the lung structure before discussing how to segment the lung CT images.
Lung Structure
[image:3.612.322.549.75.183.2]The lung, the site of gas exchange, is filled with air that has a low density (about −1000 HU) on CT images. In addition to air, pulmonary vessels and bronchi are the principal constituents of the lung regions. Lung regions include the left and right lungs. The left lung is further separated into two lung lobes (upper lobe and lower lobe) by an oblique fissure. The right lung is separated into three lung lobes (upper lobe, middle lobe, and lower lobe) by oblique and horizontal fissures. The clinical CT image of the lung is shown in Figure 4 and its general anatomy is shown in Figure 5.
Fig 4: Clinical CT Image Fig 5: General anatomy of Human lung
4.1
Lung Segmentation Using Automatic
Tools
The preprocessing step of most CAD systems for identifying the lung diseases is lung segmentation. The goal of this step is to separate human body regions from background and make an initial classification showing the right and left lung clearly. After that for the detection of any lung disease it is further segmented to extract the exact ROI like nodules in the case of cancer detection [13] [14]. There can be more than one nodule in a lung, so that much number of segmentation steps has to be applied. In this paper, the outputs from various automatic tools like Analyze 10.0 [15], Mazda [16], YaDiv [17], and MATITK [18] on CT is discussed and compared. The results show that segmentation using these tools makes the segmentation process better, easier as well efficient.
4.1.1
Segmentation of Lung using Analyze
:
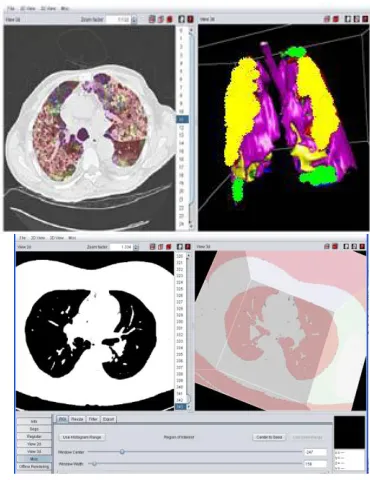
Analyze 10.0 is a powerful, comprehensive software package for multi-dimensional display, processing, and measurement of multi-modality biomedical images. The product of more than 25 years of biomedical imaging research and development at Mayo Clinic, this integrated, total solution allows us to significantly enhance our multidimensional biomedical imaging productivity [15]. Following figures, Figure 6(a)-6(d) shows the output from Analyze 10.0.
Fig 6 (a): Thresholding using Analyz Fig 6(b): Region filling using Analyze
Fig 6(c), (d): Original housefield value and labeling ROI; Nodule Detection using Analyze using Analyze
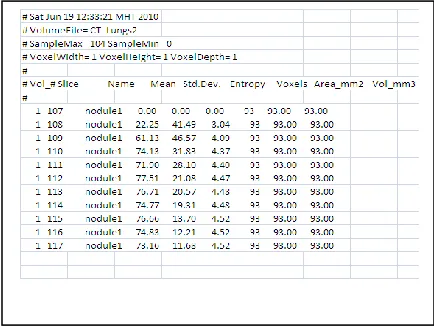
It can be seen that Analyze is an interactive as well user friendly tool as thresholding, region filling, ROI detection, ROI labeling is really very easy and fast. Figure6 (e) show the various low level features that can be extracted using Analyze. The output of Analyze can be easily exported to other platforms and make Analyze more flexible.
Fig 6 (e): Feature calculation using Analyze
4.1.2
Segmentation of lung using MaZda:
[image:3.612.313.550.228.331.2] [image:3.612.54.288.325.448.2] [image:3.612.323.540.453.616.2]
by the early version of the program were derived from the co-occurrence matrix. Consequently, the name of the program is an acronym derived from 'Macierz Zdarzen' that is the Polish counterpart of the English term 'co-occurrence matrix'. Mazda has proved to be an efficient and well known tool for liver [12], brain [12]. The output from these research shows that it has really helped the physicians to provide the right diagnosis at right time. Figure 7(a)-(e) shows the results of Mazda on chest CT scan. Figure 7(d) shows the few of low level features that can be extracted using MaZda out of 300 features.
Fig 7 (a): 8 ROI detection in chest CT Fig 7 (b): 3d view of chest CT
Fig 7 (c): 3d ROI detection of chest CT Fig 7 (d): List of features calculated by MaZda
4.1.3
Segmentation of Lung using Yadiv:
A recentdeveloped DICOM viewer YaDiV [2] has been evaluated for identification of various lung tissues as well as for efficient visualization of lung images. Segmentation of the lung volumes is a required preliminary step to lung tissue categorization. Since the geometries and shapes of the lungs are subject to large variations among the cases, semi–automatic segmentation based
on region growing and mathematical morphology is used. The range and region growing routine contained in YaDiv is tested. The resulting binary mask Mlung describes the global lung regions well but contains many holes where the region growing algorithm was stopped by denser regions. To fill these holes, a closing operation is applied to Mlung using a spherical structuring element. Then, based on the volumes of the segmented tissues and a set of selected clinical parameters, similar cases are retrieved from a multimedia database of ILD cases as shown in Figure 8 (a) and (b).
Fig 8 (a), (b): Lung segmentation from chest CT scan using YaDiv
As YaDiv is still under testing phase, so needs more algorithms to be embedded to make it more users friendly and fast.
4.1.4
Segmentation of Lung using MATITK:
ITK is [image:4.612.333.518.182.422.2] [image:4.612.54.285.200.314.2] [image:4.612.46.315.366.510.2]Fig 9: Watershed Segmentation of lung CT using MATITK for slice=11.
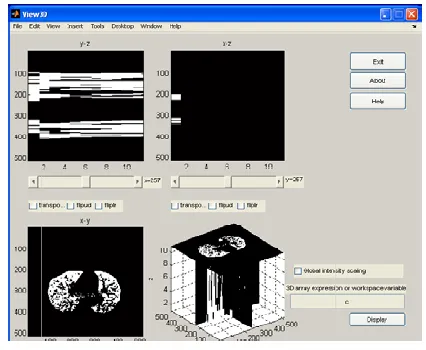
[image:5.612.327.549.133.294.2]Though MATITK can be used only on 3D images 0, but in Figure 9, only slice no 11 is shown with its segmentation. Using VIEW3D function we can see the segmentation of all the slices. It is evident through observation that the proposed system produces much smoother results than the schemes that have been used earlier. There is also no loss of lung nodules in this method. MATITK provides various other segmentation methods also like Levelset, Gardient Vector Flow and many more and all present comparable results. There is no mechanism available to see all the 3d slices in MATITK. View3d function has been used for the same as shown in Figure 10.
Fig 10: 3D view of MATITK results for ten slices.
4.2
Automatic Segmentation of Lung CT
For us, the goal is not to have a perfect segmentation but an algorithm that does not need manual intervention. It was not necessary to analyze all slices for 3D segmentation as our case database contains selected slices that represent certain pathology. On the other hand, there was no possibility to use information of connected slices to enhance the segmentation.The CT Images normally contains artifacts, noise which will not be suitable for further processing and hence it has to be pre-processed to reduce the noise. Following is the proposed technique which is applied to all the slices of chest CT to extract the lungs:
Fig 11: Lung segmentation from chest CT scan
Step1: Image enhancement using filters to remove noise and thresholding.
Step2: Background removal. Step3: Holes filling.
Step4: Get the original hounsefield values of lungs by bit Anding and multiplying with original image.
Figure 11 shows the results of the proposed methodology. The results show that a seed point is required to start the segmentation and also the results vary depending upon the type of image in hand.
5.
SEGMENTATION METHODS FOR
THYROID ULTRASOUND
Various modality images can be used for detection of thyroid diseases [14]. However, the interpretation of US images, as performed by the experts, is still subjective. An image analysis scheme for computer aided detection of thyroid nodules would contribute to the objectification of the US interpretation and the reduction of the misdiagnosis rates. US imaging is currently the most popular diagnostic tool. It is inexpensive and easy to use. Before discussing the segmentation techniques for thyroid US images, it’s necessary to understand its structure in details.
Structure of Thyroid Glands
[image:5.612.69.282.447.622.2]Fig 12: Structure of thyroid gland
Now, the segmentation of thyroid US images can be done in two ways.
1. Automatic Segmentation
2. Segmentation using Tools available
Both the methods are tried which will be briefed in the following sections and results were compared and analyzed.
5.1
Automatic Segmentation of thyroid US
This method is used for the process of segmentation of thyroid US due to following reasons:1. Finding probable thyroid region from the image.
2. Segmentation of thyroid region and detecting abnormalities.
5.1.1
Finding Probable Thyroid Region:
In a thyroid US image, the thyroid gland is always in the middle, below the bright part and above the dark part of the image. In 0, two reference values (R1 and R2) are defined to locate the probable thyroid region. R1 is the row index with the largest average intensity in the horizontal projection of the US image. R2 is the first row index with an average intensity of zero from the top to bottom in the horizontal projection of the US image. The probable thyroid region is located between the R1th row and the R2th row of the US thyroid image. An example of locating a probable thyroid region in an US thyroid image is shown in Figure 13.
[image:6.612.101.208.86.182.2]Fig 13: Probable Thyroid region
5.1.2
Segmentation
of
thyroid
region
and
detecting abnormalities:
Once the thyroid region islocated, we need to extract the thyroid region from the image [20] [21].
5.1.3
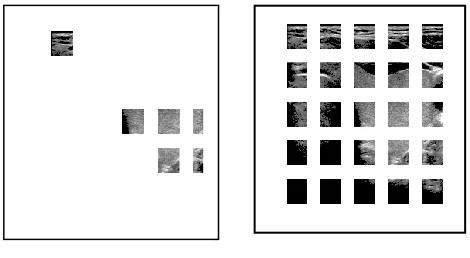
Fig 14(a): Image Divided into tiles Fig 14(b): Tiles of ROI Extracted
To perform this operation statistical features of thyroid glands are extracted. Local features always give more accurate regions. Hence the image is divided into number of tiles and only the tiles of ROI are extracted from the image and rest of the tiles are rejected as shown in Figure 14 (a)-(b).
By increasing the number of tiles we can make the output very close to the actual thyroid shape but it becomes very much time consuming and it also increases the memory base for further analysis. Texture features of these tiles are extracted for finding out the abnormalities, variations in the thyroid region. The Haar wavelet features are significant features for segmentation in US images. The mean and the variance of the low-low-frequency subband (LL band) were computed as follows.
Variance of LL band: Mean of LL band:
Feature Vector Table (FVT): FVT has been created for all the data base of US images as shown below. These features when fed to ANN it will be able to classify various diseases in thyroid. FVT= [H1, H2, …..H16, Mean, Std, LCV, Mean of LL, Variance of LL]
5.2
Thyroid
US
Segmentation
using
Automatic Tools
Ultra sound images of thyroid are not shape specific. The obvious reason is it is dependent on the angle by which image is taken. Different directions will produce different kind of images. Due to this segmentation becomes more critical. However texture of thyroid gland gives us very important information about nodules. Here two tools: Analyze 10.0 and Mazda are used for segmentation of thyroid US images as MATITK, YaDiv do not support 2D US images.
5.2.1
Segmentation of Thyroid US using Analyze:
Figure 15(a)-15(d) shows the output of using Analyze 10.0 on thyroid images.
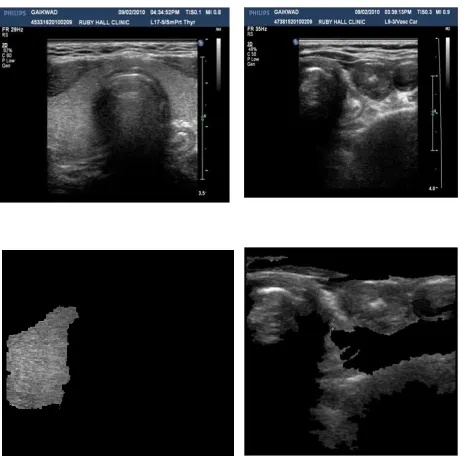
[image:6.612.79.262.487.607.2]5.2.2
Segmentation of US Thyroid using Mazda:
Figure 16 shows the result of segmentation using Mazda and also its features given by the tool. This tool helps in extracting the texture features which are very useful in finding the nature of nodules present in the thyroid glands.Fig 15 (a): US of normal Thyroid (b): US of abnormal Thyroid (c): Segmentation of normal Thyroid (d): Segmentation of abnormal Thyroid
Fig 16: Segmented Thyroid and Features analysis
6.
COMPARISON OF ALL THE TOOLS
USED
The following table (Table :1) shows the comparative analysis of all the results obtained either by automatic tools as well as by applying specific algorithm (automatic) segmentation on both lung CT as well as on thyroid US. From the table, it is concluded that automatic segmentation needs less manual intervention but needs more refinements like denoising and edge enhancements as well as 3D visualization problems whereas in automatic tools like Analyze , MazDa etc. no such problems exist but a little manual interaction is required as well as the cost involved is more. These tools are actually are the research oriented tools but their commercial editions are also available
[image:7.612.52.285.129.357.2]and hence are used successfully in various hospitals like Mayo Clinic, Rochester, Minnesota.
Table 1. Comparison between Tools
7.
CONCLUSION
Automatic tools actually make the segmentation task easier and flexible but these tools are commonly used in medical research and diagnosis. Moreover, the cost involved is more. Some of the tools like MATITK,YaDiv can be used only for 3D images like CT, MRI etc not for 2D like X-rays, US etc. Automatic segmentation method are little cumbersome and take more time and processing for segmentation. This paper basically provides a summary of existing automatic tools available to formulate the disease diagnosis part easier as well efficient. The future work is to develop new or improve the existing software tools to make the segmentation process easier and flexible for any modality.
Sr no
Analyze YaDiv Mazda MATITK Algorithm
1 Efficient ROI detection.
Exact ROI detection but time consuming. Efficient ROI detection . Efficient ROI detection but time consuming.
Efficiency is less in terms of noise and time.
2 For all kind of images i.e. 2D as well as 3D.
For all kind of images.
For all kind of images.
Only for 3D images.
For 2D images only.
3 Take any modality.
Take any modality.
Take any modality but efficient for MRI.
Take any modality but efficient for CT and MRI.
For X-rays and US.
4 Results can be easily exported. Less portable. Less portable.
Only for MATLAB.
Only for MATLAB.
5 Any number of ROI can be detected.
Any number of ROI can be detected.
Only 16 ROI can be detected at a time.
Any number of ROI can be detected.
[image:7.612.305.593.130.588.2] [image:7.612.62.281.405.523.2]8.
REFERENCES
[1] AM Hussain, G Packota, PW Major, C Flores-Mir, Role of
different imaging modalities in assessment of
temporomandibular joint erosions and osteophytes: a systematic review, Dentomaxillofacial Radiology (2008) 37, 63-71.
[2] Pradeep Singh; Sukhwinder Singh, Gurjinder Kaur (2008): A Study of Gaps in CBMIR using Different Methods and Prospective, Proceedings of world academy of science, engineering and technology, volume 36 , ISSN 2070-3740, pp. 492-496.
[3] Zhen Ma; João Manuel R. S. Tavares, R. M. Natal Jorge (2009): A review on the current segmentation algorithms for medical images, 1st International Conference on Imaging Theory and Applications (IMAGAPP), Lisboa, Portugal, INSTICC Press, pp. 135-140.
[4] K. Awai and et al. Pulmonary nodules at chest CT: Effect of computer-aided diagnosis on radiologist’s detection performance. Radiology, 230:347–352, 2004.
[5] K. G. Kim. Computer-aided diagnosis of localized ground-glass opacity in the lung at CT: Initial experience. Radiology, 237:657–661, 2005.
[6] P.Reeves, W. J. Kostis. Computer-aided diagnosis for lung cancer. Radiol. Clin. North Am., 38(3):497–509, 2000. [7] Nisar Ah med Memon, An war Majid Mirza, and
S.A.M. Gilani, Segmentation of Lungs from CT Scan Images forEar l y Diagn osis o f Lung Cancer, World Academy o f S cien ce, Engineerin g and Technology 20 2006, pp: 113 -118.
[8] Preeti Aggarwal, H.K. Sardana, Renu Vig, An Efficient Visualization and Segmentation of Lung CT scan Images for Early Diagnosis of Cancer, National Conference on Computational Instrumentation (NCCI-2010).
[9] Lew, John I; Rodgers, Steven E; Solorzano, Carmen C Developments in the use of ultrasound for thyroid cancer Current Opinion in Oncology: January 2010 - Volume 22 – Issue 1 - p 11-16.
[10]CE Engeler, JH Tashjian, SW Trenkner and JW Walsh, Ground-glass opacity of the lung parenchyma: a guide to analysis with high-resolution CT, American Journal of Roentgenology, Vol 160, 249-251.
[11]S. Tsantis, N. Dimitropoulos, D. Cavouras and G. Nikiforidis “A hybrid multi-scale model for thyroid nodule
boundary detection on ultrasound images”,Computer methods and Programs In Biomedicine, Volume 84, Issues 2-3, December 2006, Pages 86-98, Medical Image Segmentation Special Issue.
[12] K. G. Hollingsworth, D. J. Loma “Liver texture analysis: robustness of measurement in cirrhotic patients and healthy volunteers”, Proc. Intl. Soc. Mag. Reson. Med. 13 (2005): 332.
[13]Holli et al., Texture analysis of MR images of patients with Mild Traumatic Brain Injury BMC Medical Imaging 2010, 10:8.
[14]Alexander S. Behnaz, James Snider, Chibuzor Eneh et.al, “Quantitative CT for Volumetric Analysis of Medical Images: Initial Results for Liver Tumors”, Medical Imaging 2010, Proc. of SPIE Vol. 7623-76233U.
[15]Richard A. Robb, “The Biomedical Imaging Resource At Mayo Clinic- Guest Editorial”, IEEE TRANSACTIONS ON MEDICAL IMAGING, VOL. 20, NO. 9, SEPTEMBER 2001, pp: 854-867.
[16]Piotr M. Szczypiński, Michał Strzelecki, Andrzej Materka, Artur Klepaczko, “ MaZda-A software package for image texture analysis”, Elsevier, Computer Methods and Programs in Biomedicine, Volume 94 Issue 1, April, 2009, 66-76.
[17] K, K., & M, S. (2002). Patient-oriented Segmentation and Visualization of Medical Data. Computer, 214-219. [18]Vincent Chu and Ghassan Hamarneh, “MATLAB-ITK
Interface for Medical Image Filtering, Segmentation and Registration”, Medical Imaging 2006: Image Processing, Proc. of SPIE, Vol 6144, 61443T1-8.
[19]Alison G Abraham, Donald D Duncan, Stephen J Gange, Sheila West “Computer-aided assessment of diagnostic images for epidemiological research” BMC Medical Research Methodology 2009, 9:74doi:10.1186/1471-2288-9-74.
[20]Chuan-Yu Chang, Yue-Fong Lei, Chin-Hsiao Tseng. Shyang-Rong Shih Thyroid Segmentation and Volume Estimation in Ultrasound Images, IEEE TRANSACTIONS ON BIOMEDICAL ENGINEERING, VOL. 57, NO. 6, JUNE 2010.