In-cell thermodynamics and a new role for
protein surfaces
Austin E. Smith
a, Larry Z. Zhou
a, Annelise H. Gorensek
a, Michael Senske
b, and Gary J. Pielak
a,c,d,1aDepartment of Chemistry, University of North Carolina at Chapel Hill, Chapel Hill, NC 27599;bDepartment of Physical Chemistry II, Ruhr-Universität Bochum, 44780 Bochum, Germany;cDepartment of Biochemistry and Biophysics, University of North Carolina at Chapel Hill, Chapel Hill, NC 27599; anddLineberger Comprehensive Cancer Center, University of North Carolina at Chapel Hill, Chapel Hill, NC 27599
Edited by Martin Gruebele, University of Illinois at Urbana–Champaign, Urbana, IL, and approved December 14, 2015 (received for review September 21, 2015)
There is abundant, physiologically relevant knowledge about pro-tein cores; they are hydrophobic, exquisitely well packed, and nearly all hydrogen bonds are satisfied. An equivalent understand-ing of protein surfaces has remained elusive because proteins are almost exclusively studied in vitro in simple aqueous solutions. Here, we establish the essential physiological roles played by protein surfaces by measuring the equilibrium thermodynamics and kinetics of protein folding in the complex environment of living Escherichia colicells, and under physiologically relevant in vitro con-ditions. Fluorine NMR data on the 7-kDa globularN-terminal SH3 domain ofDrosophilasignal transduction protein drk (SH3) show that charge–charge interactions are fundamental to protein stability and folding kinetics in cells. Our results contradict predictions from accepted theories of macromolecular crowding and show that coso-lutes commonly used to mimic the cellular interior do not yield physiologically relevant information. As such, we provide the foun-dation for a complete picture of protein chemistry in cells.
protein NMR
|
protein thermodynamics|
protein folding|
in-cell NMRC
lassic theories about the effects of complex environments
consider only hard-core repulsions (volume exclusion) and
so predict entropy-driven protein stabilization (1-3). Here, we
use the 7-kDa globular
N
-terminal SH3 domain of
Drosophila
signal transduction protein drk (SH3) as a model to test this idea
in living cells. SH3 exists in a dynamic equilibrium between
the folded state and the unfolded ensemble (4). This two-state
behavior (5) is ideal for NMR-based studies of folding.
Fluorine labeling (6) of its sole tryptophan leads to only two
19F resonances (7): one from the folded state, the other from
the unfolded ensemble (Fig. 1
A
). The area under each resonance
is proportional to its population,
ρ
fand
ρ
u,respectively. These
populations are used to quantify protein stability via the
modi-fied standard state free energy of unfolding,
Δ
G
°′U,T=
−RT
ln
ρ
Uρ
F,
[1]
where
R
is the gas constant and
T
is the absolute temperature.
Furthermore, the width at half height of each resonance is
pro-portional to the transverse relaxation rate, which is an
approx-imate measure of intermolecular interactions (8–10). Thus, this
simple system yields both quantitative thermodynamic
knowl-edge and information about interactions involving the folded
state and the unfolded ensemble.
To assess the enthalpic (
Δ
H
U°′) and entropic (
Δ
S
°′U) components,
we measured the temperature dependence of
Δ
G
°′U. These data
were fitted to the integrated Gibbs–Helmholtz equation (11),
as-suming a constant heat capacity of unfolding,
Δ
C
°p,U
:
Δ
G
°′U,T=
Δ
H
U°′,Tref−
T
Δ
S
°′
U,Tref
+
Δ
C
°′ p,U
T
−
T
ref−
T
ln
T
T
ref,
[2]
where
T
refis either the melting temperature,
T
m(where
ρ
f=
ρ
u), or
the temperature of maximum stability,
T
s(where
Δ
S
°′U=
0) (11).
Results and Discussion
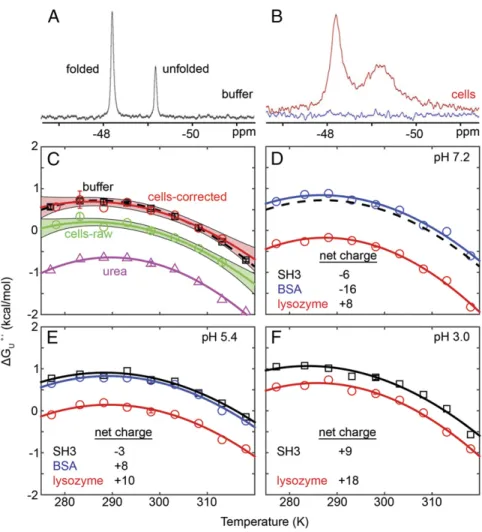
Stability in Buffer.
In buffer at pH 7.2 and 298 K,
Δ
G
°′Uis 0.52
±
0.03 kcal/mol,
Δ
H
U°′is 10
±
1 kcal/mol,
T
Δ
S
°′Uis 10
±
1 kcal/mol, and
Δ
C
°′p,Uis 0.87
±
0.06 kcal/mol/K (Fig. 1
C
and
SI Appendix
, Tables S1
and S2
).
Δ
G
°′Uis concentration independent from 11
μ
M to 1.1 mM
(
SI Appendix
, Fig. S1
) and consistent with reported values (4, 7).
Δ
C
°′p,Uis also consistent with predictions (11, 12).
Stability in Cells.
Spectra were then acquired in
E. coli
(Fig. 1
B
).
We know from cell lysate spectra that a
19F-labeled metabolite is
present under the peak from the unfolded ensemble (Fig. 2).
Two approaches were used to account for this metabolite in
calculations of
Δ
G
°′U, T.
At one extreme, no correction was made, such that the
equilib-rium constant for unfolding equals the area of the composite in-cell
(IC) unfolded peak (
R
U
IC) over the area of the folded form (
R
F
IC):
Δ
G
°′U,raw=
−RT
ln
R
U
ICR
F
IC.
[3]
This approach overestimates the population of the unfolded
ensemble, and thus gives a minimum value for
Δ
G
°′U, T(Eq.
3
,
green curve in Fig. 1
C
).
The second method accounts for the metabolite by using the
following equations, which are described below:
U
frac=
R
U
lysateR
U
lysate+
R
M
lysate,
[4]
Δ
G
°′U,corr=
−RT
ln
R
U
IC−
R
S
×
U
fracR
F
IC.
[5]
The first step removes the contribution from any leaked metabolite.
This was accomplished by examining the supernatant spectrum,
Significance
Understanding protein thermodynamics as it occurs inside cells is a fundamental goal of biophysics, and, from a practical point of view, will facilitate the design and improvement of protein-based drugs and catalysts. By measuring the temperature dependence of protein stability insideEscherichia colicells, we show, contrary to predictions, that proteins are not necessarily stabilized inside cells compared with buffer alone. We also show that crowding-induced charge–charge interactions slow folding because of pref-erential interactions with the unfolded ensemble, and reducing these interactions increases protein stability.
Author contributions: A.E.S. and G.J.P. designed research; A.E.S., L.Z.Z., A.H.G., and M.S. performed research; A.E.S., L.Z.Z., A.H.G., M.S., and G.J.P. analyzed data; and A.E.S., L.Z.Z., A.H.G., M.S., and G.J.P. wrote the paper.
The authors declare no conflict of interest.
This article is a PNAS Direct Submission. See Commentary on page 1684.
1To whom correspondence should be addressed. Email: [email protected].
This article contains supporting information online atwww.pnas.org/lookup/suppl/doi:10. 1073/pnas.1518620113/-/DCSupplemental.
CHEMISTR
Y
SEE
COM
which does not contain any SH3 protein, folded or unfolded. The
area of the metabolite resonance in the supernatant spectrum
(
R
S
, Fig. 2
B
and
E
) was subtracted from the area of the
com-posite peak in the in-cell spectrum (
R
U
IC) to yield
R
U
IC−
R
S
.
The second step estimates
U
frac(Eq.
4
), the fraction of the
com-posite in-cell peak,
U
IC, that represents the unfolded ensemble.
This estimation was accomplished by using the spectrum of the
cell lysate (Fig. 2
C
and
F
), which contains resolved peaks for the
metabolite plus the unfolded ensemble in the lysate. The ratio of
the area of the unfolded peak (
R
U
lysate) to the total upfield peak
[
R
(
U
lysate+
M
lysate)] provides
U
frac(Eq.
4
). The product of the two
terms [(
R
U
IC−
R
S
) *
U
frac] divided by the area from the
reso-nance of the folded form in cells (
R
F
IC) gives a
metabolite-cor-rected approximation of the equilibrium constant that was used
to estimate
Δ
G
°′U, Tin cells (Eq.
5
, red curve in Fig. 1
C
).
Using
U
fracto correct the in-cell data is only an approximation
because it assumes the population of the unfolded ensemble does not
change on cell lysis. This approach probably overestimates
Δ
G
°′U, T(gives the maximum stability,
“cells-corrected”
in Fig. 1
C
) because
in vitro studies with protein crowders as well as in-cell studies show
that destabilizing weak attractive interactions often dominate
stabi-lizing hard-core excluded volume effect (13–15). We expect the true
Δ
G
°′U, Tlies between the two values.
Both curves indicate that SH3 is not stabilized in cells (Fig. 1
C
).
T
mand
Δ
G
°′Ueither decreased or were unchanged compared with
buffer (
SI Appendix
, Tables S1 and S2
), consistent with other
studies,(13, 15–18) but inconsistent with previously accepted
crowding theory (1, 2).
Δ
C
°′p,Uis the same in buffer and in cells (
SI
Appendix
, Table S1
). The stability decrease from the uncorrected
data (0.53
±
0.07 kcal/mol at 298 K) arises from a decrease in
Δ
H
U°′(
SI Appendix
, Table S3
), which is also inconsistent with theory. The
corrected data indicate no change in
Δ
H
U°′, T. Further, diluted cell
lysates and 100 g
dry/L reconstituted lysate (14, 19) had little effect
on SH3 stability (
SI Appendix
, Fig. S2
). Because stabilizing
hard-core repulsions are always present, our data show that these
re-pulsions can be completely offset by attractive interactions in cells.
Charge–Charge Interactions.
To probe electrostatic interactions
between SH3 (pI
calc5, Fig. 1
D
–
F
) and protein crowders, we then
performed in vitro experiments at several pH values in 100-g/L
solutions of BSA (66 kDa, pI
calc6) or lysozyme (14 kDa, pI
calc9).
At pH 7.2, lysozyme destabilized SH3 relative to buffer
(
ΔΔ
G
°′U,298 K=
−
0.92
±
0.03 kcal/mol, Fig. 1
D
) and broadened its
resonances (Fig. 3
A
and
SI Appendix
, Table S2
). We attribute both
effects primarily to attractive, nonspecific, charge–charge
interac-tions between the protein surfaces. Consistent with this idea, adding
Fig. 1. Fluorine spectra acquired at 298 K, in buffer (A) and cells (B). The blue trace is from the postexperiment supernatant and shows that the red spectrum
0.15 M NaCl to screen the charge–charge interaction decreased
both the destabilization (
ΔΔ
G
°′U,298 K=
−
0.70
±
0.03 kcal/mol)
and line width (
SI Appendix
, Table S2
). BSA, which has a
net charge similar to SH3 at this pH, was slightly stabilizing
(
ΔΔ
G
°′U, 298 K=
0.09
±
0.06 kcal/mol) and caused weak
broad-ening, as expected for proteins having the same net charge (3).
We then decreased the pH to 5.4. SH3 is a polyanion at both pH
7.2 and 5.4, lysozyme remains a polycation but with a lower net
positive charge, and BSA changes from a polyanion to polycation.
Lysozyme is less destabilizing (
ΔΔ
G
°′U,298 K=
−
0.76
±
0.09 kcal/mol,
Fig. 1
E
) at the lower pH, whereas BSA changes from slightly
sta-bilizing to having no effect on stability. In addition, lysozyme causes
less broadening at the lower pH, whereas BSA causes more
broadening. All these observations reinforce the idea that
charge–charge interactions play a key role in modulating
stabil-ity. However, hydrogen bonds, weakly polar interactions, and
hydrophobicity (20) must also contribute to attractive
intermo-lecular interactions because at pH 3.0 (Fig. 1
F
), lysozyme and
SH3 are both positively charged, yet SH3 remains destabilized
(
ΔΔ
G
°′U,298 K=
−
0.39
±
0.05 kcal/mol).
Synthetic Polymer and Their Monomers are Not Biologically Relevant.
The sucrose-, glucose-, and ethylene-glycol–based polymers, Ficoll,
dextran, and PEG, respectively, have been used for decades to
Fig. 2. Correcting for in-cell and supernatant metabolite. (A) In-cell19F spectrum showing integration regions for the folded (F
IC) and unfolded/metabolite (UIC) peaks at 298 K. (B) Supernatant spectrum showing integration region for leaked metabolite (S). (C) Spectrum of lysed and diluted in-cell sample. (We always use the spectrum of the lysate from the corresponding in-cell sample.) A peak for the folded state (Flysate), unfolded ensemble (Ulysate), and a me-tabolite (Mlysate) are observed. (D–F) Spectra at 318 K.
Fig. 3. Tumbling and folding. Symbol size reflects the uncertainty. (A) Resonance broadening. (B) Tumbling times. (C) Folding rates (100 g/L lysozyme, BSA
and urea, and 300 g/L Ficoll, pH 7.2, 298 K).
CHEMISTR
Y
SEE
COM
mimic the cellular interior (2). Contrary to what is observed in cells
(Fig. 1
C
), the polymers stabilize SH3 relative to buffer (Fig. 4 and
SI Appendix
, Tables S1
–
S3
). Furthermore, the monomers are more
stabilizing than the polymers, the opposite of what is usually
im-plied by the term
“macromolecular crowding”
(21). In addition,
theory predicts that stabilization arises from entropic effects, yet
ethylene glycol and PEG stabilize SH3 enthalpically, whereas the
sugar-induced stabilization is entropic. Clearly, synthetic polymers
are poor mimics of the cellular interior, and existing theories need
to be modified. The modifications must account for nonspecific
chemical attractions that act enthalpically to destabilize the protein
and nonspecific repulsive chemical interactions that act
enthalpi-cally to stabilize the protein (22). The picture is even more
com-plicated because the accounting must also consider solvent (23),
including its size relative to the crowding molecules (21).
Biologically Relevant Crowders Interact More Strongly with the
Unfolded Ensemble.
Resonance broadening (Fig. 3
A
) is only an
approximate measure of attractive intermolecular interactions. To
obtain more detailed knowledge, we used
19F relaxation data to
es-timate tumbling times (
τ
m) (10) of SH3 under crowded conditions.
In buffer,
τ
mis 4 ns/rad for the folded state and 3 ns/rad for the
unfolded ensemble (Fig. 3
B
and
SI Appendix
, Table S4
), similar
to published values (24). Ficoll (300 g/L) increases
τ
mfourfold
and fivefold for the folded state and unfolded ensemble,
re-spectively. These increases likely arise from an increase in
mi-croscopic viscosity (19). The viscosity of the 100 g/L lysozyme
solution is only 1.3 times that of water (19), yet
τ
mincreases
5-fold (folded state) and 13-fold (unfolded ensemble). BSA at
100 g/L has a similar viscosity, yet increases
τ
m3-fold (folded
state) and 25-fold (unfolded ensemble). The large effect on the
unfolded ensemble suggests that interactions with the unfolded
ensemble cause the stability changes shown in Fig. 1.
Folding and Unfolding Rates Confirm Preferential Interactions of
Biologically Relevant Crowders with the Unfolded Ensemble.
We
also quantified folding and unfolding rates (Fig. 3
C
and
SI
Ap-pendix
, Table S5
). Rate data were acquired in BSA, lysozyme,
urea (all at 100 g/L), and Ficoll (300 g/L). Ficoll decreased the
folding and unfolding rates threefold. Slower folding is
consis-tent with the viscosity increase. Slower unfolding in Ficoll is
consistent with both viscosity and an entropic pressure for
pro-tein compaction (25, 26); however, limiting the explanation to
viscosity and compaction effects is probably too simple. In
con-trast, BSA had only small effects, whereas lysozyme slowed
folding fivefold but had no effect on unfolding. Like lysozyme,
urea slowed folding fivefold, but increased unfolding threefold.
We speculate that urea’s small size allows it to penetrate the
folded state to speed unfolding, while its interaction with the
backbone in the unfolded ensemble slows folding, whereas
ly-sozyme is too large to penetrate and affect unfolding, but slows
folding via the aforementioned interactions with the unfolded
ensemble. These observations reinforce the idea that biologically
relevant conditions can destabilize proteins by facilitating
fa-vorable interactions with the unfolded ensemble.
Conclusions
Our data show that physiologically relevant information about
protein exteriors has been hidden because proteins are studied in
buffer instead of in cells. This limitation does not matter for
protein cores; they yield relevant information in buffer because
interior atoms experience the same environment in cells as they
do in buffer––they are surrounded by other protein atoms.
Ex-teriors are fundamentally different. In buffer, the surface is
ex-posed to mostly water, but the cytoplasm is dramatically complex
and crowded (27). The data indicate that crowding proteins
in-teract with test protein surfaces, and these inin-teractions affect
both the equilibrium and kinetics of folding. Although synthetic
polymers are important in industrial applications, they are poor
models of the cellular interior. Our data also show that theories
to explain protein behavior in cells must consider the folded
state, the unfolded ensemble, and include terms for hard-core
repulsions, solvation, hydrogen bonds, charge–charge-,
hydro-phobic-, and weakly polar interactions, all of which contribute to
the enthalpic and entropic components of crowding effects.
Recent modifications to theory (22), as well as simulations of
intracellular dynamics, are pointing the way (27). Most
im-portantly, our data, and those of others (13, 15–18), show that
studying protein folding in living cells is key to gaining
informa-tion needed to understand the many roles of proteins in biology.
Materials and Methods
Protein Expression for In-Cell NMR.Plasmids harboring the gene encoding SH3
were transformed into Agilent BL21 DE3 Gold cells by heat-shock. A single colony was used to inoculate a 5-mL culture of Lennox broth (10 g/L tryptone, 5 g/L yeast extract, 5 g/L NaCl) supplemented with 100μg/mL ampicillin. The culture was incubated with shaking at 37 °C (New Brunswick Scientific Innova I26, 225 rpm). After 8 h, 50μL of the saturated culture was used to inoculate 50 mL of supplemented M9 media (50 mM Na2HPO4, 20 mM KH2PO4, 9 mM NaCl, 4 g/L glucose, 1 g/L NH4Cl, 0.1 mM CaCl2, 2 mM MgSO4, 10 mg/L thiamine, 10 mg/L biotin, and 150 mg/L ampicillin, pH 7.4).
The 50-mL culture was shaken at 37 °C overnight. The culture was then diluted to 100 mL with supplemented M9 media. Five-fluoroindole (in dimethyl sulfoxide) was added to a final concentration of 0.1 g/L, and the culture was shaken for 30 min. Isopropylβ-D-1-thiogalactopyranoside (IPTG, 1 mM final
Fig. 4. Synthetic polymers and their monomers. (A) Glucose and dextran, (B) sucrose and Ficoll (all at 300 g/L), (C) ethylene glycol, 8 kDa PEG, and 35 kDa PEG
concentration) was used to induce expression. After 45 min, cells were pel-leted at 1,000×gand resuspended in M9 media without 5-fluoroindole, and expression was again induced to ensure efficient incorporation of the label. After 45 min, the cells were pelleted at 1,000×gand washed three times with in-cell NMR buffer (200 mM Hepes, 100 mM bis-Tris propane, 50μg/mL chloramphenicol, 150μg/mL ampicillin, pH∼7.6). Chloramphenicol was used to halt protein expression before NMR. Cell pellets were resuspended in 300μL of in-cell NMR buffer and loaded into standard 5-mm NMR tubes. Typical cell slurries were 50% wet cells by volume.
Protein Expression for Purification.Transformation and growth were
per-formed as described in the first paragraph of the previous section. The 50-mL cultures were shaken at 37 °C overnight, diluted to 1 L with supplemented M9 media, and shaken until the optical density at 600 nm reached 0.6. Five-fluoroindole was added (0.1 g/L final concentration) and the culture shaken for an additional 30 min. IPTG (1 mM final concen-tration) was used to induce expression. After 1 h, cells were pelleted at 1,000g at 10 °C for 30 min, resuspended in 50 mM Tris (pH 7.5), and frozen at−80 °C.
Protease inhibitors [Sigma-Aldrich P-2714, containing 4-(2-aminoethyl) benzenesulfonyl fluoride, aprotinin, bestatin, E-64, EDTA, and leupeptin] were added before lysis. Cells were lysed by sonication (Fisher Scientific Sonic Dismembrator model 500, 15% amplitude, 15 min, 67% duty cycle) on ice. Cell debris was removed by centrifugation at 16,000×gat 10 °C for 30 min, and the sample was passed through a 0.45-μm filter. Purification involved two chromatography steps using a GE AKTA FPLC. The first step was anion exchange (GE Q column, 5–45% gradient, 50 mM Tris wash buffer, 50 mM Tris/1 M NaCl eluant buffer, pH 7.5). SH3 binds weakly to anion exchange media. Protease inhibitors were added to the SH3-containing fractions, and the sample was passed through a 0.22-μm filter. The second step was size exclusion chromatography (GE Superdex 75 column eluted with 50 mM K2HPO4, 150 mM NaCl, 1 mM EDTA, pH 7.2). Purified protein was dialyzed against 17 MΩcm−1H2O for 4 h at room temperature and/or overnight at 5 °C. Buffer was changed every 1.5–2 h. After dialysis and fil-tration through a 0.22-μm filter, the sample was flash frozen in a dry-ice/ ethanol bath and lyophilized for 12 h (Labconco FreeZone). Mass spectral analysis showed a single mass of 6,880 Da, consistent with expected mass of the fluorine-labeled protein, indicating the absence of the metabolite ob-served in cells (see below).
NMR.In-cell samples were prepared as described above. For in vitro ex-periments, purified fluorine-labeled protein was added to NMR buffer (50 mM acetic acid/sodium acetate, Hepes, bis-Tris propane, pH 7.2) containing the stated concentration of cosolute. The concentration of BSA/lysozyme was verified by UV-visible spectroscopy (NanoDrop ND-1000). Polymer and lysate crowders were weighed (Ohaus PA64). One experiment used NMR buffer plus 150 mM NaCl, to assess salt dependence. Fluorine spectra were acquired at 4 °C (5 °C for in-cell experiments), 10 °C, 15 °C, 20 °C, 25 °C, 30 °C, 35 °C, 40 °C, and 45 °C with a Bruker Avance III HD spectrometer operating at a19F Larmor frequency of 470 MHz running Topspin Version 3.2 and equipped with a Bruker QCI cryoprobe. Resonances were referenced to trifluoroacetic acid (0.1%) in D2O placed in a coaxial insert inside the NMR tube. The D2O also served to lock the spectrometer. The temperature was calibrated with a two-point standard curve using deuterated methanol. The total relaxation delay for one-dimensional experiments was 5 s. The sweep width was 70 ppm. The number of scans depended on cosolute and ranged from 32 to 256. Carr–Purcell–Meiboom–Gill-based spin–spin relaxation time (T2) measurements used mixing times (tmix) of 1.0, 2.1,4.2 (×3), 6.3, 8.4, 16.8, 33.5, and 67.0 ms. A 955-Hz effective field was used to negate effects of chemical exchange. The transmitter was placed on-resonance to prevent ineffective refocusing. Spin-lattice relaxation times (T1) were measured using an inversion recovery sequence [tmix: 0, 0.05 (×3), 0.10, 0.25, 0.50, 0.80, 1.00, and 1.50 s]. A Bruker library NOESY experiment [tmix: 1.5, 50, 90, 150, 225, 300, 600, and 1,000 ms for buffer and 1.5, 70, 140 (×3), 210, 300, 500, and 800 ms for crowded samples] with a 2-s re-laxation delay was used to measure folding/unfolding rates. Sweep widths were 70 ppm in both dimensions; 1,024 complex points were collected duringt2with 64 or 72 complex points int1at eachtmix. Sixteen transients were acquired per increment.
Fluorine spectra were acquired before and after the relaxation and ex-change experiments to assess sample integrity and reversibility. Populations of the folded and unfolded states remained constant, or the dataset was discarded. For the in-cell samples, the cell slurry was removed after the experiment and gently pelleted. The supernatant was diluted twofold. The cells were resuspended in 0.4 mL of in-cell NMR buffer plus protease
inhibitors, lysed by sonication, and clarified at 16,000×g. Spectra were ac-quired on the supernatant to assess protein leakage and on the lysates to assess the effect of lysates on stability. No protein leakage was observed.
Data Processing.Data were processed with Topspin 3.2. For temperature
variation experiments, free induction decays (fids, 50,000 points each) were subjected to a 10–15-Hz broadening function before zero filling (to 131,000 points) and Fourier transformation. ForT1andT2experiments, fids (50,000 points) were subjected to a 10- to 15-Hz broadening function before zero-filling to 131,000 points. For exchange spectroscopy,t2data (1,024 complex points) were subjected to a cosine-squared bell function before zero filling to 4,096 points.t1data were linear predicted to 256 points before applica-tion of a cosine-squared bell funcapplica-tion. Subsequent zero filling to 512 points and Fourier transformation yielded the final spectra.
Resonance intensities were extracted for relaxation experiments. For temperature variation experiments, peaks were integrated. Peak volumes were fitted as described. Published assignments were used (7).
FluorineT1(1/R1) andT2(1/R2) data were fit using Model Free formalism to calculate rotational correlation times (τm) (28, 29). The internal correlation time (τe) and the order parameter (S2) were set to 20 ps and 0.82 for the folded state and 1,200 ps and 0.34 for the unfolded state, respectively (24). Chemical shift anisotropy and asymmetry terms were set to −93.5 ppm and 0.24, respectively (30). Noμs-ms motion was observed in buffer, and a 950-Hz effective field was used for the R2 measurements. Therefore, chemical exchange was not included in fitting. The average19F-1H distances (r) andτmwere then minimized based on fitting theR1andR2data.
Analysis of Uncertainties.Triplicate datasets, using three different batches of
purified protein, were acquired for the pH 7.2 buffer dataset. The sample SDs depended on temperature (±52 cal/mol, ±45 cal/mol, ±59 cal/mol, ±31 cal/mol,±31 cal/mol,±66 cal/mol,±61 cal/mol,±14 cal/mol,±35 cal/mol at 4 °C, 10 °C, 15 °C, 20 °C, 25 °C, 30 °C, 35 °C, 40 °C, and 45 °C, respectively). For buffer, we used these SDs to drive Monte Carlo error analysis. One thousand randomly generated datasets were fitted to the integrated Gibbs–Helmholtz equation atTref. To extrapolateH°U′, TrefandΔS
°′
U, Tref, and their uncertainties, to 298 K, the average and sample SDs ofΔH°′
U, Tref,Tref, andΔC
°′
p,Ufrom this
analysis were used to drive another Monte Carlo analysis (n=106) using Kirchhoff’s relations. The uncertainties inΔH°′
U, 298 KandΔSU°′, 298 Kare larger
than the uncertainty in ΔG°′
U, 298 K because the enthalpy and entropy of
unfolding are derived from for three variables (ΔH°′
U, Tref,Tref, andΔC
°′
p,U) and
their uncertainties.
For the in-cell data, a similar method was used. Triplicate data were obtained for the 10 °C, 25 °C, and 40 °C datasets. For the other datasets uncertainties from the nearest-neighbor triplicate dataset were used to drive the analysis. For example, the 5 °C and 15 °C used the uncertainty associated with the 10 °C dataset.
For in vitro experiments in the presence of crowders, triplicate 25 °C data were acquired on the same sample. The SD was used to scale the uncer-tainties at other temperatures based on the SDs of the buffer dataset. These scaled values were used to drive the Monte Carlo analysis.
For in vitro relaxation rates, one mixing time was acquired three times. The sample SD was used to drive Monte Carlo analysis (n=1,000) to obtainR1and R2. The mean and SDs from this analysis were used to drive another Monte Carlo analysis (n=1,000) using the Model Free approach (28, 29) to obtainr, τm, and their uncertainties. Fittedrvalues varied from 1.8 to 2.1 Å for the folded state and from 2.0 to 2.4 Å for the unfolded state.
Folding rate data in buffer were acquired in triplicate and fitted as described (31). The uncertainty is the sample SD. For in vitro folding rates, one mixing time was acquired three times. The sample SD was used to drive Monte Carlo analysis (n=100). For folding rates,R1was fixed to the value acquired from inversion recovery experiments for in vitro crowded conditions.
In-Cell pH.Purified protein was resuspended in 50 mM citrate, 50 mM bis-Tris
propane, 50 mM Hepes, 50 mM borate, 5% D2O, 0.1% DSS (pH values: 5.0, 5.8, 6.5, 6.9, and 7.5). Data were acquired from 10 °C to 40 °C in 5 °C in-crements. The difference in the19F chemical shifts between the two states is sensitive to pH (SI Appendix, Fig. S3). These experiments were combined with two NMR buffer experiments [50 mM acetate, 50 mM Hepes, 50 mM bis-Tris at pH 7.2 (with and without 0.15 M NaCl)] to assess salt effects, which were minimal. The shift change as a function of pH was fitted to a second-order polynomial to produce a standard curve. Shift differences from in-cell data sets were then compared with this standard curve to obtain the pH in cells. The pH in cells, 7.2, compares favorably to the external meter reading minus 0.4 pH units, as previously described (32, 33).
CHEMISTR
Y
SEE
COM
ACKNOWLEDGMENTS.We thank Linda L. Spremulli for inspiring us to study protein in cells, Paul J. Sapienza and Andrew L. Lee for assistance with relaxation analysis, Alex J. Gusman for help with mass spectrometry, Matthew R. Redinbo and Elizabeth Pielak for helpful comments, and Gregory B. Young
for spectrometer maintenance. This work was supported by the National Sci-ence Foundation (MCB 1410854) and the Cluster of ExcellSci-ence RESOLV (EXC1069) funded by the Deutsche Forschungsgemeinschaft. M.S. acknowl-edges financial support from the Verband der Chemischen Industrie.
1. Minton AP (1981) Excluded volume as a determinant of macromolecular structure and reactivity.Biopolymers20(10):2093–2120.
2. Ellis RJ (2001) Macromolecular crowding: Obvious but underappreciated.Trends Biochem Sci26(10):597–604.
3. Sarkar M, Li C, Pielak GJ (2013) Soft interactions and crowding.Biophys Rev5(2): 187–194.
4. Zhang O, Forman-Kay JD (1995) Structural characterization of folded and unfolded states of an SH3 domain in equilibrium in aqueous buffer.Biochemistry34(20): 6784–6794.
5. Anfinsen CB (1973) Principles that govern the folding of protein chains.Science
181(4096):223–230.
6. Crowley PB, Kyne C, Monteith WB (2012) Simple and inexpensive incorporation of 19F-tryptophan for protein NMR spectroscopy.Chem Commun (Camb)48(86): 10681–10683.
7. Evanics F, et al. (2006) Tryptophan solvent exposure in folded and unfolded states of an SH3 domain by19F and1H NMR.Biochemistry45(47):14120–14128.
8. Li C, Pielak GJ (2009) Using NMR to distinguish viscosity effects from nonspecific protein binding under crowded conditions.J Am Chem Soc131(4):1368–1369. 9. Li C, Wang Y, Pielak GJ (2009) Translational and rotational diffusion of a small
globular protein under crowded conditions.J Phys Chem B113(40):13390–13392. 10. Ye Y, et al. (2013)(19)F NMR spectroscopy as a probe of cytoplasmic viscosity and weak
protein interactions in living cells.Chemistry19(38):12705–12710.
11. Becktel WJ, Schellman JA (1987) Protein stability curves. Biopolymers 26(11): 1859–1877.
12. Gómez J, Hilser VJ, Xie D, Freire E (1995) The heat capacity of proteins.Proteins22(4): 404–412.
13. Monteith WB, Cohen RD, Smith AE, Guzman-Cisneros E, Pielak GJ (2015) Quinary structure modulates protein stability in cells. Proc Natl Acad Sci USA112(6): 1739–1742.
14. Sarkar M, Smith AE, Pielak GJ (2013) Impact of reconstituted cytosol on protein sta-bility.Proc Natl Acad Sci USA110(48):19342–19347.
15. Danielsson J, et al. (2015) Thermodynamics of protein destabilization in live cells.Proc Natl Acad Sci USA112(40):12402–12407.
16. Ebbinghaus S, Dhar A, McDonald JD, Gruebele M (2010) Protein folding stability and dynamics imaged in a living cell.Nat Methods7(4):319–323.
17. Inomata K, et al. (2009) High-resolution multi-dimensional NMR spectroscopy of proteins in human cells.Nature458(7234):106–109.
18. Ignatova Z, et al. (2007) From the test tube to the cell: Exploring the folding and aggregation of aβ-clam protein.Biopolymers88(2):157–163.
19. Wang Y, Li C, Pielak GJ (2010) Effects of proteins on protein diffusion.J Am Chem Soc
132(27):9392–9397.
20. Wang Q, Zhuravleva A, Gierasch LM (2011) Exploring weak, transient protein–protein interactions in crowdedin vivoenvironments by in-cell nuclear magnetic resonance spectroscopy.Biochemistry50(43):9225–9236.
21. Sharp KA (2015) Analysis of the size dependence of macromolecular crowding shows that smaller is better.Proc Natl Acad Sci USA112(26):7990–7995.
22. Sapir L, Harries D (2015) Is the depletion force entropic? Molecular crowding beyond steric interactions.Curr Opin Colloid Interface Sci20(1):3–10.
23. Sukenik S, Sapir L, Gilman-Politi R, Harries D (2013) Diversity in the mechanisms of cosolute action on biomolecular processes.Faraday Discuss160:225–237, discussion 311–327.
24. Farrow NA, Zhang O, Forman-Kay JD, Kay LE (1995) Comparison of the backbone dynamics of a folded and an unfolded SH3 domain existing in equilibrium in aqueous buffer.Biochemistry34(3):868–878.
25. Hong J, Gierasch LM (2010) Macromolecular crowding remodels the energy landscape of a protein by favoring a more compact unfolded state.J Am Chem Soc132(30): 10445–10452.
26. Ai X, Zhou Z, Bai Y, Choy W-Y (2006)15N NMR spin relaxation dispersion study of the molecular crowding effects on protein folding under native conditions.J Am Chem Soc128(12):3916–3917.
27. McGuffee SR, Elcock AH (2010) Diffusion, crowding and protein stability in a dynamic molecular model of the bacterial cytoplasm.PLOS Comput Biol6(3):e1000694. 28. Lipari G, Szabo A (1982) Model-free approach to the interpretation of nuclear
magnetic resonance relaxation in macromolecules. 1. Theory and range of validity.
J Am Chem Soc104(17):4546–4559.
29. Lipari G, Szabo A (1982) Model-free approach to the interpretation of nuclear magnetic resonance relaxation in macromolecules. 2. Analysis of experimental results.
J Am Chem Soc104(17):4559–4570.
30. Luck LA, Vance JE, O’Connell TM, London RE (1996)19F NMR relaxation studies on 5-fluorotryptophan- and tetradeutero-5-fluorotryptophan-labeled E. coli glucose/ galactose receptor.J Biomol NMR7(4):261–272.
31. Farrow NA, Zhang O, Forman-Kay JD, Kay LE (1994) A heteronuclear correlation ex-periment for simultaneous determination of15N longitudinal decay and chemical exchange rates of systems in slow equilibrium.J Biomol NMR4(5):727–734. 32. Smith AE, Zhou LZ, Pielak GJ (2015) Hydrogen exchange of disordered proteins in
Escherichia coli.Protein Sci24(5):706–713.
33. Waudby CA, et al. (2013) In-cell NMR characterization of the secondary structure populations of a disordered conformation ofα-synuclein within E. coli cells.PLoS One