TOXICITY PREDICTION
USING MULTI-DISCIPLINARY DATA INTEGRATION
AND NOVEL COMPUTATIONAL APPROACHES
Yen Sia Low
A dissertation submitted to the faculty of the University of North Carolina at Chapel Hill in partial fulfillment of the requirements for the degree of Doctor of Philosophy
in the Department of Environmental Sciences and Engineering, Gillings School of Global Public Health.
Chapel Hill 2013
Approved by:
Alexander Tropsha, Ph.D.
Ivan Rusyn, M.D., Ph.D. Louise Ball, Ph.D. Avram Gold, Ph.D.
iii
ABSTRACT
YEN SIA LOW: TOXICITY PREDICTION USING MULTI-DISCIPLINARY DATA INTEGRATION AND NOVEL COMPUTATIONAL APPROACHES
(Under the direction of Alexander Tropsha and Ivan Rusyn)
Current predictive tools used for human health assessment of potential chemical hazards rely primarily on either chemical structural information (i.e., cheminformatics) or
bioassay data (i.e., bioinformatics). Emerging data sources such as chemical libraries, high throughput assays and health databases offer new possibilities for evaluating chemical
toxicity as an integrated system and overcome the limited predictivity of current fragmented efforts; yet, few studies have combined the new data streams.
This dissertation tested the hypothesis that integrative computational toxicology
approaches drawing upon diverse data sources would improve the prediction and interpretation of chemically induced diseases. First, chemical structures and toxicogenomics
data were used to predict hepatotoxicity. Compared with conventional cheminformatics or toxicogenomics models, interpretation was enriched by the chemical and biological insights even though prediction accuracy did not improve. This motivated the second project that
developed a novel integrative method, chemical-biological read-across (CBRA), that led to predictive and interpretable models amenable to visualization. CBRA was consistently
iv
Third, we developed an integrative workflow that interfaced cheminformatics prediction with pharmacoepidemiology validation using a case study of Stevens Johnson Syndrome (SJS), an
adverse drug reaction (ADR) of major public health concern. Cheminformatics models first predicted potential SJS inducers and non-inducers, prioritizing them for subsequent
pharmacoepidemiology evaluation, which then confirmed that predicted non-inducers were statistically associated with fewer SJS occurrences. By combining cheminformatics’ ability to predict SJS as soon as drug structures are known, and pharmacoepidemiology’s statistical
rigor, we have provided a universal scheme for more effective study of SJS and other ADRs. Overall, this work demonstrated that integrative approaches could deliver more
predictive and interpretable models. These models can then reliably prioritize high risk chemicals for further testing, allowing optimization of testing resources. A broader implication of this research is the growing role we envision for integrative methods that will
v
This dissertation is dedicated to my family, especially my parents,
whose unwavering love and support throughout my life
vi
ACKNOWLEDGEMENTS
I wish to thank the following people who have enriched my life as a doctoral student at UNC-Chapel Hill. First and foremost, I thank advisors Alex Tropsha and Ivan Rusyn
whose generous support have allowed me to pursue interests beyond cheminformatics. More importantly, their gift of time rounded my scientific apprenticeship during which I was invited to observe, participate and contribute to the discourse between two great minds.
I thank members of the Molecular Modeling Lab (MML) whose presence have made MML a wonderful place to work and play. I am grateful for their friendship and generous
feedback without which my research experience would have been much poorer. In particular, I thank Alec Sedykh, Denis Fourches, Sasha Golbraikh and Regina Politi for being such patient sounding boards to my ideas both good and bad. I also thank dear friends Liying
Zhang and Guiyu Zhao for their company on too many late nights.
I am grateful to friends near and afar for their inspiration and support, filling my PhD
journey with great memories. I thank my family for always believing in me. Thank you Mummy for being the voice of reason and comfort. A special thank you too, Daniel Oreper,
vii
TABLE OF CONTENTS
LIST OF TABLES ... ix
LIST OF FIGURES ... x
LIST OF ABBREVIATIONS ... xii
LIST OF SYMBOLS ... xiv
CHAPTER 1. INTRODUCTION ... 1
1.1. Chemical structural data and cheminformatics in predictive toxicology ... 1
1.2. Bioassay data and bioinformatics in predictive toxicology ... 5
1.3. Motivation for integrative chemical-biological modeling in predictive toxicology .... 8
1.4. Review of integrative chemical-biological modeling for predictive toxicology ... 10
1.5. Human health data and epidemiology in predictive toxicology ... 16
1.6. Dissertation outline ... 18
CHAPTER 2. INTEGRATIVE CHEMICAL-BIOLOGICAL MODELING WITH EXISTING METHODS: PREDICTING DRUG-INDUCED HEPATOTOXICITY USING QSAR AND TOXICOGENOMICS APPROACHES ... 20
2.1. Overview ... 20
2.2. Introduction ... 21
2.3. Materials and Methods ... 24
2.4. Results ... 29
2.5. Discussion ... 42
2.6. Conclusions ... 49
CHAPTER 3. INTEGRATIVE CHEMICAL-BIOLOGICAL MODELING WITH NEW METHODS: INTEGRATIVE CHEMICAL AND BIOLOGICAL READ-ACROSS (CBRA) FOR TOXICITY PREDICTION ... 50
viii
3.2. Introduction ... 51
3.3. Materials and methods ... 53
3.4. Results ... 61
3.5. Discussion ... 70
3.6. Conclusions ... 77
CHAPTER 4. INTEGRATIVE STUDY OF ADVERSE DRUG REACTIONS: CHEMINFORMATICS PREDICTION AND PHARMACOEPIDEMIOLOGY EVALUATION OF DRUG-INDUCED STEVENS JOHNSON SYNDROME ... 79
4.1. Introduction ... 79
4.2. Results ... 82
4.3. Discussion ... 92
4.4. Conclusions ... 95
4.5. Methods... 96
CHAPTER 5. GENERAL DISCUSSION AND CONCLUSIONS ... 103
5.1. Summary of key findings ... 104
5.2. Contributions and practical implications ... 106
5.3. Limitations and future solutions ... 110
5.4. Epilogue ... 115
APPENDIX 1: SUPPLEMENTAL TABLES ... 116
APPENDIX 2: SUPPLEMENTAL FIGURES ... 142
APPENDIX 3: SUPPLEMENTAL METHODS ... 147
APPENDIX 4: LICENSE FOR COPYRIGHTED MATERIALS ... 150
ix
LIST OF TABLES
Table 1.1: Integrative approaches used for toxicity prediction ... 11 Table 2.1. 5-Fold External Cross-Validation Prediction Performance of QSAR Models ... 30 Table 2.2. 5-Fold External Cross-Validation Prediction Performance of Toxicogenomics
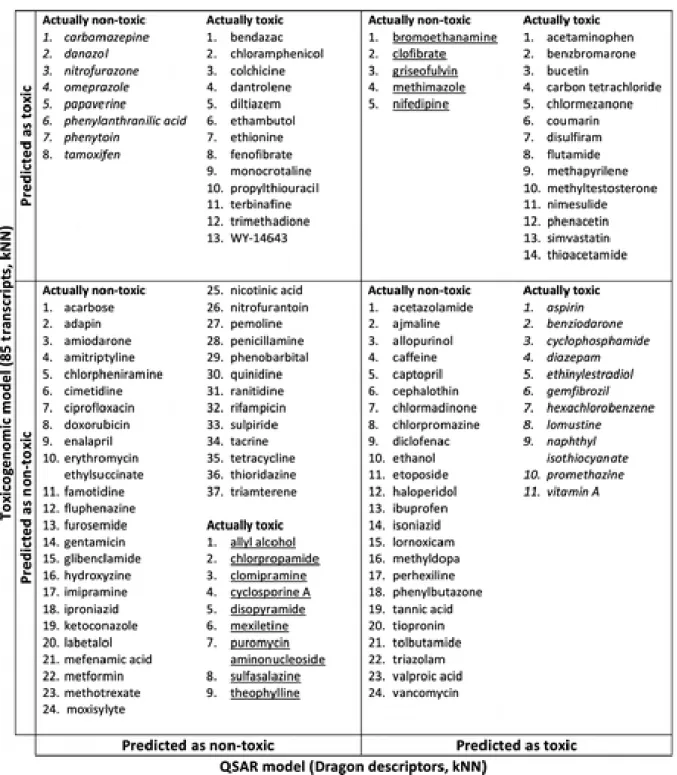
Models Based on the 85 Selected Transcripts ... 31 Table 2.3. Structural Alerts Mapped onto Example Compounds ... 33 Table 2.4. Confusion Matrix Showing Predictions by the QSAR Model and
Toxicogenomics Model ... 41 Table 4.1. Properties of SJS-inducing and non-inducing drugs used for QSAR modeling ... 82 Table 4.2. Most likely SJS inducers and non-inducers in the DrugBank, as predicted
x
LIST OF FIGURES
Figure 1.1: Integrative chemical-biological approaches for toxicity prediction ... 10
Figure 1.2: (A) Swanson ABC paradigm (B) Network enriched by similarity (solid edges) enable novel inferences (dotted edges) to be drawn ... 15
Figure 2.1. Workflow illustrating data curation and feature selection for modeling. ... 26
Figure 2.2. CCR accuracy of the models with respect to the number of chemical descriptors and transcripts used. ... 32
Figure 2.3. External prediction results of the QSAR (A, C, and E) and toxicogenomics (B, D, and F) models by kNN using different classification criteria. ... 35
Figure 2.4. Molecular networks representing the toxicogenomics predictors of hepatotoxicity. . 37
Figure 2.5. Self-organizing map of the compounds clustered by the expression of the 85 selected transcripts ... 39
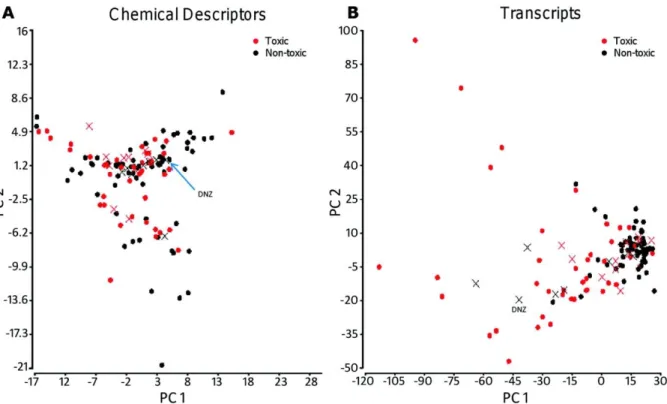
Figure 2.6. Principal component analysis of the chemical (A) and toxicogenomics (B) descriptors.. ... 40
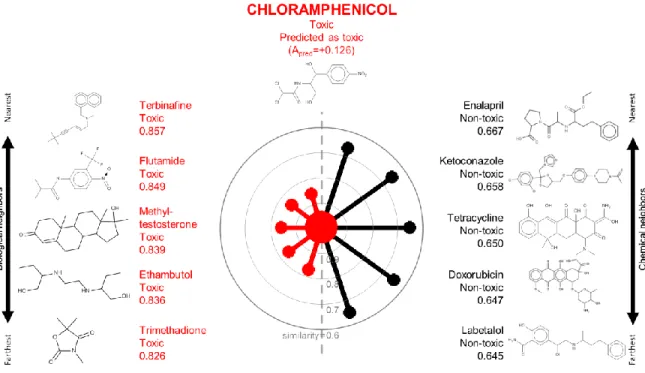
Figure 3.1. A radial plot for chloramphenicol in the TG-GATES data set. ... 62
Figure 3.2. A radial plot for carbamazepine in the TG-GATES data set... 63
Figure 3.3. A radial plot for benzbromarone in the TG-GATES data set. ... 63
Figure 3.4. Radial plots of compounds in TG-GATES data set ordered by predictions based on chemical neighbors (horizontal axis) and biological neighbors (vertical axis). ... 65
Figure 3.5. Performance of RA-sim (solid fill) and RA-kNN (patterned fill) models for the TG-GATES data set.. ... 67
Figure 3.6. Performance of various RA-kNN models for four data sets. ... 68
Figure 3.7. Venn diagrams depicting the number of compounds correctly predicted by chemical RA (blue circles), biological RA (red circles) and CBRA (yellow circles) ... 69
Figure 4.1. Schematic workflow bridging cheminformatics and pharmacoepidemiology. ... 81
Figure 4.2. Self-organizing map (SOM) in which 364 drugs were clustered into 36 cells based on Dragon descriptor profiles. ... 84
xi
Figure 4.4. Structural alerts (SA) whose presence in a drug alerts for SJS inducing activity ... 89 Figure 4.5. Crude and adjusted odds ratio (with 95% confidence intervals)
xii
LIST OF ABBREVIATIONS
AD Applicability domain
ADME Absorption, distribution, metabolism, and excretion ADR Adverse drug reaction
ALP Alkaline phosphatase ALT Alanine transaminase AST Aspartate transaminase
ATC Anatomical therapeutic chemical
AUC Area under curve
CAS Chemical Abstracts Service CBRA Chemical-biological read-across CCA Canonical correlation analysis
CCR Correct classification rate (also termed balanced accuracy) CPDB Carcinogenicity potency database
CV Cross-validation
CWAS Chemistry-wide association studies DBIL Direct bilirubin
DNA Deoxyribonucleic acid
DWD Distance-weighted discrimination
ER Endoplasmic reticulum
xiii
ISIDA In Silico Design and Data Analysis
kNN k nearest neighbors
MACCS Molecular ACCess System MCS Maximal common substructure MeSH Medical subject heading
MOE Molecular Operating Environment
OECD Organisation for Economic Co-operation and Development
OR Odds ratio
PCA Principal component analysis
PPAR Peroxisome proliferator activated receptor (Q)SAR (Quantitative) structure-activity relationship
RA Read-across
REACH Registration, Evaluation and Authorization of CHemicals
RF Random forests
SA Structural alert
SAM Significance analysis of microarrays
SD Standard deviation
SiRMS Simplex Representation of Molecular Structure SJS Stevens Johnson syndrome
SOM Self-organizing map
SVM Support vector machines TBIL Total bilirubin
xiv
LIST OF SYMBOLS
Ai Observed activity of ith neighbor
Apred Predicted activity of compound
dJac Jaccard distance between 2 compounds
I(x,compound) Local importance score of descriptor x with respect to compound
k Maximum number of neighbors in k nearest neighbors
kbio Maximum number of biological neighbors in k nearest neighbors
kchem Maximum number of chemical neighbors in k nearest neighbors
r2 Pearson correlation coefficient between 2 descriptors
Si Similarity between a compound and its ith neighbor
1
CHAPTER 1. INTRODUCTION
Contrary to popular belief, most of the 83,000 chemicals in use in the US under the Toxic Substances Control Act have not been extensively tested. Adding to this backlog are
another 700 chemicals introduced each year (Stephenson 2009). Consequently, there is an urgent need for smarter toxicity testing strategies to facilitate timely and informed decisions. Central to this is a tiered approach which funnels the chemicals through in silico, in vitro and
in vivo tests in order of decreasing throughput (Dix et al. 2007, Keller et al. 2012, Merlot 2008).
Among the in silico methods, cheminformatics and bioinformatics have established themselves as integral parts of toxicity testing, especially in the initial stages where their high
throughput advantage comes into play. The following sections will describe their current roles in toxicity testing and lay down a framework for an integrative chemical-biological approach that I posit will improve toxicity assessment in terms of higher accuracy and richer
interpretation.
1.1. Chemical structural data and cheminformatics in predictive toxicology
Because cheminformatics models require only chemical structures as inputs for modeling, they allow prediction as soon as the molecule is designed in silico and are increasingly seen as the de facto tools during the first stages of toxicity testing. Among the
2
system, and MultiCASE, drawing upon various cheminformatics methods detailed below (Gatnik & Worth 2010).
Cheminformatics methods may be broadly classified into ligand-based or structure-based approaches depending on the reference frame used to define the molecule of interest
(small molecule ligand or large biomolecule structure). Structure-based approaches are more commonly used in drug discovery where the drug target structure (e.g., a protein receptor) is defined. Ligand-based approaches are preferred in toxicity assessment especially when the
exact molecular targets mediating toxicity may not have been elucidated.
Cheminformatics-based toxicity prediction relies heavily on ligand-based approaches,
especially quantitative structure-activity relationship (QSAR) modeling. QSAR models which relate small molecule structure to chemical activity through statistical functions first appeared in 1962 when Hansch et al. correlated growth activity of auxins with their
molecular electronic properties (Hansch et al. 1962). It built upon the research in descriptor development quantifying key molecular properties, most notably, electronic (Hammett 1937),
hydrophobic (Collander et al. 1951) and steric (Taft 1952) properties (Selassie & Verma 2010). Since then, the number of chemical descriptors has grown into the thousands in our attempt to comprehensively characterize molecules. For a thorough discussion of descriptors,
refer to (Selassie & Verma 2010, Todeschini & Consonni 2000). The diverse range of descriptors covers physicochemical properties, substructural fragments (e.g. presence of
chemical function groups), molecular signatures (e.g. MACCS fingerprints) and abstract mathematical derivations based on quantum theory (e.g. orbital energies). Parallel to the development of descriptors, modeling methods have evolved from simple linear regression to
3
Arising from this multitude of descriptors and methods are (Q)SAR and related variants to suit various user needs (Gleeson et al. 2012). The simplest and most interpretable
among them is the structural alert or toxicophore whose presence in a molecule acts as a heuristic indicator for toxicity. Structural alerts may be expert-derived (Ashby 1978) or
empirically mined (Rosenkranz & Klopman 1988). The Derek expert system uses a collection of structural alerts to predict mutagenicity. The next simplest is SAR which, unlike QSAR, qualitatively relates chemical features to toxicity. Another widely used technique is
read-across which infers toxicity from the known toxicity outcomes of similar chemicals. Here, chemical similarity may be defined qualitatively (e.g. presence of substructures) or
quantitatively (e.g. Tanimoto similarity coefficients calculated from chemical descriptors). The OECD Toolbox is powered by a mix of (Q)SAR and read-across methods.
Generally, quantitative modeling with more descriptors increases predictivity but
requires the use of more complicated modeling methods which obscure interpretability. Hence, the choice of tool for toxicity estimation depends on the user’s needs. A medicinal
chemist may opt for a high accuracy QSAR model to eliminate unpromising drug candidates while a regulator may prefer an interpretable read-across method whose transparency fulfills documentation requirements and sheds light on toxicological mechanisms. However, pitting
predictivity against interpretability presents a false dichotomy as the two are inextricably inter-dependent: interpretation is conditional on predictivity; prediction without explanatory
power raises doubts on its scientific validity (Shmueli 2010).
One may argue that the common criticism of QSAR models being black boxes is unjustified. Perhaps, the limitation is the unfortunate consequence of QSAR’s success as its
4
understanding in chemistry and statistics for model interpretation. In defense of QSAR modeling, Chapter 4 will show how the appropriate choice of chemical descriptors and
modeling methods can achieve both predictivity and interpretability.
Nevertheless, limitations in data quality, training set selection, modeling methods,
validation procedures and model interpretation pose challenges. Countermeasures include careful data curation (Fourches et al. 2010), appropriate data treatment (Eriksson et al. 2003), representative sampling of the chemical space (Golbraikh & Tropsha 2002a), high
dimensional modeling techniques, stringent validation (Tropsha & Golbraikh 2007) and rationale-driven descriptor selection to simplify interpretation (Scior et al. 2009). Such
attempts to standardize and improve (Q)SAR modeling practices have led to the development of guidelines (OECD 2007) and best practices for QSAR modeling (Tropsha 2010). The five OECD principles for good (Q)SAR modeling are: (1) a well-defined endpoint, (2)
unambiguous algorithm, (3) defined applicability domain, (4) appropriate measures of model performance, and (5) mechanistic interpretation where possible.
Despite the above measures, cheminformatics-based prediction of complex toxic phenomena has fallen short of expectation. In reality, the relationship between chemical structures and toxicity is far more circuitous than the models assume, involving many
non-chemical factors including those dependent on the biological host (e.g. toxicokinetics, repair capacity). The significance of these non-chemical factors depends on the prediction target.
Generally, QSAR models are more successful at predicting direct chemical-induced outcomes (e.g. mutagenicity) than outcomes farther downstream of chemical-initiating events (e.g. carcinogenicity). While QSAR models for mutagenicity (largely molecular interactions
5
been notoriously difficult to predict because of its heterogeneous modes of action and the biological host’s adaptive capacity for recovery (Benigni 2005). One way to account for
these biological factors is to formulate them into the QSAR models.
1.2. Bioassay data and bioinformatics in predictive toxicology
The post-genome era saw a shift towards molecular toxicology and the corresponding rise of bioinformatics. The field of bioinformatics is broad, involving the computational analysis of biological information arising from the detailed characterization of an organism at
various levels (molecular, cellular, tissue, organ, system). While bioinformatics has many subdisciplines (e.g. sequencing, ‘omics, systems biology), this section focuses on a subset
with toxicology applications where the goal is to systematically study multiple biological perturbations in response to chemical insult.
Two broad applications for bioinformatics are toxicity prediction and mechanistic
elucidation. Prediction attempts to forecast long-term toxicity endpoints such as cancer from short-term assay surrogates, while elucidation is more concerned with explaining complex
toxicological phenomena in terms of simpler biological entities. In addition to forecasting, predicting toxicity from a reduced battery of assays allows researchers to focus their testing resources.
Regardless of the objective, large-scale bioassay data is first required. Fortunately, advances in assay technology has given rise to a diversity of biological measures such as ‘omics (e.g. transcriptomics, proteomics, metabonomics), enzymatic activity, receptor
binding affinity, cytotoxicity, and histology imaging, allowing toxicologists to probe into both microscopic and macroscopic changes in the body. These bioassays may have different
High-6
dimensional ‘omics, especially transcriptomics, were shown to have high predictive value
(Afshari et al. 2011, Chen et al. 2012, Heijne et al. 2005). Long term toxicity endpoints such
as 2-year hepatic tumorigenicity were successfully predicted from short-term 1-, 3-, 5-day transcriptomics (Fielden et al. 2007). The same group also identified 35 gene expression
markers important for predicting nephrotoxicity in another study (Fielden et al. 2005), obviating the need for subsequent full microarray analysis. Others such as ToxCast assays, capturing a large diversity of biological characteristics, were less predictive (Thomas et al.
2012).
Simultaneously studying thousands of bioassays offers several advantages: key
biomarkers can be quickly identified and interactions between them characterized, allowing a systems toxicology approach. In drug discovery, the use of diverse bioassay panels helps to quickly identify potentially toxic properties (e.g. cytochrome P450 inhibition, transporter
blockage) which may be clues into the pathogenesis of a compound. The bioassay signatures of compounds exemplifying certain toxic modes of action may be used to probe for similarly
acting compounds. An example is the Japanese Toxicogenomics Project which ascertained toxicogenomic signatures representative of various types of hepatotoxicities (e.g. phospholipidosis, glutathione depletion) for which drugs with unknown hepatoxicities may
be measured against (Uehara et al. 2010).
However, bioinformatics is not without criticism. The ease of collecting large-scale
bioassay data has encouraged fishing expeditions which tax the limits of current computational methods, leading to false discoveries. Applied to thousands of assays, small probabilities due to chance translate to multiple “discoveries”. Overly sensitive ‘omics
7
statistical correction (e.g. Bonferroni, Holm) and proper application of biological context to draw meaningful conclusions from the data.
Fortunately, the interpretation of key biological events underlying toxicity is aided by numerous curated databases such as the Comparative Toxicogenomics Database
(http://ctdbase.org/), Connectivity Map (http://www.broadinstitute.org/cmap/) and Ingenuity Knowledge Base (http://www.ingenuity.com/) which maps functional genomics markers associated with chemicals and toxicological phenotypes onto functional pathways. As much
as these knowledge repositories have made functional analysis more accessible, the generation of new insight still requires a profound understanding of toxicology. Fundamental
differences in the way biological processes are organized at the various levels within an organism dictate the extent of in vitro-in vivo extrapolation. For instance, the absence of metabolism in in vitro systems means that subcellular changes are unlikely to be
representative of whole animal phenotypes involving metabolic activation or metabolic clearance (Kienhuis et al. 2009). Therefore, the importance of biological expertise in guiding
interpretation cannot be overstressed.
In efforts to improve interpretation, some studies employ complementary technologies. Of note is one multi-omics study which reported that separate genomics,
proteomics and metabolomics analyses mutually validate one another’s findings and point towards common biological processes consistent with methapyrilene-induced hepatotoxicity
(Craig et al. 2006).
The focus on biological information, due to the nature of bioinformatics, has regrettably overlooked another important component of toxicology: chemical information.
8
limitations, it is now possible to perform HTS on numerous chemicals. Consequently, toxicity data is rich in both biological and chemical information. The underlying chemical
patterns, a rich data source for modeling as demonstrated by cheminformatics, have not been capitalized upon by bioinformatics. A reasonable approach may be to complement
bioinformatics with cheminformatics for improved toxicity prediction. This leads to the following thesis that an integrative chemical-biological approach will benefit toxicity prediction in terms of predictivity and interpretability.
1.3. Motivation for integrative chemical-biological modeling in predictive toxicology
Given cheminformatics’ inadequate consideration of biological factors and
bioinformatics’ non-use of chemical structures, the concurrent study of both biological and
chemical domains may uncover new insights previously invisible to either domain alone. Such integrated approaches attempt to formulate chemical toxicity as a system of
interconnected chemical and biological entities. Toxicity, whether occurring at the molecular, cellular, or systemic level, originates from a complex interplay between the chemical inducer
and the biological host. Chemical factors govern the molecular interactions between the chemical and its protein targets. The molecular interactions then initiate a cascade of interactions within the cell, organ or organism, eventually giving rise to the observed toxicity
phenotype.
Moreover, the rise of several recent enabling trends facilitates chemical-biological
integration. First, there is an increased demand for in silico and in vitro tests instead of in vivo tests in efforts to boost testing throughput, improve animal welfare and deepen our understanding of the toxicological mechanisms, accelerated by recent initiatives such as
9
Testing for the 21st Century (National Academy of Sciences & National Research Council 2007) in the US.
Second, toxicity databases now contain large amounts of chemical and biological information through data consolidation (e.g. ACToR, TOXNET, DSSTox, (Judson et al.
2009)) and large-scale testing. Programs such ToxCast (Judson et al. 2010), Tox21 (Collins et al. 2008), Molecular Libraries Initiatives (Austin et al. 2004) perform high throughput screening (HTS) on thousands of chemicals over thousands of biological endpoints. The
enlarged data scale in terms of broader chemical scope (chemical breadth) and deeper biological assay characterization (biological depth) has opened up new opportunities for
cheminformatics and bioinformatics. Where previously only a few chemicals were tested, the broader chemical scope of the data has reinvigorated interest in cheminformatics to transform latent chemical patterns into useful chemical insight. On the other hand, the deeper biological
assay characterization allows one to learn more about each chemical in terms of its biological responses. Yet, sticking to the approach of only chemical or biological modeling is unlikely
to take full advantage of the richness of the data that may be unlocked by integrating the two. Third, the many parallels between bioinformatics and cheminformatics provide points of commonality to facilitate integration. Underpinning both fields are statistical functions
relating molecular features of a chemical to its behavior. These statistical relationships rely on the similarity principle which expects chemicals similar in their molecular feature profiles
to exhibit similar behavior. The key difference between cheminformatics and bioinformatics here lies in the choice of appropriate molecular features, whether as ‘omics profiles assayed
10
statistical techniques, whether as simple as read-across or as complex as machine learning, are equally applicable to both fields.
As such, one possible means of integration is to apply existing statistical methods to both types of molecular features, chemical and biological (data pooling/integration, Figure
1.1). Another way is to merge chemical models with biological models (model pooling or ensemble modeling). Other approaches may be less straightforward, strategically combining chemical structures and biological assays such that the two data sources compensate for each other’s shortcomings and the complementary information between them is maximally used.
Figure 1.1: Integrative chemical-biological approaches for toxicity prediction
1.4. Review of integrative chemical-biological modeling for predictive toxicology
Using the classification scheme described above (Figure 1.1), recent integrative efforts merging chemical and biological data are reviewed below (Table 1.1). Because many
11
Table 1.1: Integrative approaches used for toxicity prediction
Prediction target Data sources Integrative approach Publication Rat LD50 Chemical structures,
Cytotoxicity
Data pooling (Zhu et al. 2008)
Rat LD50 Chemical structures,
Cytotoxicity
Other integrative method (Zhu et al. 2009)
Rat LD50 Chemical structures,
Dose-cytotoxicity profiles
Data pooling (Sedykh et al. 2011)
Rat reproductive toxicity
Chemical structures,
In vitro assays
Other integrative method (Zhang 2011)
In vivo toxicities Chemical structures,
In vitro assays
Data pooling (Thomas et al. 2012) Drug hepatotoxicity Chemical structures, Transcriptomics Data pooling, Model pooling,
Other integrative method
Chapter 2 (Low et al. 2011) Chapter 3 Drug hepatotoxicity Chemical structures, Hepatocyte imaging assays
Data pooling (Zhu et al. 2013)
Adverse drug reactions
Chemical structures, Drug properties, Adverse drug reactions
Data pooling,
Other integrative method
(Cami et al. 2011)
Adverse drug reactions
Chemical structures, Electronic health records
Model pooling (Vilar et al. 2011, 2012)
Adverse drug reactions
Chemical structures, Bioactivities,
Adverse drug reactions, Therapeutic indications
Data pooling (Liu et al. 2012)
Adverse drug reactions
Chemical structures, Drug targets,
Adverse drug reactions, Clinical outcomes
Data pooling,
Other integrative method
(Cheng et al. 2012, 2013)
Adverse drug reactions
Chemical structures, Bioactivities
Other integrative method (Yamanishi et al. 2012)
Drug properties Chemical structures, Bioactivities
Other integrative method (Lounkine et al. 2011)
Drug targets Chemical structures, Adverse drug reactions
Data pooling,
Other integrative method
(Campillos et al. 2008)
Drug targets Chemical structures, Protein sequence
Data pooling,
Other integrative method
(Yamanishi et al. 2008)
Drug targets Chemical structures, Adverse drug reactions
Data pooling, Model pooling,
Other integrative method
(Oprea et al. 2011)
Drug targets Chemical structures, Adverse drug reactions
Data pooling,
Other integrative method
(Lounkine et al. 2012)
Drug targets associated with agranulocytosis
Protein docking profiles Transcriptomics
12
1.4.1. Chemical-biological data pooling (data integration)
One way of chemical-biological integration is data pooling or data integration in which disparate data sources are pooled to create a larger data matrix for modeling by existing statistical methods. This has been aided by the growing availability of public
repositories such as PubChem, ChEMBL and ACToR/DSSTox. Besides high throughput experimentation, automated data generation has expanded non-traditional sources of data
such as text annotations mined from biomedical literature (InSTEM, ChemoText), product labels (SIDER) and clinical notes (Bai & Abernethy 2013, Chiang & Butte 2009, Iskar et al. 2012, Oprea et al. 2007).
Table 1.1 includes several studies predicting toxicity from pooling various combinations of data. Generally, prediction performance improved as data were pooled.
However, several exceptions exist. A comprehensive evaluation of models predicting 60 in vivo toxicities from chemical structures and/or in vitro assays in ToxCast phase I described
mixed success with data pooling (Thomas et al. 2012). Zhu et al. reported lower predictivity of hepatotoxicity from data pooling of chemical structures and hepatocyte imaging profiles (Zhu et al. 2013).
To overcome the limited prediction performance from data pooling, additional data treatment may be required, especially when biological assay data include considerable
experimental noise. For example, Sedykh et. al. introduced a noise filter to transform cytotoxicity profiles into dose-response curve parameters that, when pooled with chemical structures, provided more accurate models of rat acute toxicity than the original cytotoxicity
assay values (Sedykh et al. 2011). Chapter 2 explores the pooling of chemical structures and toxicogenomics profiles for hepatotoxicity prediction and compares the resultant “hybrid”
13
1.4.2. Chemical-biological model pooling (ensemble modeling)
Another way of integrating chemical and biological data is by ensemble modeling which pools individual predictions from several models into a final predicted value. The main benefit of ensemble modeling, increased predictivity, arises when the constituent
models compensate for the errors of one another (Dietterich 2000). The notion that many models are better than one is best exemplified by the random forest algorithm which seeks the consensus vote of numerous constituent decision tree models within its “forest” (Breiman
2001). In the case of toxicity modeling, chemical-based models and biological-based models may be pooled such that their consensus vote provides the final prediction outcome.
Such model pooling is already widely practiced in regulatory assessment and drug discovery during which the user weighs all the prediction outcomes from various toxicity
models before arriving at a consensus decision (Kruhlak et al. 2012, Wang et al. 2012). For example, drugs must not contain structural alerts of mutagenicity and their bioassay profiles
must not inhibit the major cytochrome P450 enzymes required for drug metabolism.
Ensemble modeling can be used in one of two ways. One can require that all the constituent models for a compound point to the same prediction outcome such that their
intersection represents an enriched space in which toxicity can be estimated with higher confidence. Alternatively, one can argue that ensemble modeling enlarges the modelable
space of molecules such that compounds that cannot be predicted with confidence by one model be supplanted by another model that can. In the first case, Vilar et. al. showed increased precision when a chemical similarity model was pooled with a model based on
clinical notes (Vilar et al. 2011, 2012). In the second case, as Chapter 3 will illustrate, the ensemble chemical-biological model compensates for the invalid predictions by the QSAR
14
not always outperform their constituent chemical and biological models, as Chapter 3 will demonstrate on four data sets containing chemical structures and bioassays.
1.4.3. Other integrative chemical-biological modeling
The shortcomings of merely pooling data or models have led to more innovative
integrative approaches that rely on the rational use of data and modeling methods. Zhu et. al. described a two-step hierarchical approach which first stratified compounds by their in vitro
-in vivo correlation and then built stratum-specific models. Poorly correlated compounds with
in vitro surrogates were assumed to be strongly influenced by biological factors and would benefit from the inclusion of biological data. Such compounds were shown to benefit from
models pooling chemical structures and in vitro assay data (Zhang 2011). Such strategic use of biological data to stratify data sets into clusters for localized modeling was also attempted
by Lounkine et al. who clustered compounds by chemical similarity and their bioactivity (Lounkine et al. 2011).
Another class of integrative approaches employ network modeling which allows the simultaneous study of disparate entities (chemicals, targets and phenotypes) (Berger & Iyengar 2009). In a network, entities (nodes) are connected (edges) if they are associated.
Association may be defined in terms of physical interactions (e.g., drug binds to target) or statistical associations. In such modeling, the goal is to discover new associations among the entities through indirect associations. This is best illustrated by Swanson’s ABC paradigm
(Swanson 1986) in which entities A and C are indirectly associated if there exist direct associations between pairs A-B and B-C (Figure 1.2A). Networks may be further enriched by
15
(Yamanishi et al. 2008), side effect similarity (Campillos et al. 2008) such that novel inferences can be drawn (Figure 1.2B (Tatonetti et al. 2009))
Figure 1.2: (A) Swanson ABC paradigm, adapted from (Baker & Hemminger 2010) (B) Network enriched by similarity (solid edges) enable novel inferences (dotted edges) to be
drawn, adapted from (Tatonetti et al. 2009)
Associations successfully predicted in recent studies include those of target-phenotype (Lounkine et al. 2012), chemical-target-phenotype (Cami et al. 2011, Cheng et al. 2013),
chemical-target (Campillos et al. 2008, Yang et al. 2011). For examples of broader efforts to infer more than a single type of associations, readers are best referred to (Berger & Iyengar
2009, Cheng et al. 2012, Oprea et al. 2011, Tatonetti et al. 2012)
Another integrative method, quantitative chemical-biological read-across (CBRA) based on the principles of k nearest neighbors, is presented in Chapter 3. Unlike an ensemble
model that pools chemical-based predictions and biological-based predictions, enhanced pooling utilizing similarity weights maximizes the complementarity between chemical and biological data and resolve their conflicting predictions. Chapter 3 also compares the three
16
1.5. Human health data and epidemiology in predictive toxicology
Besides chemical and bioassay databases, increasing digitization of health databases
(e.g. health insurance claims, national health records) offers new ways of studying toxic health effects in human populations (Adami et al. 2011, Hall et al. 2012). Health data may be
more informative than toxicology studies performed in non-human model organisms which sometimes extrapolate poorly to humans due to inherent interspecies differences. To bridge the disconnect, one can draw upon human health data and apply epidemiological methods to
systematically study health effects in human populations.
Epidemiology and toxicology have always complemented each other: epidemiology
provides the tools for discovery, to reliably identify the risk factors of a certain health outcome while toxicology provides the tools for corroboration, to verify that the risk factors are indeed causative through experiments and to suggest a plausible mode of action.
Sometimes, their roles reverse. Toxicology, taking on a predictive role, may accumulate reasonable experimental evidence from non-human studies to suspect a chemical of human
toxicity. Epidemiology, now taking on a confirmatory role, attempts to verify the toxicological findings in humans (Adami et al. 2011).
Drug safety, in particular, could benefit from the integration of toxicology and
epidemiology, specifically pharmacoepidemiology, the specific branch of epidemiology concerned with the study of drug effects in human populations. Although human drug
toxicity is extensively investigated in clinical trials prior to market approval, many adverse drug reactions (ADR) may have been missed in clinical trials which do not reflect the
“real-world” setting with pediatric or geriatric patients or patients with co-morbidities (Arellano
17
billion of unnecessarily healthcare expenditure (Ahmad 2003, National Research Council 2007).
Current ADR detection by most drug authorities (e.g. US Adverse Events Reporting System, World Health Organization VigiBase) relies on the passive surveillance of
spontaneous ADR reports. When an unusually high number of ADR reports are linked to a drug, determined by statistical tests of association, a warning signal is generated (Bate & Evans 2009, Harpaz et al. 2012). However, passive surveillance systems are prone to
underreporting and reporting bias as the spontaneous reports are only voluntary for healthcare professionals and patients.
In response, recent initiatives such as the Food and Drug Administration (FDA) Sentinel Initiative (Platt et al. 2012) and EU-ADR (Oliveira et al. 2012) have called for active surveillance of ADR. Such a system, instead of passively relying on spontaneous
reports, actively monitors clinical data for ADR signals. Increasingly, ADR prediction is performed with alternative data sources such as patient health records (LePendu et al. 2013),
health administrative databases, patient web forums (White et al. 2013), biomedical literature (Bisgin et al. 2011, Shetty & Dalal 2011), chemical structures (Bender et al. 2007, Matthews et al. 2009a,b; Scheiber et al. 2009) and bioassays (Chiang & Butte 2009, Pouliot et al.
2011).
Because of the large amount of data involved, effective surveillance aims for a tiered
approach in which signal detection composes of three stages: signal generation, refinement and evaluation (Platt et al. 2012). In the first stage (signal generation), high throughput data mining methods generate suspect drug-ADR pairs. The second stage (signal refinement)
18
adjustment for confounders such as demography, co-medications and co-morbidities (McClure et al. 2012). Signals progressing to the third stage (signal evaluation) will then
undergo a careful clinical expert evaluation.
Therefore, one practical way for implementing an effective ADR detection system is
to first apply high throughput cheminformatics techniques which utilize readily available drug chemical structures for the prediction of potential ADR (signal generation). Then, the potential ADR are assessed by pharmacoepidemiology using patient health data (signal
refinement). As pharmacoepidemiology calls for thoughtful study design and rigorous statistical analysis, it, unlike cheminformatics, is less amenable to large-scale automated
analysis. Coupling cheminformatics to pharmacoepidemiology will combine the best of both methods: the high throughput advantage of the former and the statistical rigor of the latter. Such an approach is exemplified in Chapter 4 for the prediction and validation of drugs
inducing Stevens Johnson Syndrome (SJS), an ADR of major concern.
1.6. Dissertation outline
This dissertation presents integrative approaches addressing some of the above problems facing predictive toxicology. Poor model performance due to the lack of biological factors in cheminformatics and chemical structures in bioinformatics may be overcome by
integrative modeling of both chemical and biological factors. Chapter 2 illustrates hepatotoxicity prediction from the combined use of chemical structures and toxicogenomics
19
Chapter 3 extends the work in Chapter 2 by developing a new integrative method, chemical-biological read across (CBRA), that exploits the complementary information
between chemical structure and bioassays for more accurate prediction.
Chapter 4 attempts to account for human health effects in the study of ADR through
the use of pharmacoepidemiology to evaluate human health data. Compared to current ADR detection methods which rely only on spontaneous ADR reports, Chapter 4 draws from various data sources (chemical structures, spontaneous ADR reports, health insurance claims)
and various methods (cheminformations, pharmacoepidemiology) for the study of Stevens Johnson Syndrome ADR. It provides a feasible workflow coupling high throughput
cheminformatics with in-depth pharmacoepidemiology analysis, a process in which cheminformatics predicts high risk drugs for pharmacoepidemiology validation.
Chapter 4 also addresses the lack of interpretability of QSAR “black box” modeling
by proposing an interpretation framework for identifying important chemical substructures associated with SJS.
20
CHAPTER 2. INTEGRATIVE CHEMICAL-BIOLOGICAL MODELING WITH EXISTING METHODS: PREDICTING DRUG-INDUCED HEPATOTOXICITY
USING QSAR AND TOXICOGENOMICS APPROACHES1
2.1. Overview
Quantitative structure-activity relationship (QSAR) modeling and toxicogenomics are typically used independently as predictive tools in toxicology. In this study, we evaluated the
power of several statistical models for predicting drug hepatotoxicity in rats using different descriptors of drug molecules, namely, their chemical descriptors and toxicogenomics
profiles. The records were taken from the Toxicogenomics Project rat liver microarray database containing information on 127 drugs (http://toxico.nibio.go.jp/datalist.html). The model end point was hepatotoxicity in the rat following 28 days of continuous exposure,
established by liver histopathology and serum chemistry. First, we developed multiple conventional QSAR classification models using a comprehensive set of chemical descriptors
and several classification methods (k nearest neighbor, support vector machines, random forests, and distance weighted discrimination). With chemical descriptors alone, external predictivity (correct classification rate, CCR) from 5-fold external cross-validation was 61%.
Next, the same classification methods were employed to build models using only toxicogenomics data (24 h after a single exposure) treated as biological descriptors. The
optimized models used only 85 selected toxicogenomics descriptors and had CCR as high as 76%. Finally, hybrid models combining both chemical descriptors and transcripts were
1
21
developed; their CCRs were between 68 and 77%. Although the accuracy of hybrid models did not exceed that of the models based on toxicogenomics data alone, the use of both
chemical and biological descriptors enriched the interpretation of the models. In addition to finding 85 transcripts that were predictive and highly relevant to the mechanisms of
drug-induced liver injury, chemical structural alerts for hepatotoxicity were identified. These results suggest that concurrent exploration of the chemical features and acute treatment-induced changes in transcript levels will both enrich the mechanistic understanding of
subchronic liver injury and afford models capable of accurate prediction of hepatotoxicity from chemical structure and short-term assay results.
2.2. Introduction
Hepatotoxicity is a major factor contributing to the high attrition rate of drugs. At least a quarter of the drugs are prematurely terminated or withdrawn from the market due to
liver-related liabilities (Schuster et al. 2005). As a result, modern drug development has evolved into a complex process relying on the iterative evaluation of multiple data sources to
eliminate potentially harmful candidates as cheaply and as early as possible. In addition, high throughput, high content, and other data-rich experimental techniques, accompanied by the appropriate informatics tools, are rapidly incorporated into toxicity testing.
Quantitative structure–activity relationship (QSAR) modeling is widely used as a computational tool that allows one to relate the potential activity (e.g., toxicity) of an agent to
its structural features represented by multiple chemical descriptors. As with any multivariate statistical modeling, rigorous validation procedures are necessary to guard against overfitting and overestimating model predictivity (Tropsha 2010). QSAR models have demonstrated
22
certain target. However, QSAR predictivity is generally poor in the case of a complex end point such as hepatotoxicity where the structure–activity relationship is less straightforward
due to multiple mechanisms of action (Hou & Wang 2008).
Toxicogenomics is now routinely used in drug and chemical safety evaluation,
providing valuable mechanistic understanding of the molecular changes associated with the disease or treatment (Cui & Paules 2010). In addition, its utility for predicting toxicity has been explored. Blomme et al. developed models using transcriptional changes after
short-term (5 days) exposure to predict bile duct hyperplasia that otherwise required long-short-term in vivo experiments (Blomme et al. 2009). Fielden et al. developed a 37-gene classification
model using microarray data following short-term (1–5 days) exposure to predict nongenotoxic hepatocarcinogenicity with over 80% accuracy (Fielden et al. 2007). Zidek et al. reported high accuracy with a 64-gene classifier for the prediction of acute hepatotoxicity
(Zidek et al. 2007). The Toxicogenomics Project in Japan, set up by the Ministry of Health, Labour and Welfare, National Institute of Health Sciences, and 15 pharmaceutical
companies, has also identified several toxicogenomics signatures indicative of the various toxic modes of action such as phospholipidosis (Hirode et al. 2008), glutathione depletion (Kiyosawa et al. 2007), bilirubin elevation (Hirode et al. 2009a), nongenotoxic
hepatocarcinogenesis (Uehara et al. 2008), and peroxisome proliferation (Tamura et al. 2006).
Most previous studies on statistical modeling of toxicity used either chemical descriptors (conventional QSAR) or toxicogenomics profiles independently for model development. However, in our recent studies, we have demonstrated the benefits of hybrid
23
2011), and employing both chemical descriptors and biological assay data (treated as biological descriptors). In the first study of this type (Zhu et al. 2008), we used the results of
high-throughput screening assays of environmental chemicals along with their chemical descriptors to arrive at improved models of rat carcinogenicity. This approach was extended
to predicting acute toxicity half-maximal lethal dose in rats using dose–response in vitro data as quantitative biological descriptors (Sedykh et al. 2011).
Following our hybrid (chemical and biological descriptors) data modeling paradigm,
we sought to integrate QSAR and toxicogenomics data to develop classification models of hepatotoxicity using a data set of 127 drugs studied in the Japanese Toxicogenomics Project
(Uehara et al. 2010). We built classifiers combining chemical descriptors and toxicogenomics data alongside the conventional QSAR, as well as toxicogenomics models. Our objective was to investigate if chemical descriptors and biological descriptors, such as
gene expression, could be complementary. In addition, we sought to enhance the interpretation of the models in terms of elucidating the chemical structural features and
biological mechanisms associated with hepatotoxicity. We show that statistically significant and externally predictive models can be developed by combining chemical and biological descriptors and can be used to predict hepatotoxicity and prioritize chemicals for
24
2.3. Materials and Methods
2.3.1 Data
The chemical name, dosage, administration route, and vehicle for the 127 compounds used in this study are summarized in Appendix 1 Table A1.2.1. The detailed
protocol for the animal study was described previously (Uehara et al. 2010). Briefly, 6-week old male Sprague–Dawley rats (Charles River Japan, Inc., Kanagawa, Japan) with five
animals per group were used in the study. Animals were sacrificed 24 h after a single dose or 24 h after repeat daily treatment for 28 days. Blood samples were collected from the abdominal aorta under ether anesthesia. Serum chemical indicators included alanine
aminotransferase, aspartate aminotransferase, alkaline phosphatase, total bilirubin, direct bilirubin, and gamma-glutamyl transpeptidase. The livers were quickly removed following
exsanguination and sections of the livers were placed in 10% phosphate-buffered formalin for histopathology. Formalin-fixed liver tissue was embedded in paraffin, and sections were
stained with hematoxylin and eosin and examined histopathologically under light microscopy. Remaining liver tissues from left lateral lobes were soaked in RNALater (Ambion Inc., Austin, TX) and stored at −80 °C until used for microarray analysis. Detailed
methods for microarray analysis were previously reported (Uehara et al. 2010). Raw microarray data files with individual animal histopathological data are available
(http://toxico.nibio.go.jp/datalist.html). In this study, toxicogenomics data obtained from rats treated with a single dose of a drug or vehicle for 24 h was used. The experimental protocols were reviewed and approved by the Ethics Review Committee for Animal Experimentation
25
Liver histopathology and serum chemistry in animals treated for 28 days were assessed for the determination of the hepatotoxicity end point for prediction. Histopathology
was graded by two trained pathologists in a blinded manner as follows: no change, very slight (minimal), slight, moderate, and severe. Spontaneously observed lesions (e.g., minimal
focal necrosis and microgranuloma) were not used for grading. The results of a histopathology analysis were considered positive if the grade recorded was other than “no
change.” Appendix 1 Table A1.2.1 lists serum chemistry and histopathology classification
for each compound. A compound was denoted hepatotoxic if it exhibited histopathology characteristics of hepatotoxicity (e.g., hepatocellular necrosis/degeneration, inflammatory
cell infiltration, bile duct proliferation, etc.) regardless of the findings from serum chemistry. Conversely, a compound was deemed nonhepatotoxic if it did not result in adverse histopathological features. When the histopathological observations were inconclusive (e.g.,
hepatocellular hypertrophy, vacuolization, etc.), serum chemistry data was considered. Under these circumstances, significant changes (Dunnett’s test) in at least one enzyme marker
would render the compound hepatotoxic. Otherwise, the compounds with inconclusive histopathology and normal serum chemistry were denoted nonhepatotoxic. In total, there were 53 (42%) hepatotoxic and 74 (58%) nonhepatotoxic compounds.
2.3.2. Curation of chemical data
The data set was curated according to the procedures described by (Fourches et al. 2010). Briefly, counterions and duplicates were removed, and specific chemotypes such as aromatic and nitro groups were normalized using several cheminformatics software such
26
inspected manually, and two metal-containing compounds for which most chemical descriptors cannot be calculated, cisplatin and carboplatin, were removed. Chemical
descriptors were calculated with Dragon (v.5.5, Talete SRL, Milan, Italy) and Molecular Operating Environment (MOE, v.2009.10, Chemical Computing Group, Montreal, Canada)
software. Simplex representation of molecular structure (SiRMS) descriptors were derived as detailed elsewhere (Muratov et al. 2010). After range scaling (from 0 to 1), low variance (SD < 10-6) and highly correlated descriptors (if pairwise r2 > 0.9, one of the pair was randomly
removed) were removed. QSAR models were built separately using 304 Dragon, or 116 MOE, or 271 SiRMS descriptors (Figure 2.1).
Figure 2.1. Workflow illustrating data curation and feature selection for modeling.
2.3.3. Selection of transcripts
Transcripts were selected for modeling using various feature selection methods. Of
27
basis of the following criteria: the largest change of any transcript over its untreated equivalent must exceed 1.5-fold, and the smallest false discovery rate (Welch t-test) must be
less than 0.05. Next, transcripts with low variance (all, or all but one value is constant) and high correlation (if pairwise r2 > 0.9, one of the pair, chosen randomly, was removed) were
excluded leaving 2,923 transcript variables (Figure 2.1) which were range scaled.
Then, supervised selection methods were used to filter genes differentially expressed between hepatotoxic and nonhepatotoxic compounds. Significance analysis of microarrays
(SAM) (Tusher et al. 2001), a permutation variant of the t-test commonly used for transcript selection, was used. Top ranked transcripts were retained for modeling. Different sets of
transcripts were selected for each modeling set used in 5-fold external cross-validation to avoid selection bias introduced by a supervised selection process.
2.3.4. Modeling and Validation
kNN (Zheng & Tropsha 2000), SVM (Vapnik 2000), random forest (RF) (Polishchuk
et al. 2009), and distance weighted discrimination (DWD) (Marron et al. 2007) machine learning techniques, designed to effectively handle high dimension-low sample size data, were used for modeling. The modeling workflow (Tropsha 2010, Tropsha & Golbraikh 2007)
used both internal and external validation (Appendix 2 Figure A2.2.1). In a 5-fold external cross-validation, 127 compounds were randomly partitioned into 5 subsets of nearly equal
size. Each subset was paired with the remaining 80% of the compounds to form a pair of external and modeling sets. The data within each modeling set were further divided into multiple pairs of training and test sets for internal validation.
28
accuracy alone is insufficient to establish robust and externally predictive models (Golbraikh & Tropsha 2002b). The prediction outcome for each model was categorized as “0” for nontoxic compounds or “1” for toxic ones. Selected models were then pooled into a
consensus model by simple averaging and used to predict the hepatotoxicity of compounds in
the external sets (i.e., external validation). The toxicity threshold was set at 0.5 unless otherwise mentioned, i.e., a compound is predicted to be nontoxic if a consensus mean is less than 0.5 and toxic otherwise.
The y-randomization test was employed to ensure that there was no chance correlation between selected descriptors and hepatotoxicity. After random permutation of the
hepatotoxicity labels in the modeling sets, models were rebuilt following the same workflow, and their CCR values for both training and test sets were collected and compared. This test was repeated at least three times. Models generated from the randomized labels were
expected to perform significantly worse than those derived from the original data set.
All reported model predictivity measures, specificity, sensitivity, and correct
classification rate, were obtained from 5-fold external cross-validation. Specificity denotes the true negative rate, or the rate correctly predicted within the nonhepatotoxic class. Similarly, sensitivity, the true positive rate, measures the rate correctly predicted within the
hepatotoxic class. CCR is the average of the rates correctly predicted within each class (CCR = [specificity + sensitivity]/2). Coverage is the percentage of compounds in the external set
within the applicability domain (AD) of the model. The AD is a similarity threshold within which compounds can be reliably predicted (Tropsha et al. 2003).
Chemical and toxicogenomics descriptors found to be predictive were subsequently
29
used for the functional analysis of the significant transcripts. The networks were constructed on the basis of predefined molecular interactions in the Ingenuity database, and the Ingenuity
score was used to rank pathways for analysis. Chemicals were clustered by the selected toxicogenomics descriptors using an unsupervised self-organizing map (SOM) in R
(Kohonen package). Chemical structural alerts for hepatotoxicity were identified using HiT QSAR (Kuz’min et al. 2008) and verified with XCHEM (Sedykh & Klopman 2006). Briefly, XCHEM searches for common structural motifs within each class and ranks them by their
relative frequencies.
2.4. Results
2.4.1. Model development
First, we developed QSAR models of subchronic (28 days of treatment)
hepatotoxicity using various types of chemical descriptors (Table 2.1). Prediction performance was generally poor (55–61% CCR) across all descriptor types and classification
methods. Three compounds (tannic acid, vancomycin, and cyclosporine) with molecular weights exceeding 1,200 (median molecular weight of the data set was 285) were excluded from the data set, corresponding to a coverage of 98% for some of the models. Given the
generally unpromising results of the QSAR models described in Table 2.1, further combinatorial-QSAR (Kovatcheva et al. 2004) efforts to systematically combine each
30
Table 2.1. 5-Fold External Cross-Validation Prediction Performance of QSAR Models
Descriptors Dragon Dragon MOE SiRMS
Method kNN SVM kNN RF
Specificity SDa 0.620.17 0.620.16 0.600.18 0.770.08
Sensitivity SD 0.560.14 0.480.17 0.560.16 0.450.14
CCR SD 0.590.11 0.550.09 0.580.12 0.610.10
Coverage (%) 98 98 98 100
a SD refers to the standard deviation of the external predictivity measures (e.g. specificity) across the 5 folds.
Second, we developed classification models of subchronic (28 days of treatment) hepatotoxicity using liver toxicogenomics data obtained after a single dose treatment as a
predictor of future toxicity. To find the optimal number of variables (transcripts), several sets of top ranking transcripts were selected (based on SAM analysis) for modeling by SVM, and the outcomes were compared (Figure 2.2). CCR ranged from 72% with top 4 significant
transcripts per modeling fold to 78% with all 2,923 significant transcripts. An optimal model with a CCR of 76% was achieved when 30 transcripts per fold were used. These 5 sets of 30 transcripts per fold comprised of 85 unique transcripts across all folds, which may serve as
predictive biomarkers (Appendix 1 Table A1.2.2). We used these 85 transcripts to develop additional models employing other classification methods (Table 2.2). The RF model had the
31
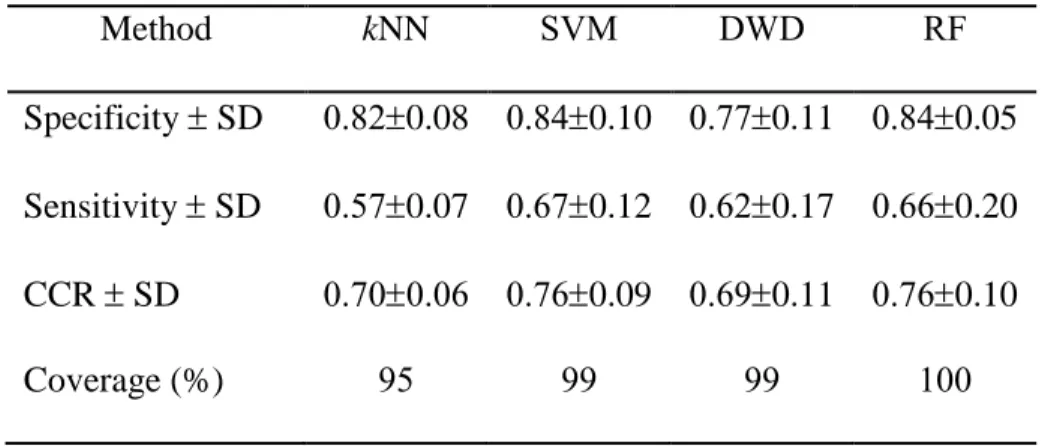
Table 2.2. 5-Fold External Cross-Validation Prediction Performance of Toxicogenomics Models Based on the 85 Selected Transcripts
Method kNN SVM DWD RF
Specificity SD 0.820.08 0.840.10 0.770.11 0.840.05
Sensitivity SD 0.570.07 0.670.12 0.620.17 0.660.20
CCR SD 0.700.06 0.760.09 0.690.11 0.760.10
Coverage (%) 95 99 99 100
Third, we developed hybrid models of subchronic (28 days of treatment) hepatotoxicity using both chemical descriptors and single-dose treatment toxicogenomics
data as biological descriptors. We studied how SVM model predictivity was affected when both the number of chemical descriptors and the number of transcripts were varied. To that effect, SAM was applied to independently rank chemical descriptors and transcripts, after
which, different portions of top ranked variables were used for SVM modeling. Figure 2.2 shows that the CCR of the hybrid models did not exceed that of the models based on
toxicogenomics data alone. However, hybrid models identified both important chemical descriptors and transcripts for the enhanced interpretation of the modeling outcomes. We could not have reliably detected the important chemical features from the relatively poorly
fitted QSAR models. Adding transcripts boosted the predictivity of the hybrid models such that important chemical features were identified with greater confidence. Specifically,
32
derived using XCHEM (Sedykh & Klopman 2006) and found to be concordant. The largest and most frequent substructures within each toxicity class are listed in Table 2.3 and provide
evidence of the structure–activity relationship in the hybrid model. All QSAR, toxicogenomics, and hybrid models were significantly better than y-randomized models (p <
0.05 by Z-test), indicating that our models were not the result of chance correlations.
Figure 2.2. CCR accuracy of the models with respect to the number of chemical descriptors and transcripts used. All models were generated by SVM classification with 5-fold external
33
Table 2.3. Structural Alerts Mapped onto Example Compounds
Substructure A (Acetanilide)
Substructure B (thioamide)
Substructure C (C-Cl)
Substructure D (Styerene)
acetaminophen phenacetin bucetin
phenylbutazone*
thioacetamide disulfiram ethionamide methimazole*
cyclophosphamide lomustine chloramphenicol
carbon tetrachloride