the M.S. in I.S degree. April 2020. 40 pages. Advisor: Bradley Hemminger
With the rapid development of smartphones, more and more people rely on navigation systems installed on their phones to find and follow routes. This study develops and tests a model of driver's trust in navigation systems. Perceived system reputation, perceived ease of use, perceived system quality, perceived system usefulness, driver's experience, and proficiency, and driver's propensity to trust are proposed to influence driver's trust. The findings indicate that the driver's trust in navigation systems was found to be influenced by perceived system reputation, perceived system quality, and perceived system usefulness.
Headings:
Trust
Navigation systems
FACTORS INFLUENCING DRIVERS’ TRUST IN NAVIGATION SYSTEMS
by Yuan Wen
A Master’s paper submitted to the faculty of the School of Information and Library Science of the University of North Carolina at Chapel Hill
in partial fulfillment of the requirements for the degree of Master of Science in
Information Science.
Chapel Hill, North Carolina
April 2020
Approved by
Table of Contents
Table of Contents 3
Introduction 3
Research model 7
Perceived system reputation (PSR) 9
Perceived ease of use (PEU) 10
Perceived system quality (PSQ) 11
Perceived system usefulness (PSU) 12
Driver's experience and proficiency with the system (DEP) 13
Driver's propensity to trust (DPT) 13
Method and sample 15
Data analysis and results 18
Quantitative results 18
Qualitative Results 22
Discussion 26
Limitations and future research 29
Conclusion 31
Appendix: survey 32
Introduction
Driving might be the most complicated every-day tasks people need to complete.
Different technologies have been developed to help human driving. Today, navigation
applications (apps) on mobile phones, such as Google Maps, Waze, and Apple Maps, are
the most popular and accessible one of those technologies, which can help drivers find
and follow the route. Relying on the Globe Positioning System (GPS) and map system, a
navigation system can provide users the most comfortable and fastest route and some
alternatives to their destination. Nowadays, people not only use navigation apps to find
the desired route in unfamiliar positions but also use them to avoid traffic jams or find
gas stations or points of interest around them.
The performance of navigation systems is vital for drivers since driving is such a
complex and high-risk task. A poor navigation system can lead to wasted time and
driving errors, which can be dangerous. The design of the navigation system can affect
the performance of it. Besides the navigation system itself, we should also consider
drivers' interaction with the system. As more automation has been introduced to different
fields, such as transportation and medical, operators' trust in automation has become an
important concept that can define the effectiveness of interaction between operators and
machines in complicated situations. So, drivers' trust is an essential factor that influences
Trust is an important factor that can influence people's behavior, especially in
situations with uncertainty and risk. The literature has many different definitions of it.
Hwang, P., & Burgers, W. P. (1997) define trust as the probability that one party attaches
to cooperative behavior by other parties. Much previous research about trust investigated
trust in people or e-commerce. In their study of e-commerce, Pavlou and Fygenson
(2006) state trust is the belief that trustees will work cooperatively to fulfill the trustor's
expectations without taking any potential advantages by manipulating the trustor's
vulnerabilities. Pavlou, P. A. (2003) used a questionnaire to see the relationship between
trust, technology acceptance model (TAM), and intended use of online vendors of
low-risk low-touch items (CD and book). The results found, for experienced users, trust,
as well as the two beliefs from TAM, perceived usefulness, and perceived ease of use,
contribute a lot to the variation of intended behavior. Another study found that trust can
help to alleviate any perceptions of uncertainty and risk associated with conducting
business via e-commerce. (Pavlou, Liang, & Xue, 2007) When driving in an unfamiliar
environment, where uncertainty and risk are prevalent, drivers must rely on other aids to
determine if the direction and route are correct and safe. Thus, trust in navigation is a
critical issue for drivers.
However, there are not many studies regarding navigation system trust issues.
Many of the studies of trust in navigation systems focus on one specific factor that affects
the driver's trust. For example, Large & Burnett (2014) used a driving simulator to test
the effect of different voices on trust and attention while using in-vehicle navigation
navigation voices. Since trust is a complex concept, we need to take previous findings
and extend them to additional variables. Additionally, research about the overall structure
of drivers’ trust in navigation is necessary for us to answer questions like, What factors
influence drivers' trust in navigation apps? What are the dominant factors that influence
drivers' trust in navigation systems?
Therefore, this study tries to investigate different factors that influence drivers'
trust in navigation systems. In this study, for navigation systems, we focus on the use of
navigation apps installed on mobile phones in daily life situations. Rather than focus on
one specific variable, we try to form an overview of factors related to drivers' trust in
navigation systems. Therefore, the research model in this study can help designers of
navigation systems to understand better what influences drivers' trust, improve strategies
that enhance drivers' trust in their products, and consequently, users' intention to use the
navigation system. Previous studies show that trust can significantly improve users'
intention to buy online. (McKnight, Choudhury, & Kacmar, 2002) Also, Higher trust
means higher loyalty and maybe better performance for this system and higher user
satisfaction. (Amin, Rezaei, & Abolghasemi, 2014) In the next section, based on previous
Research model
Trust has been studied in many research settings. Though, only a few studies take
a look at trust in navigation systems. Much previous research about trust was focusing on
offline trust, which means the object of trust is typically a person or an organization. For
example, in the management field, there are two main views of trust. The predictability
view takes trust as confidence in the predictability of someone's expectation, which
depends on contracts and guarantees between the two parties. The goodwill view takes
trust as confidence in another's goodwill, which relies on the moral integrity of others.
However, there are differences between offline and online trust. In an online context, the
object of trust is the technology and the company that developed the technology.
Compared to a person, an unpredictable and uncertain website is riskier. The nature of
technology makes online trust more complicated.
Most of the previous studies about online trust are in the e-commerce context. In
the study of a travel website, Chen (2006) classified trust into two types: (1) a belief or
expectation on others' trustworthiness and (2) a behavioral intention or behavior of
reliance and involving vulnerability and uncertainty. In their study of trust in
e-commerce, McKnight et al. (2002) identified a three dimensional model of trust: the
disposition to trust, institution-based trust, and trusting beliefs. Disposition to trust is
the belief that the trustee has a structural condition that improves the possibility of
successful activity. Trusting beliefs is trustor's assurance in the trustee based on
competence, benevolence, and integrity. In summary, researchers view trust as (1) a set
of beliefs dealing with integrity, goodwill, and ability of others (trustworthiness), (2) a
general belief that another party can be trusted (trust intention),(3) feelings of confidence
and security of caring response of others, (4) a combination of these elements.
Antecedents of trust help us understand what builds trust. Paul A. Pavlou (2003)
summarized that antecedents of trust are knowledge-based trust, institution-based trust,
calculative-based trust, cognition-based trust, and personality-based trust. Kim, Ferrin,
and Rao (2008) argued four antecedents of consumers' trust in their study of e-commerce:
cognition-based (e.g., privacy protection, security protection, system reliability,
information quality), affect-based (e.g., reputation, presence of third-party seals, referral,
recommendation, buyers' feedback, word-of-mouth), experience-based (e.g., familiarity,
Internet experience, e-commerce experience), and personality-oriented antecedents (e.g.,
the disposition to trust, shopping style). Beldad, de Jong, and Steehouder (2010)
classified the antecedents of trust into three main categories: company-based antecedents
(company reputation); consumer-based antecedents (for example, consumer experience
with the technology); and website-based antecedents (for example, the information
quality). Paul A. Pavlou (2003) claimed that online trust is built through (1) a belief that
the vendor has nothing to gain by cheating, (2) a belief that there are safety mechanisms
behind the website, and (3) the website having a standard interface, (4) the website easy
They include availability, competence, consistency, discreteness, fairness, integrity,
loyalty, openness, promise, and fulfillment.
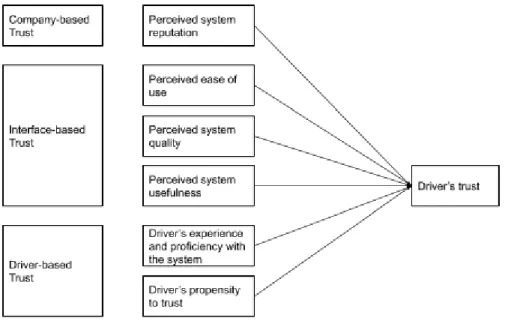
Based on all the elements of trust from the studies mentioned above and the
context of using navigation systems, in this study, the key antecedents of drivers' trust are
conceptualized into three categories: company-based, interface-based, and driver-based.
Accordingly, the factors we will examine in this study are perceived system reputation,
perceived ease of use, perceived system quality, perceived system usefulness, driver's
experience and proficiency with the system, and driver's propensity to trust technology.
The proposed research model is presented in Figure 1.
Figure 1: Proposed Research Model
Perceived system reputation (PSR)
The reputation of an organization represents the organization's credibility formed
2007) It is a typical measurement of trustworthiness based on referrals and reviews from
others who have worked with the organization. (Josang, Ismail, & Boyd, 2007) Users can
construct the reputation of a company from word-of-mouth within his/her social network,
friends' referrals, or online reviews from other users.
Many studies pointed out that a positive reputation raises the customers' trust in
the company, while a negative reputation results in a less trusting relationship. (Chen,
2006, Teo and Liu, 2007) Moreover, for people who do not have experience with an
online service provider, they rely on the reputation of the provider to access the
trustworthiness. (Chen, 2006) Thus, we proposed the following hypothesis:
H1: Drivers' perceived reputation of the navigation system will positively
influence trust towards the navigation system.
Perceived ease of use (PEU)
Perceived ease of use is one of the critical variables in the Technical Acceptance
Model (TAM) proposed by Davis, which is defined as "the degree to which a person
believes that using a particular system would be free of effort." (Davis, 1989) There are
numerous researches found that an application which is perceived easier to use than
others is more likely to be accepted by users. (Davis, 1989; Paul A. Pavlou, 2003) Most
of those researches were conducted in the context of e-commerce. Teo & Liu (2007)
found that the website's ease of use has a significant influence on customers' trust in the
vendor. Primarily, when users are still getting familiar with the website in the early stage,
(Chau, Hu, Lee, & Au, 2007) In our study, perceived ease of use is defined as the degree
to which a driver believes that a particular navigation application is easy to use. Thus, we
proposed the following hypothesis:
H2: Drivers' perceived ease of use of the navigation system will positively
influence trust towards the navigation system.
Perceived system quality (PSQ)
In the context of websites, the perceived website quality is defined as users'
general perception of the website's navigability, aesthetics, and functionality. (McKnight,
Choudhury, & Kacmar, 2002) Hsin Chang & Wen Chen (2008) defined website quality
as "users' evaluation of whether a web site's features meet users' needs and reflect the
overall excellence of the web site." In our study, system quality refers to drivers'
perception of information quality, functionality, and aesthetics on the navigation system.
Many prior studies have proved that there is a positive link between websites'
quality and users' trust. (McKnight, Choudhury, & Kacmar, 2002, Liao, Palvia, & Lin,
2006) In the field of navigation systems, a recent study (Wijayanto, & Jourdy, 2019)
found users had higher trust in Waze than Google Maps, due to the higher degree of
flexibility in information sharing. The data were obtained through questionnaires,
including the Human-Computer Trust level in the navigation system, which adopted a
human-machine questionnaire developed by Jian et al. (Jian, Bisantz, & Drury, 2000)
This study reveals some implications for navigation system design: (1) the systems
users and computers, (3) the safety condition should be maintained. Kim, Chung, & Lee
(2011) also used questionnaires and found out that the website's navigation functionality
and perceived security had a significantly positive effect on trust. Thus, we proposed the
following hypothesis:
H3: Drivers' perceived quality of the navigation system will positively influence
trust towards the navigation system.
Perceived system usefulness (PSU)
Perceived usefulness is another important variable in TAM, which is defined as
"the degree to which a person believes that using a particular system would enhance his
or her job performance." (Davis, 1989) According to TAM, perceived usefulness is an
individual's subjective assessment of the utility offered by the new technology in a
task-related context. Perceived ease of use is an indicator of the cognitive effort needed to
learn and utilize the new technology. These two elements together determine users'
intention to accept and to use the new technology. In our study, perceived usefulness is
the degree to which a driver believes that using a particular navigation application could
enhance his/her driving and route-finding. Based on the underlying logic that drivers are
rational when they are using a navigation system, we proposed the following hypothesis:
H4: Drivers' perceived usefulness of the navigation system will positively
Driver's experience and proficiency with the system (DEP)
Proficiency can be understood as the familiarity and skills users get from their
experience with the system. People who have higher proficiency and more experience
with technology are more likely to have a low perception of risk of using it and thus to
have more trust in technology. Because experienced users have more skills and
knowledge to help them distinguish unreliable information and thus have more
confidence when using technology. (Corbitt, Thanasankit, & Yi, 2003) However, Aiken
(2006) indicated that a higher level of experience and proficiency could also lead to a low
level of trust because users gain more knowledge about the possibilities that things could
go wrong. In our study, considering the different context from e-commerce and the
possibility that even users know more about when things could go wrong, they also know
more about how to prevent those situations, we proposed:
H5: Drivers' experience and proficiency in using the navigation system will
positively influence trust towards the navigation system.
Driver's propensity to trust (DPT)
Different people are different in the amount of trust in their exchange partners.
(Mayer, Davis, & Schoorman, 1995) According to previous studies, the propensity to
trust is related to the process of the formation of trust based on the system's trust
attributes. The higher the level of trust propensity, the more significant the impact of the
propensity tend to have a lower desire to try new things because they need more
information to form the trust. In the study of e-commerce, some customers are more
likely to trust the vendor despite the limitation. (Teo and Liu, 2007) Thus, we proposed
the following hypothesis:
H6: Drivers' propensity to trust will positively influence trust towards the
Method and sample
The data were collected using a web-based survey developed by the tool “Qualtrics,” and
the target population is people who have experience of driving with the guide of
navigation application installed on their mobile phone. Navigation systems are defined as
navigation applications or map applications installed on their phone that can help them
find and follow routes, which will be provided on the top of the questionnaire to ensure
all participants understand the concept. There are four sections in the questionnaire,
screening questions, demographics, the instrument for the model, and open-ended
questions. At the beginning of the questionnaire, the subject will be asked about their
experience with navigation systems, for example, “Have you used navigation applications
before?”, “When was the last time you used it?” and “Which navigation system did you
use most of the time?”. Only people who have experience of driving with navigation
systems can answer the following questions. Then, demographics, including age and
gender, will be collected from the respondents. Questions about trust and the proposed
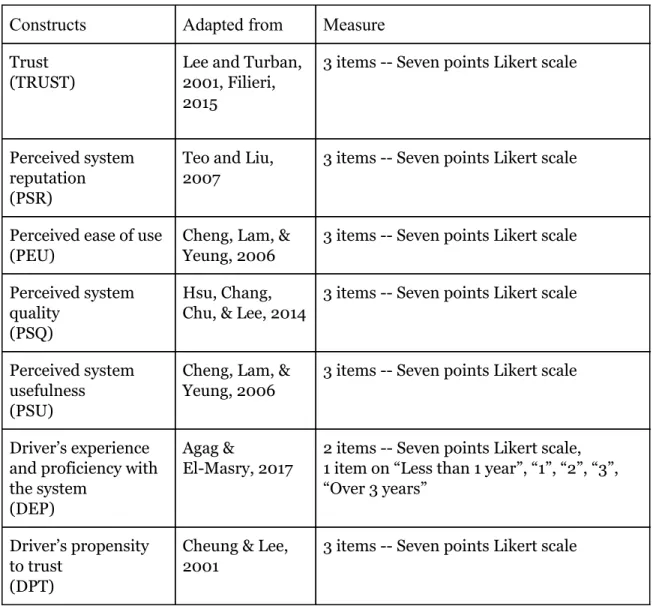
model are adopted and modified from tested instruments from previous research. The
sources of each construct and instrument questions are presented in Table 1.( The actual
survey is attached in the Appendix.) Subjects were asked to indicate on a seven-point
navigation systems. At the end of the questionnaire, three open-ended questions will be
asked to collect qualitative data.
Table 1. Survey Instrument Sources
Constructs Adapted from Measure
Trust (TRUST)
Lee and Turban, 2001, Filieri, 2015
3 items -- Seven points Likert scale
Perceived system reputation (PSR)
Teo and Liu, 2007
3 items -- Seven points Likert scale
Perceived ease of use (PEU)
Cheng, Lam, & Yeung, 2006
3 items -- Seven points Likert scale
Perceived system quality
(PSQ)
Hsu, Chang, Chu, & Lee, 2014
3 items -- Seven points Likert scale
Perceived system usefulness (PSU)
Cheng, Lam, & Yeung, 2006
3 items -- Seven points Likert scale
Driver’s experience and proficiency with the system
(DEP)
Agag &
El-Masry, 2017
2 items -- Seven points Likert scale, 1 item on “Less than 1 year”, “1”, “2”, “3”, “Over 3 years”
Driver’s propensity to trust
(DPT)
Cheung & Lee, 2001
3 items -- Seven points Likert scale
A pilot test was conducted to assess the quality and feasibility of the instrument. 5
SILS graduate students took the survey who mention they have experience of driving
with navigation systems. Their feedback includes adding page breaks the questionnaire
Students from the University of North Carolina at Chapel Hill (UNC-CH) were
used as subjects for this study because they are easier to get access, willing to respond.
The survey was distributed through Science of Information and Library Science (SILS)
mail lists, SILS twitter account, and random intercepts on campus. A URL to the online
survey is attached to the recruiting email after a brief introduction to this study.
102 responses were collected. All the respondents had used navigation applications
before. 76.5% (78 people) of the respondents had used navigation systems in the week
when they filled the survey. 74.5% (76 people) of the respondents said they used Google
Maps the most, 17.6% (18 people) chose Apple Maps as the navigation system they used
most, and 3.9% (4 people) chose Waze. The ages of the respondents ranged from 19 to
73. The majority (97.1%) fell between the ages of 19 and 48. The genders of the
Data analysis and results
Quantitative results
Data analysis was facilitated using the SPSS software operated under the MacOS
environment on a Macbook Pro laptop.
Common method bias (CMB) happens when variations in responses are caused by
the instrument rather than the actual predispositions of the respondents that the
instrument attempts to uncover. Harman's single-factor test was used to check for CMB.
If all variables load on one common factor or a factor accounts for the majority of the
variance, the test assumes there is a high level of CMB. All variables were entered
together except "Number of years using computers." Because when I entered this
variable, the system warned. ("There are fewer than two cases, at least one of the
variables has zero variance, there is only one variable in the analysis, or correlation
coefficients could not be computed for all pairs of variables. No further statistics will be
computed.") The reason behind this is the poor design with this question that all
respondents answer this item the same answer, "Over 3 years", thus there is no variability
on that item. So this item was deleted in later analysis. Exploratory factor analysis (EFA)
was used, and six factors were found with Eigenvalues greater than 1.0. The variance
explained ranged from 5.1% to 32.1% of the total. The results show that CMB is not a
Principal component analysis (PCA) with Varimax rotation was used to extract
factors. The factors with Eigenvalues greater than 1.0 were retained, and table 2 provides
the results of the factor analysis for each construct. All TRUST items loaded on one
factor, and Cronbach's alpha was 0.68, which exceeds the recommended Cronbach's
alpha threshold of 0.5. The percent variation explained was 61.1% and the Eigenvalue is
1.83. All PSR items loaded on one factor, and Cronbach's alpha was 0.82. The percent
variation explained was 74.1% and the Eigenvalue is 2.22. All PEU items loaded on one
factor, and Cronbach's alpha was 0.80. The percent variation explained was 71.8% and
the Eigenvalue is 2.15. All PSQ items loaded on one factor, and Cronbach's alpha was
0.68. The percent variation explained was 65.2% and the Eigenvalue is 1.96. All PSU
items loaded on one factor. Cronbach's alpha was 0.86. The percent variation explained
was 79.0% and the Eigenvalue is 2.37. All DEP items loaded on one factor. Cronbach's
alpha was 0.52. The percent variation explained was 67.6% and the Eigenvalue is 1.35.
All DPT items loaded on one factor. Cronbach's alpha was 0.78. The percent variation
explained was 70.7%, and the Eigenvalue is 2.12.
Table 2. Factor analysis for each construct
Overall trust (TRUST) Loadings
Q6. The navigation system is reliable. 0.77
Q7. In general, I can always rely on the navigation system to provide me the best route to my destination.
0.78
Cronbach’s alpha 0.68
Eigenvalue 1.83
Variance Explained 61.1%
Perceived system reputation (PSR) Loadings
Q9. This navigation system is well-known. 0.78
Q10. This navigation system has a good reputation in the market. 0.92
Q11. This navigation system has a reputation for being accurate. 0.88
Cronbach’s alpha 0.82
Eigenvalue 2.22
Variance Explained 74.1%
Perceived ease of use(PEU) Loadings
Q12. I think that learning to use the navigation system is easy. 0.80
Q13. I think the interaction with the navigation system is clear and understandable.
0.88
Q14. It’s easy for me to become skillful in the use of the navigation system.
0.86
Cronbach’s alpha 0.80
Eigenvalue 2.15
Variance Explained 71.8%
Perceived system quality (PSQ) Loadings
Q15. The navigation system provides up-to-date information. 0.89
Q16. The navigation system provides precise information. 0.85
Q17. The navigation system guarantees users’ privacy and security.
0.66
Cronbach’s alpha 0.68
Variance Explained 65.2%
Perceived system usefulness (PSU) Loadings
Q15. The navigation system provides up-to-date information. 0.88
Q16. The navigation system provides precise information. 0.89
Q17. The navigation system guarantees users’ privacy and security.
0.90
Cronbach’s alpha 0.86
Eigenvalue 2.37
Variance Explained 79.0%
Driver’s experience and proficiency with the system (DEP) Loadings
Q21. Prior to your participation in this study, how would you rate your level of experience in terms of using this navigation system?
0.82
Q22. How would you characterize your knowledge and experience with the navigation system you primarily use.
0.82
Cronbach’s alpha 0.52
Eigenvalue 1.35
Variance Explained 67.6%
Driver’s propensity to trust (DPT) Loadings
Q24. It is easy for me to trust people or things in my life. 0.91
Q25. I generally trust other people or things unless they give me a reason not to.
0.90
Q26. I tend to trust technology even when I have little knowledge about them.
0.69
Cronbach’s alpha 0.78
Eigenvalue 2.12
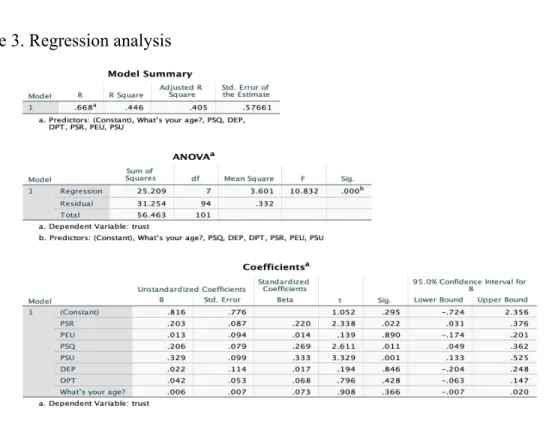
Regression analysis was used to test the relationships between the construct
variables and driver’s trust. The score of each construct variable was calculated for each
subject as the average of the items. Table 3 shows the results of the regression results on
TRUST as the dependent variable. From the results, hypothesis H1, H3, H4 was
supported and H2, H5, H6 was not supported. Moreover, the age of subjects cannot
significantly predict the TRUST score. Furthermore, the independent t-test shows that
there is no significant difference between the average TRUST scores of males and
females.
Table 3. Regression analysis
Qualitative Results
Eighty-nine of our 102 participants gave answers to the open-ended questions.
responses) think navigation systems are trustworthy. Their judgments were based on
three main factors, the overall performance, the company's reputation, and the trust in
technology.
First, most participants (51 responses) trust navigation systems because of their
excellent performance. "Most of the time, it is accurate;" "...very few recommended
directions have been incorrect." However, trust is valid only when they are talking about
information quality. Many participants (9 responses) showed their concerns about privacy
and security. "Trustworthy in terms of my ability to get places, yes. ...Trustworthy in
terms of my data collection? No, I do not trust any technology to fully protect my
privacy." "The app is connected to information on my phone, but has never requested
additional personal information that would make me uncomfortable." Thus, we can see
that trust can be multidimensional. People trust that navigation systems can provide
accurate route suggestions, but they are worried about their privacy and personal data.
Second, participants trust navigation systems because the company or the system
has a good reputation. Twelve responses mentioned that they trust the system because of
its good reputation or related content. "Made by big tech companies." "I think it's
trustworthy since it has such a huge number of users across the globe, and it's made by a
giant tech company…" "I believe google map has a good reputation in general, and all
my friends around me are using that." This finding is consistent with the previous study.
When the performance is at the same level, a good reputation can bring the product more
Third, participants trust navigation systems because they trust technology. In
other words, they think new technology can perform better than themselves for
navigation. Ten responses mentioned they trust the system because they trust the
technology behind it. "yes, as it's technology-driven." "Yes. The route is based on big
data." "The amount of time, money, and man-hours spent updating Google Maps makes
me trust it." Those responses can be related to the user's propensity to trust technology.
Even though they might not know every detail of the technology behind the system, they
tend to believe the system is trustworthy.
People get frustrated by many different things. One of them is the information lag.
"When the navigation system does not update my location quickly enough. Like it tells
me to take a turn after I have passed the road I need to turn onto." With the popularity of
5G, we can expect this issue to be addressed shortly. In addition, many participants
mentioned they had difficulty in plotting an alternate route. The mental load of driving
constrains drivers to interact with the navigation system. To solve this problem, some
companies use voice interaction, so drivers will not get distracted. However, most of
them do not work well since searching for a route is complex, and it is hard to describe a
route without visualizing it on a map.
Moreover, according to the qualitative data, participants tend to question the
navigation more when they are familiar with an area, and the system told them to go to an
efficient route than what I know is possible." "Shortest route could be another way I've
Discussion
Perceived system reputation was found to influence a driver's trust in the
navigation system (H1). The higher the perceived reputation of a navigation system, the
more users will trust in the navigation system. This finding provides additional support
for studies previously done in e-commerce. It suggests that drivers do rely on reputation
to determine whether or not the system is trustworthy. Thus, for system designers, the
method used to improve its reputation, such as advertisement, can be very important for
raising its users' trust.
Perceived ease of use was not found to influence a driver's trust in the navigation
system (H2). Maybe it is because of the ease of use, and the trustworthiness of the system
are two different concepts in this situation. There is no strong connection between them.
For example, after lots of design iteration, we can say that all of the popular navigation
systems such as Google Maps and Apple maps are all relatively simple and easy to use,
and the process to search and navigate to a destination is similar. Nevertheless, we can
still doubt the information it provides and our data privacy on that platform. Even if it is
easy to use, it does not mean it is trustworthy. Perceived system quality was found to
influence a driver's trust in the navigation system (H3). This finding is consistent with
previous studies. The higher the perceived quality of a navigation system, the more users
driver's trust in the navigation system (H4). The result is consistent with previous
studies. The higher the perceived usefulness of a navigation system, the more users will
trust in the navigation system. For system designers, the finding indicates that, besides
the system quality, the system needs to provide useful features that can help users in real
life.
The driver's experience and proficiency with the system and driver's propensity to
trust were not found to influence a driver's trust in the navigation system (H5 & H6). The
finding indicates that even for experienced users, they may still distrust their primary
used navigation systems. The reason behind this finding might be the uncertainty of the
performance of navigation systems. From the responses of open questions, many
participants mentioned that most of the time, the navigation is accurate. However,
sometimes the system gives wrong information, which makes them question the system.
For H6, the behind reason may be that people's propensity to trust people and things can
be different from their propensity to trust technology. In other words, people with high
trust propensity to people can have low trust propensity to technology at the same time.
The open question responses show that participants think navigation systems are
trustworthy in general. They built their trust from the overall excellent performance, a
good reputation of the system, and a propensity to trust technology. However, their trust
can be conditional. They trust the system about its performance; at the same time, they
distrust it about the privacy issue. Privacy is the dilemma many tech companies are
have to collect more personal information. At the same time, designers need to make
users feel comfortable and safe about their privacy.
Moreover, they tend to question the system more when driving on familiar routes.
System designers should consider which route, the most efficient one, calculated by the
computer or the driver's most familiar one, they should recommend to the user. Future
research can take a look at what the driver will decide to act when they encounter this
Limitations and future research
First, this study used mainly university students as survey subjects. In order to
have a more diverse sample, future studies should include data from other age groups and
occupations. They may have different behaviors and habits of using technologies. For
example, in this study, highly educated university students are relatively more
knowledgeable about technology and tend to have more concerns about privacy issues.
So they are more likely to distrust technology.
Second, the sample size of 102 of this study is relatively small. This small sample
size may affect the results with the factor analyses. Future research should increase the
sample size to see if different results will be found.
Third, another limitation of the current study is the definition of the navigation
system. In this study, the navigation system is limited to the mobile navigation
application, expressly, Google maps and Apple maps. The results may not be suitable for
all kinds of navigation technologies, such as GPS navigation devices or navigation
applications installed on car multimedia systems, or future navigation systems (like heads
up display on windshields). Therefore, future studies should examine the proposed model
Last, a more formal and detailed pilot test is needed to improve the items in the
survey before distribution. For example, the Q23 “Number of years of using computers,”
The choices are problematic since all participants have over three years of Internet
experience. However, the problem was not found until a larger number of responses were
Conclusion
The Driver's trust in navigation systems was found to be influenced by perceived
system reputation, perceived system quality, and perceived system usefulness. Thus, to
improve users' trust, navigation system designers should strive to improve their
reputation, for example, gain third party recognition or advertising to impress people.
Also, besides presenting a trustworthy application, the ultimate goal of a navigation
system is to provide useful features that can help users. For example, according to open
question responses, providing more explanations when the suggested route is different
from users' familiar route, and improving the user experience of plotting alternate routes
while driving.
The findings from this study show that the model of users' trust in navigation
systems is different from users' trust in e-commerce. Driver-based trust, Driver's
experience, and proficiency with the system and Driver's propensity to trust are proved
that have no significant effect on drivers' overall trust in the navigation system. New
models need to be created to determine and explain other factors influencing the trust in
Appendix: survey
1. Have you used navigation applications before? (Navigation systems are defined as navigation applications or map applications installed on your phone that can help you find and follow routes. Such as Google Maps, Apple Maps, Waze...)
○ Yes ○ No
2. (If yes in question 1) When was the last time you used it? ○ This week
○ Last week
○ Last three months ○ Last year
3. (If yes in question 1) Which navigation system did you use most of the time? ○ Google Maps
○ Apple Maps ○ Waze ○ Other_____
4. What’s your age? _____
5. What’s your gender? ○ Male
○ Female ○ Other_____ ○
Based on your experience with the most commonly used navigation system, answer the following questions.
Strongly disagree
Disagree Somewha t disagree Neither agree nor disagree Somewha t agree
Agree Strongly agree
⃝ ⃝ ⃝ ⃝ ⃝ ⃝ ⃝
7. In general, I cannot always rely on the navigation system to provide me the best route to my destination.
Strongly disagree
Disagree Somewha t disagree Neither agree nor disagree Somewha t agree
Agree Strongly agree
⃝ ⃝ ⃝ ⃝ ⃝ ⃝ ⃝
8. I believe this navigation system is trustworthy. Strongly
disagree
Disagree Somewha t disagree Neither agree nor disagree Somewha t agree
Agree Strongly agree
⃝ ⃝ ⃝ ⃝ ⃝ ⃝ ⃝
9. This navigation system is well-known. Strongly
disagree
Disagree Somewha t disagree Neither agree nor disagree Somewha t agree
Agree Strongly agree
⃝ ⃝ ⃝ ⃝ ⃝ ⃝ ⃝
10. This navigation system has a good reputation in the market. Strongly
disagree
Disagree Somewha t disagree Neither agree nor disagree Somewha t agree
Agree Strongly agree
11. This navigation system has a reputation for being accurate. Strongly
disagree
Disagree Somewha t disagree Neither agree nor disagree Somewha t agree
Agree Strongly agree
⃝ ⃝ ⃝ ⃝ ⃝ ⃝ ⃝
12. I think that learning to use the navigation system is easy. Strongly
disagree
Disagree Somewha t disagree Neither agree nor disagree Somewha t agree
Agree Strongly agree
⃝ ⃝ ⃝ ⃝ ⃝ ⃝ ⃝
13. I think the interaction with the navigation system is clear and understandable. Strongly
disagree
Disagree Somewha t disagree Neither agree nor disagree Somewha t agree
Agree Strongly agree
⃝ ⃝ ⃝ ⃝ ⃝ ⃝ ⃝
14. It’s easy for me to become skillful in the use of the navigation system. Strongly
disagree
Disagree Somewha t disagree Neither agree nor disagree Somewha t agree
Agree Strongly agree
⃝ ⃝ ⃝ ⃝ ⃝ ⃝ ⃝
15. The navigation system provides up-to-date information. Strongly
disagree
Disagree Somewha t disagree Neither agree nor disagree Somewha t agree
⃝ ⃝ ⃝ ⃝ ⃝ ⃝ ⃝
16. The navigation system provides precise information. Strongly
disagree
Disagree Somewha t disagree Neither agree nor disagree Somewha t agree
Agree Strongly agree
⃝ ⃝ ⃝ ⃝ ⃝ ⃝ ⃝
17. The navigation system guarantees users’ privacy and security. Strongly
disagree
Disagree Somewha t disagree Neither agree nor disagree Somewha t agree
Agree Strongly agree
⃝ ⃝ ⃝ ⃝ ⃝ ⃝ ⃝
18. Using this navigation system would make it easy for me to figure out the route when I drive.
Strongly disagree
Disagree Somewha t disagree Neither agree nor disagree Somewha t agree
Agree Strongly agree
⃝ ⃝ ⃝ ⃝ ⃝ ⃝ ⃝
19. Using this navigation system helps me to find and follow routes in a more efficient way.
Strongly disagree
Disagree Somewha t disagree Neither agree nor disagree Somewha t agree
Agree Strongly agree
⃝ ⃝ ⃝ ⃝ ⃝ ⃝ ⃝
Strongly disagree
Disagree Somewha t disagree Neither agree nor disagree Somewha t agree
Agree Strongly agree
⃝ ⃝ ⃝ ⃝ ⃝ ⃝ ⃝
21. How would you rate your level of experience in terms of using navigation systems in general?
Extremely unfamiliar Unfamilia r Somewha t unfamiliar Neither familiar nor unfamiliar Somewha t familiar
familiar Extremely familiar
⃝ ⃝ ⃝ ⃝ ⃝ ⃝ ⃝
22. How would you characterize your knowledge and experience with the navigation system you primarily use.
Extremely unfamiliar Unfamilia r Somewha t unfamiliar Neither familiar nor unfamiliar Somewha t familiar
familiar Extremely familiar
⃝ ⃝ ⃝ ⃝ ⃝ ⃝ ⃝
23. Number of years using computers. Less than 1
year
1 2 3 Over 3 years
⃝ ⃝ ⃝ ⃝ ⃝
24. It is easy for me to trust people or things in my life. Strongly
disagree
Disagree Somewha t disagree Neither agree nor disagree Somewha t agree
⃝ ⃝ ⃝ ⃝ ⃝ ⃝ ⃝
25. I generally trust other people or things unless they give me a reason not to. Strongly
disagree
Disagree Somewha t disagree
Neither agree nor
disagree
Somewha t agree
Agree Strongly agree
⃝ ⃝ ⃝ ⃝ ⃝ ⃝ ⃝
26. I tend to trust technology even when I have little knowledge about them. Strongly
disagree
Disagree Somewha t disagree
Neither agree nor
disagree
Somewha t agree
Agree Strongly agree
⃝ ⃝ ⃝ ⃝ ⃝ ⃝ ⃝
27. Do you think your navigation system is trustworthy? What are the main reasons that make you think so?
28. Are there times you question what it tells you? Why do you question it?
Bibliography
Agag, G. M., & El-Masry, A. A. (2017). Why Do Consumers Trust Online Travel
Websites? Drivers and Outcomes of Consumer Trust toward Online Travel Websites. Journal of Travel Research, 56(3), 347–369.
https://doi.org/10.1177/0047287516643185
Aiken, K. D. (2006). Trustmarks, Objective-Source Ratings, and Implied
Investments in Advertising: Investigating Online Trust and the Context-Specific
Nature of Internet Signals. Journal of the Academy of Marketing Science, 34(3), 308–323.https://doi.org/10.1177/0092070304271004
Amin, M., Rezaei, S., & Abolghasemi, M. (2014). User satisfaction with mobile websites: The impact of perceived usefulness (PU), perceived ease of use
(PEOU) and trust. Nankai Business Review International, 5(3), 258–274. https://doi.org/10.1108/NBRI-01-2014-0005
Beldad, A., de Jong, M., & Steehouder, M. (2010). How shall I trust the faceless and the intangible? A literature review on the antecedents of online trust. Computers in Human Behavior, 26(5), 857–869.https://doi.org/10.1016/j.chb.2010.03.013
Casalo, L. V., Flavián, C., & Guinalíu, M. (2007). The Influence of Satisfaction, Perceived Reputation and Trust on a Consumer’s Commitment to a Website.
Journal of Marketing Communications, 13(1), 1–17. https://doi.org/10.1080/13527260600951633
study. Electronic Commerce Research and Applications, 6(2), 171–182. https://doi.org/10.1016/j.elerap.2006.11.008
Chen, C. (2006). Identifying Significant Factors Influencing Consumer Trust in an Online Travel Site. Information Technology & Tourism, 8(3), 197–214. https://doi.org/10.3727/109830506778690849
Cheng, T. C. E., Lam, D. Y. C., & Yeung, A. C. L. (2006). Adoption of internet banking: An empirical study in Hong Kong. Decision Support Systems, 42(3), 1558–1572.https://doi.org/10.1016/j.dss.2006.01.002
Cheung, C. M., & Lee, M. K. (2001). Trust in Internet Shopping: Instrument Development and Validation through Classical and Modern Approaches.
Journal of Global Information Management, 9(3), 23–35. https://doi.org/10.4018/jgim.2001070103
Corbitt, B. J., Thanasankit, T., & Yi, H. (2003). Trust and e-commerce: A study of consumer perceptions. Electronic Commerce Research and Applications, 2(3), 203–215.https://doi.org/10.1016/S1567-4223(03)00024-3
Davis, F. D. (1989). Perceived Usefulness, Perceived Ease of Use, and User Acceptance of Information Technology. MIS Quarterly, 13(3), 319. https://doi.org/10.2307/249008
Filieri, R., Alguezaui, S., & McLeay, F. (2015). Why do travelers trust TripAdvisor? Antecedents of trust towards consumer-generated media and its influence on recommendation adoption and word of mouth. Tourism Management, 51, 174–185.https://doi.org/10.1016/j.tourman.2015.05.007
Information Review, 32(6), 818–841.
https://doi.org/10.1108/14684520810923953
Hsu, M.-H., Chang, C.-M., Chu, K.-K., & Lee, Y.-J. (2014). Determinants of repurchase intention in online group-buying: The perspectives of DeLone &
McLean IS success model and trust. Computers in Human Behavior, 36, 234–245.https://doi.org/10.1016/j.chb.2014.03.065
Hwang, P., & Burgers, W. P. (1997). Properties of Trust: An Analytical View.
Organizational Behavior and Human Decision Processes, 69(1), 67–73. https://doi.org/10.1006/obhd.1996.2673
Jian, J.-Y., Bisantz, A. M., & Drury, C. G. (2000). Foundations for an Empirically Determined Scale of Trust in Automated Systems. International Journal of Cognitive Ergonomics, 4(1), 53–71.
https://doi.org/10.1207/S15327566IJCE0401_04
Jøsang, A., Ismail, R., & Boyd, C. (2007). A survey of trust and reputation systems for online service provision. Decision Support Systems, 43(2), 618–644. https://doi.org/10.1016/j.dss.2005.05.019
Kim, D. J., Ferrin, D. L., & Rao, H. R. (2008). A trust-based consumer
decision-making model in electronic commerce: The role of trust, perceived
risk, and their antecedents. Decision Support Systems, 44(2), 544–564. https://doi.org/10.1016/j.dss.2007.07.001
Kim, M.-J., Chung, N., & Lee, C.-K. (2011). The effect of perceived trust on electronic commerce: Shopping online for tourism products and services in
Large, D. R., & Burnett, G. E. (2014). The effect of different navigation voices on trust and attention while using in-vehicle navigation systems. Journal of Safety Research, 49, 69.e1-75.https://doi.org/10.1016/j.jsr.2014.02.009
Lee, M. K. O., & Turban, E. (2001). A Trust Model for Consumer Internet Shopping. International Journal of Electronic Commerce, 6(1), 75–91. https://doi.org/10.1080/10864415.2001.11044227
Liao, C., Palvia, P., & Lin, H.-N. (2006). The roles of habit and web site quality in e-commerce. International Journal of Information Management, 26(6), 469–483.https://doi.org/10.1016/j.ijinfomgt.2006.09.001
Mayer, R. C., Davis, J. H., & Schoorman, F. D. (1995). An Integrative Model Of Organizational Trust. Academy of Management Review, 20(3), 709–734. https://doi.org/10.5465/amr.1995.9508080335
McCole, P. (2002). The role of trust for electronic commerce in services.
International Journal of Contemporary Hospitality Management, 14(2), 81–87. https://doi.org/10.1108/09596110210419264
McKnight, D. H., Choudhury, V., & Kacmar, C. (2002). Developing and Validating Trust Measures for e-Commerce: An Integrative Typology. Information Systems Research, 13(3), 334–359.https://doi.org/10.1287/isre.13.3.334.81
Paul A. Pavlou. (2003). Consumer Acceptance of Electronic Commerce: Integrating Trust and Risk with the Technology Acceptance Model. International Journal of Electronic Commerce, 7(3), 101–134.
https://doi.org/10.1080/10864415.2003.11044275
Pavlou, & Fygenson. (2006). Understanding and Predicting Electronic Commerce Adoption: An Extension of the Theory of Planned Behavior. MIS Quarterly,
Pavlou, Liang, & Xue. (2007). Understanding and Mitigating Uncertainty in Online Exchange Relationships: A Principal-Agent Perspective. MIS Quarterly, 31(1), 105.https://doi.org/10.2307/25148783
Teo, T., & Liu, J. (2007). Consumer trust in e-commerce in the United States, Singapore and China. Omega, 35(1), 22–38.
https://doi.org/10.1016/j.omega.2005.02.001
Trapsilawati, F., Wijayanto, T., Jourdy, E. S., & Department of Mechanical and Industrial Engineering, Faculty of Engineering, Universitas Gadjah Mada. (2019). Human-computer trust in navigation systems: Google maps vs waze.