ASSOCIATION BETWEEN QUADRICEPS STRENGTH AND TIBIOFEMORAL CARTILAGE PROTEOGLYCAN DENSITY AT 6 MONTHS FOLLOWING
ANTERIOR CRUCIATE LIGAMENT RECONSTRUCTION
Christian David Hunt
A thesis submitted to the Faculty at the University of North Carolina at Chapel Hill in partial fulfillment of the requirements for the degree of Master of Arts in the Exercise
and Sports Science Department in the College of Arts and Sciences.
Chapel Hill 2017
Approved by:
Brian Pietrosimone
Troy Blackburn
© 2017
ABSTRACT
Christian David Hunt: Association between quadriceps strength and tibiofemoral cartilage proteoglycan density at 6 months following Anterior Cruciate ligament
reconstruction.
(Under the direction of Brian Pietrosimone)
Anterior Cruciate ligament (ACL) injury is common in the active population.
ACL Reconstruction (ACLR) is used to restore stability and allow for return to activity
post-ACL injury. A common impairment following ACLR is decreased quadriceps
strength in the injured limb, which has been linked to the development of
Tibiofemoral Osteoarthritis (OA). Compositional magnetic resonance imaging (MRI)
has shown the ability to identify early cartilage changes prior to cartilage structural
damage. This preliminary investigation evaluated the association between isometric
quadriceps strength and T1rho compositional MRI in weight-bearing regions of
tibiofemoral cartilage in 24 subjects at 6 months post-ACLR. We found evidence of
compositional changes, measured via T1rho relaxation time, with little change to
cartilage volume. There was also a statistically significant association between
quadriceps strength and T1rho relaxation times for the three regions of the medial
femoral condyle, calling for additional research into the interaction of quadriceps and
TABLE OF CONTENTS
ABSTRACT ... III TABLEOFCONTENTS ... IV LISTOFTABLES ... VII LISTOFFIGURES ... VIII LISTOFABBREVIATIONS ... IX
CHAPTER I ...1
INTRODUCTION ...1
SPECIFIC AIMS...5
CLINICAL SIGNIFICANCE ...6
CHAPTER II ...7
Cartilage Health and Function... 7
ACL Injury Role in Knee OA Development ... 9
Damage to Cartilage ... 10
Bone Marrow Lesion ... 12
The Meniscus ... 13
Presence of Inflammatory Mediators ... 14
QUADRICEPS MUSCLE GROUP AND OA DEVELOPMENT POST-ACLR ... 14
Quadriceps Strength Post-ACLR ... 15
Quadriceps Strength Reduction and Biomechanics... 16
Quadriceps Strength and OA ... 17
Radiography ... 19
Magnetic Resonance Imaging... 20
T1rho ... 22
CHAPTER III ... 25
METHODS ... 25
Participants ... 25
ACLR and Therapeutic Rehabilitation ... 26
PROCEDURES ... 26
Quadriceps Strength Measurement ... 26
Magnetic Resonance Imaging of the Articular Cartilage ... 27
Magnetic Resonance Acquisition ... 27
Articular Cartilage Segmentation... 28
T1rho Relaxation Time Quantification ... 29
STATISTICS ... 30
RESULTS ... 32
T1rho Segmentation... 32
Inter-Rater Reliability ... 32
Intra-Rater Reliability ... 33
Differences in T1rho Relaxation Times ... 33
Cartilage Volume ... 33
Quadriceps Strength and T1rho Values ... 34
Post Hoc Analysis ... 34
DISCUSSION ... 34
T1rho Relaxation Times ... 35
Quadriceps Strength Post-ACLR ... 38
Quadriceps Strength Post-ACLR and Knee Function ... 39
Quadriceps Strength and Cartilage Health ... 40
Conclusion ... 44
LIST OF TABLES
Table 1. Subject Demographics ... 45
Table 2. Inter-Rater Reliability ... 46
Table 3. Intra-Rater Reliability ... 47
Table 4. Mean T1rho Values ... 48
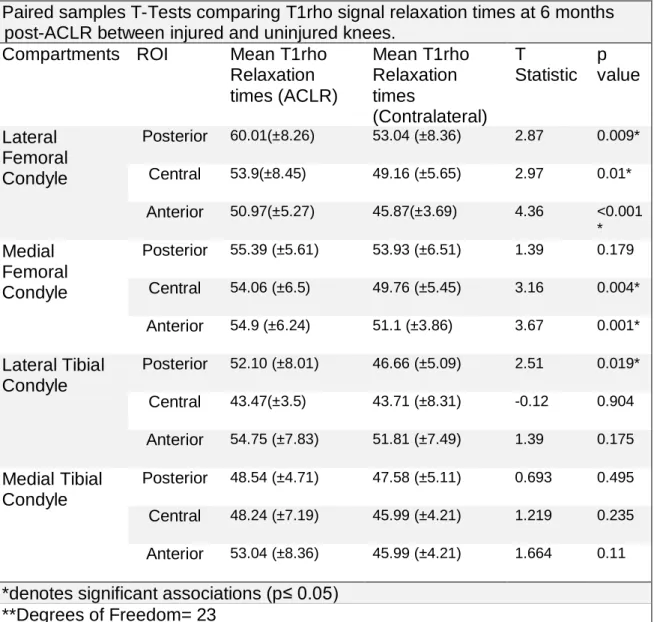
Table 5. Results of Paired Samples T-Test for T1rho Relaxation Times ... 67
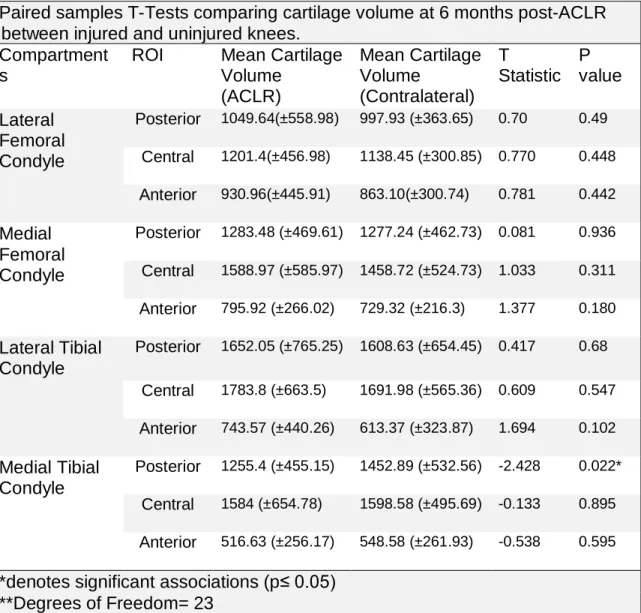
Table 6. Results of Paired Samples T-Test for Cartilage Volume ... 68
LIST OF FIGURES
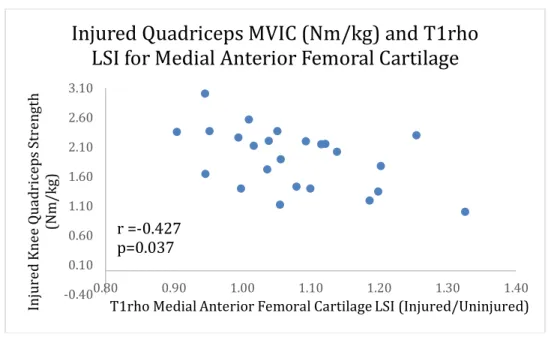
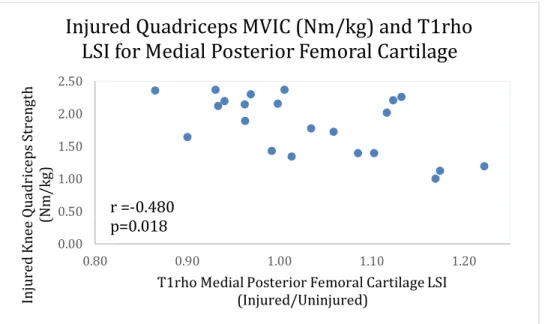
Figure 1. Scatterplot of association between Injured MVIC
and T1rho LSI for MFC 1 ... 70
Figure 2. Scatterplot of association between Injured MVIC
and T1rho LSI for MFC 2 ... 70
Figure 3. Scatterplot of association between Injured MVIC
LIST OF ABBREVIATIONS
ACL Anterior Cruciate Ligament
ACLR Anterior Cruciate Ligament Reconstruction
ATT Anterior Tibial Translation
BB Bone Bruise
BML Bone Marrow Lesion
GAG Glycosaminoglycans
IKDC International Knee Documentation Committee
JSN Joint Space Narrowing
KOOS Knee Injury and Osteoarthritis Score
LFC Lateral Femoral Condyle
LTC Lateral Tibia Condyle
LSI Limb Symmetry Index
MFC Medial Femoral Condyle
MRI Magnetic Resonance Imaging
MTC Lateral Tibia Condyle
MVIC Maximal Voluntary Isometric Contraction
OA Osteoarthritis
PG Proteoglycans
CHAPTER I
Introduction
Anterior cruciate ligament (ACL) injury accounts for 50% of all knee injuries in
the athletic population1. Additionally, ACL injuries occur generally in a younger and
more active population, with 18 years of age being the median age of ACL injured
patients2. Surgical ACL reconstruction (ACLR) is often used to improve static knee
stability and return patients to physical activity3,4. Treatment of ACL injury accounts
for over 1 billion dollars in associated costs in the United States annually1. Despite
modern advancements in ACLR techniques and improved knowledge and
application of rehabilitation and strengthening programs, those who have torn their
ACL are still at an increased risk of either tearing the graft in the ACLR limb or the
ACL in the contralateral limb5. While the re-injury rate is alarming, the long-term
consequences of ACL injury and ACLR, specifically the risk of developing
tibiofemoral osteoarthritis(OA), add additional cause for concern6-10. The
development of OA results in increased medical costs annually of over 12,200
dollars11, and currently does not have a functional cure12. Those who have
experienced ACLR are both more likely to develop OA13 and develop it sooner than
those who have not14-16. In a systematic review of the literature, 36% (286/795) of
osteoarthritis within the first decade of ACLR, 48% (702/1468) demonstrated OA in
the second decade, and 42% (100/237) demonstrated OA in the third decade7.
Currently, the pathogenesis related to knee OA onset is unknown8, yet it has been
suggested that a combination of acute and chronic factors contribute to its
development post-ACLR17.
The factors that have been suggested to contribute to the acute development
of knee OA are varied: initial damage to the cartilage18, damage to the meniscus at
the initial time of injury19, and alterations in tissue composition due to the presence
of inflammatory mediators8. Some chronic contributors to the development of knee
OA are altered joint proprioception20 and reduced strength of the quadriceps
musculature21, both of which combine to alter the kinematics of the knee during
walking gait.
Cartilage is influenced by the loads placed upon it22, and the preservation of
functional joint biomechanics following ACLR is paramount to maintaining long-term
joint health23. Individuals with ACLR demonstrate altered joint kinematics via smaller
knee flexion angles24, as well as greater tibial external rotation during knee
flexion25,26 and greater anterior tibial translation27 compared to healthy controls in
walking gait. There are also alterations in knee motions via changes to joint kinetics
such as changes in the knee flexion moment{Hart, 2015 #148}, and knee adduction
moment22,28 during more dynamic motions such as the single leg hop, when
compared to uninjured controls. These alterations in joint kinematics result in
subsequent alterations in the patterning of load experienced by the tibiofemoral
One of the most vital components to the preservation of knee kinetics is the
strength of the quadriceps muscle group. Quadriceps strength contributes to the
balancing of forces acting on the knee29 by transferring forces through the knee21.
Quadriceps strength is markedly reduced post-ACL injury and surgical
reconstruction30-33. These reductions in knee extension strength contribute to the
higher mechanical forces experienced by the tibiofemoral joint34,35 and cartilage
degradation within the knee. The presence of a low quadriceps to hamstring ratio
(r=0.6) and lower quadriceps strength index (r=0.39) 6 months post-ACLR have
been associated with the development of knee OA36. Finally, deficits in quadriceps
strength are associated with increased joint space narrowing(JSN), an indicator of
knee OA, at 4 years post-ACLR37. In the case of these studies, the authors called for
additional research to evaluate quadriceps strength in conjunction with quantifiable
measures of knee tibiofemoral cartilage health in order to better understand the
pathogenesis of posttraumatic knee OA.
In the identification and diagnosis of knee OA, the ability to obtain accurate
imaging of knee cartilage may allow for the development of appropriate interventions
to ensure a higher quality of life in the patient post-surgery38-40. Radiographs are
currently used as a method to diagnosis knee OA. However, this technique is limited
as radiography depends on indirect measures of cartilage via quantification of the
joint space width or the presence of osteophyte formation due to its inability to view
cartilage directly41. Magnetic resonance imaging (MRI) is more sensitive for
identifying structural damage to knee cartilage42. Structural MRI has been used to
consecutive imaging sessions. It is important to consider, however, that at the
earliest stages of knee OA, there are alterations in cartilage composition prior to
changes in the overall thickness of the cartilage43. Structural MRI is unable to
capture these early cartilage alterations, and thus is limited in its capacity to capture
the earliest stages of OA. These limitations in current conventional techniques call
for procedures capable of identifying alterations in cartilage at a compositional
level44.
T1rho MRI imaging is emerging as a technique that enables researchers to
quantify changes in knee cartilage before structural deformations occur25. T1rho
evaluates movement of water molecules as they progress through the hyaline
cartilage of the knee, measured in milliseconds (ms). Healthy cartilage consists of a
high quantity of proteoglycans (PGs) and glycosaminoglycans (GAGs). These
cellular constituents of cartilage influence the movement of water molecules through
the cartilage tissue. In cartilage that has experienced compositional damage, the
densities of PGs and GAGs are reduced, resulting in a more rapid movement of
water within the cartilage and consequently an elevated T1rho relaxation time45. The
ability of T1rho imaging to provide information regarding proteoglycan density
permits it to be used to identify cartilage that is in a pre-OA state.
Early identification of modifiable contributing factors to the development of OA
will aid clinicians in the selection of interventions that could prevent OA
development. Quadriceps weakness has previously been reported as a contributor
to OA development35, but the relationship between muscle strength and early
MRI is a current imaging technique that reflects proteoglycan density in tibiofemoral
cartilage46 and proteoglycan depletion is an early sign of OA development. There
currently is a lack of research into the relationship between quadriceps strength and
proteoglycan density. Therefore, identifying the association between quadriceps
strength and cartilage T1rho relaxation values post-ACLR would help build evidence
of the role quadriceps strength has on very early compositional changes in a young
population at risk for posttraumatic OA following ACLR. The presence of a strong
association would contribute to the understanding of the role that quadriceps
strength has on early changes to cartilage composition post-ACLR , and drive
increased emphasis to the improvement of strength post-ACLR to facilitate long-term
joint health.
Specific Aims
o Specific Aim 1: Compare T1rho relaxation times and cartilage volume
between the injured and uninjured limbs at 6 months post-ACLR in 6
weight-bearing regions of interest (ROI) of the tibia and femur.
▪ Hypothesis: ACL injured limbs will demonstrate a higher mean T1rho
relaxation time than the uninjured limbs, while exhibiting no difference
in cartilage volume.
o Specific Aim 2: Identify the magnitude and direction of the association
between quadriceps strength and mean T1rho relaxation times in the
• Hypothesis 1: Lower quadriceps strength of the injured limb will be
moderately associated with elevated T1rho LSI in the weight bearing
ROI of the femur and the tibia.
• Hypothesis 2: Lower quadriceps strength LSI will be moderately
correlated with elevated T1rho LSI.
Clinical significance
Determination of the association between T1rho relaxation times and
quadriceps isometric strength will add to the body of evidence highlighting the role of
quadriceps muscle strength in cartilage health post-ACLR. If a moderate negative
correlation exists between quadriceps strength and the T1rho relaxation times,
added emphasis should be placed on regaining quadriceps strength early following
ACLR and maintain quadriceps strength following ACLR in order to promote
CHAPTER II
Cartilage Health and Function
Any discussion of tibiofemoral OA must begin with having a prior understanding
of cartilage structure. The hyaline cartilage that comprises the tibiofemoral joint is
generally between 3 to 4mm thick and covers the regions of the medial and lateral
femoral condyles, as well as the medial and lateral tibial plateaus39. The tissue
composition is 65% to 85% water, with the remaining weight comprising of an
extracellular matrix consisting of type II collagen (15-20%), proteoglycans (3-10%)39,
and cartilage-producing chondrocytes (less than 10%)47.
The structural organization of cartilage consists of various layers of tissue
through a complex extracellular matrix48. The superficial layer of cartilage is
arranged as to create a low friction surface to promote the arthrokinetic motions of
roll and glide. This layer consists of thin elongated chondrocytes with fibers resting
parallel to the surface and is densely packed with type II collagen47. This results in
cartilage that is strong, but has a limited capacity to heal itself due to its avascular
nature47. If damage is sustained by the superficial layer, the chondrocytes will lay
down type I cartilage or a fibrocartilaginous scar tissue which lacks the load bearing
The second, or transitional layer consists of larger diameter fibers that are
randomly dispersed through the tissue matrix. It has chondrocytes which are more
metabolically active, which provide an increased capacity for collagen remodeling
and healing50. The deep zone contains still larger chondrocyte fibers that are
oriented vertically relative to the underlying bone and articular surface. This zone’s
high proteoglycan and water content lend this layer to be better suited to resist
compressive forces47.
Proteoglycans are a vital constituent of cartilage health that are synthesized by
the chondrocytes, and consist of glycosaminoglycans attached to a protein core.
Proteoglycans are hydrophilic, which enables them to draw water from the
extracellular matrix. This generates a “swelling” pressure which serves to counteract
the pressure experienced by the cartilage during weight-bearing that drives water
out of the extracellular matrix51. Due to this interaction, the distribution of
proteoglycans in the tibiofemoral cartilage is not homogenous throughout the
tissue48. Specifically, the portions of the cartilage that are subject to greater
compression stress show higher content of proteoglycans, which makes these areas
stiffer and better able to resist deformation52. The density of proteoglycans is found
to be almost 34% higher in the weight-bearing zones of the tibiofemoral cartilage
relative to non-weight-bearing sections53.
With proteoglycans being vital to the healthy structure of cartilage, their damage
and subsequent depletion has highly deleterious effects on cartilage integrity and
significantly lower levels of compression in proteoglycan-depleted cartilage than in
healthy cartilage51.
ACL Injury Role in Knee OA Development
Anterior cruciate ligament (ACL) injury commonly occurs within the athletic
population1. Oftentimes, reconstructive surgery (ACLR) is used in an attempt to
recoup stability in the knee joint in the younger or more physically active patient
population55. However, a recent review of the literature found that patients who had
received ACLR were diagnosed with an increased prevalence of tibiofemoral
osteoarthritis (OA): 44% of those who received ACLR as opposed to the 37% of
those who did not receive surgery7. This indicates that while ACLR is promoted as a
procedure to help provide ligamentous stability and help the athlete return to
previous activity levels, ACLR does not provide protection against concurrent
slow-developing pathologies. The odds ratio for slow-developing OA post-ACL surgery is 4.2
(3.11,5.99)56 to 7.0 (3.5-13.9)57. This means that those who have had an ACL injury
and concomitant surgery are 4 to 7 times more likely to develop knee OA than
healthy individuals.
With regards to the timing of knee OA, there has traditionally been a noted range
of time of 1016 to 1557 years between ACLR surgery and the consequent diagnosis
of OA. In the research conducted by Nordenvall et al. evidence of radiographic
tibiofemoral OA was found in 10% of patients post-ACLR. In a study conducted by
Von Porat et al., 78% of patients had noted structural changes evidenced by
structural changes, 41% had structural deformities severe enough to qualify them to
be diagnosed with OA58.
The development of cartilage degeneration after ACLR is initiated and driven
by a variety of factors17. One study evaluated 62 subjects after ACLR surgery and
evaluated for 10 different variables to identify characteristics that could be utilized to
identify those who are at risk for post-traumatic tibiofemoral OA. Of the 10, the
variables that showed the strongest discriminators for developing OA were the
presence of meniscus damage/meniscectomy (r= 0.72) receiving chondral damage
in the initial injury (r=0.41) and the presence of a weak quadriceps muscle group
(r=0.39)36. Another strong contributor to the development of post-traumatic OA is the
presence and severity of bone marrow lesions19,59.
Damage to Cartilage
Injuries to the ACL are generally classified as pertaining to one of two
categories due to their mechanism, contact or noncontact, with almost 70% of the
injuries seen being attributed to a noncontact mechanism55. During noncontact
injury, the patient is generally cutting, jumping, or pivoting on one leg. The vertical
loading from the jump results in a force of approximately 6 times the patient’s
bodyweight that is experienced by the tibiofemoral joint60. At impact, the tibiofemoral
cartilage is subjected to a high degree of stress by the compressive and shear loads
placed upon it, resulting in damage to the cartilage as well as the ACL9. Injuries to
the tibial plateau have been found to be significantly dependent on the loading
placed under load, found that that while no relationship existed between stabilizing
structures of the knee joint and loading patterns for ACL injury, tibial plateau injury
patterns were significantly dependent on their respective loading condition for
cartilage damage61. This finding was corroborated by an observational analysis
completed by Potter et al. This study observed the damage sustained by the
cartilage in a ACL injury over the course of 11 years using a cohort of 40 subjects
who had experienced an isolated ACL tear. 2 subjects suffered a subsequent ACL
tear in the course of the study, bringing the total knees observed to 42 knees. Of the
42 knees injured in the course of the study, all of the patients had visible damage to
the cartilage along the lateral tibial plateau at the time of initial injury as visualized by
MRI9. An arthroscopic study done by Hirose et al., found that in 23 subjects who had
a traumatic ACL tear, 15 of them experienced damage to the articular cartilage. Of
those who experienced damage, 8 had damage isolated to the medial femoral
condyle (MFC), 5 had damage to both medial and lateral femoral condyles(LFC),
and 2 had damage to the MFC, LFC and lateral tibial plateaus (LTP)62.
Cartilage is a dynamic structure whose thickness63 and composition64 are
subject to change. In a study by Frobell et al., 61 subjects had MRI measurements
of their tibiofemoral cartilage over the course of 2 years at the 3, 6, 12, and 12 month
post-ACL injury time points. Frobell found that cartilage thickened over central
medial aspect of femur (+2.7% percentage change) and significantly thinned in
posterior femur in the medial (-2.6% change) lateral zones (-2.6% change)65. This
change in cartilage thickness profile is due to the altered loads placed upon the knee
Bone Marrow Lesion
In an ACL injury, not only is the cartilage acutely damaged but there is the
damage to the underlying subchondral bone61. This is associated with a pattern of
bruising which extends from the cortical layer of bone into the deeper tissue,
described in the literature as a bone bruise (BB) or bone marrow lesion (BML). BML
are found in conjunction with an ACL injury in 30-70% of the instances67. BML will
appear on an MRI as increased signal intensity in the subchondral bone near the
osteochondral junction68. BMLs are more often found on the lateral side of the knee
due to the increased abduction moment experienced by the knee in noncontact ACL
injuries69-71. The presence of BML have been seen at the time of injury43,59,63,65,72,73
and will generally decrease in size over time43. In a study by Frobell in 2011, at
diagnosis of ACL tear, 95% of the subject’s knees presented with posttraumatic BML
in the lateral aspect of the tibial plateau with a mean volume 12.9 mL. Additionally,
77% of the subjects demonstrated the presence of BML on lateral aspect of femoral
condyle with a mean volume of 6.9 mL. At 2 years post-injury, there was a complete
resolution of BML for 54 of the knees in the lateral compartment of tibia and for 44 of
the knees in the lateral portion of the femur. During this time however, 21 knees
developed new lesions post-surgery over the lateral portion of the femur and the
tibia65.
The presence of BML is relevant because the size of bone marrow edema
pattern at baseline has been found to be significantly associated with increased
cartilage loss at year 1 (p=0.001), year 2 (p=0.008) and year 3 (p=0.039)
The Meniscus
The meniscus contributes to filling the joint space between the femur and the
tibia. This structure consists of a C-shaped medial meniscus and an O-shaped
lateral meniscus, each consisting of an anterior, central, and posterior horn. They
are split into 2 zones: with the larger inner zone comprised primarily of type II
collagen and being unvascularized, with the outer zone being smaller, vascularized,
and comprised of type I collagen74. The menisci serve two roles in relationship to a
healthy knee joint: they serve to provide stability to the tibiofemoral joint by
increasing surface congruity between the convex femur and the flat tibia and they
also serve to help distribute forces in the knee to help protect the articular cartilage.
The force distribution of the meniscus ranges between 44% and 78% of the vertical
compression load. Additionally, 61% to 81% of posterior shear force is attenuated by
the meniscus as the knee moves through flexion75.
Damage to the meniscus is often found in conjunction with an acute ACL
tear2. This happens due to the mechanism of injury that damaged the ACL ligament
and articular cartilage76-79. Damage to the meniscus, regardless if it occurs in the
medial or lateral portions; results in increased compression of the tibiofemoral joint
space, as well increase in the anterior/posterior shear forces experienced by the
knee joint78,79. After damage to the meniscus has been sustained, the likelihood of
damaging the hyaline cartilage rises to as high as 80% in the section of the knee
Presence of Inflammatory Mediators
Traditionally, knee osteoarthritis has been viewed as a mechanically driven
pathology82. After ACL injury, mechanical changes to the loads placed upon the
knee cartilage do not completely explain the variability in time from injury to
diagnosis of knee OA. Damage to the cruciate ligaments, joint capsule, and other
synovial tissue cause a metabolic cascade of inflammatory mediators. This has led
to research of looking at chemical biomarkers in an attempt to identify possible
factors that contribute to the increased damage of cartilage and incidence of OA72.
The cartilage building block of proteoglycans are structured with a protein
core with glycosaminoglycan (GAG) side chains. These have been found to be
sensitive to inflammatory cytokines which accelerate the degradation of PGs and
GAG’s in cartilage to a significant extent83,84. One particular inflammatory mediator
that has been shown to cause cartilage degradation is the presence of Intra-articular
Interleukin (IL)-185. This cytokine triggers the release of release of matrix
metalloproteinases (MMP)86. This collection of cytokines affect the cartilage in two
manners; primarily by breaking the GAG chains87, and secondarily by activating
procolleganase which functions to catabolize the cartilaginous matrix88.
Quadriceps Muscle Group and OA development Post-ACLR
In order to maintain a healthy joint, there needs to be a balance between the
internal and external forces that the joint experiences at any given point in the
balance by co-contracting with the hamstrings during closed kinetic chain tasks in
order to help promote joint congruency and stability90.
Quadriceps Strength Post-ACLR
While there has been some argument regarding the role of the of the
quadriceps in the initial noncontact ACL injury91, there is widespread recognition that
the strength of the quadriceps muscle is drastically reduced post-ACL injury and
subsequent surgery92. These deficits are present as soon as at 1 month
post-ACLR30. In the study previously mentioned, isometric quadriceps strength was
compared between injured and uninjured control groups at various time-points after
ACLR. In this study, the average torque produced by injured knees was 83 Nm,
while the corresponding limb in uninjured control subjects generated 210 Nm30. This
lack of strength is not isolated to being found shortly after injury, with deficits being
observed at 3-4 years or more post-surgery32,93.
Deficits in quadriceps strength have been found to be predictive of limitations
in self-reported function post-ACLR31. One study viewed the relationship between
quadriceps strength and different functional tests at 6 months post-surgery. The
authors found ACLR patients who reported low levels of knee function, measured by
having a mean IKDC (International Knee Documentation Committee) survey score of
74.7, also presented with a diminished quadriceps strength LSI of 0.80 between the
injured and healthy knees. This is a noted difference from those reported higher
While knee extensor strength has been recognized for its role in the function
of healthy knees, recent reviews of the literature found that there is no universal
standard for identifying when an athlete is cleared to return to play post-ACLR95,96. In
a review conducted by Lynch et al., the authors suggested that ACLR limbs need to
demonstrate quadriceps strength between 85% and 95% of the uninjured limb in
order to be termed a successful outcome. In more recent years, more functional and
quantifiable measures of quadriceps strength have been used to evaluate
quadriceps strength post-ACLR. In a study by Kuenze et al., 22 ACLR subjects at 31
months post-surgery were matched with 24 uninjured controls. The variable of
interest was the maximal voluntary isometric contraction (MVIC) of the quadriceps
muscle group normalized to body mass (Nm/Kg) as well as the quadriceps strength
limb symmetry index (LSI) (injured/uninjured). Those who had experienced ACLR
were found to have a MVIC of 2.46(Nm/kg) with an LSI of 0.85 between the injured
and uninjured knees, as opposed to a 2.72(Nm/kg) and LSI of 0.97 for the control
group. Using a receiver-operator characteristic (ROC) curve, a clinical threshold was
suggested to maximize patient reported outcomes of increased functionality and
decreased pain and limitation post-ACLR. The identified threshold was an MVIC of
3.0(Nm/kg) and a LSI strength index of 0.9497.
Quadriceps Strength Reduction and Biomechanics
The quadriceps muscle group is one of the largest and strongest muscle
groups in the leg98. This being the case, quadriceps strength is invaluable to healthy
the study previously mentioned99, quadriceps strength was significantly correlated
with the peak knee flexion angle during the first 50% of stance phase in walking gait.
Greater knee flexion angles place higher demand on quadriceps, noted by the
correlation between knee flexion angle and flexion moment (r=0.66)99.
Strength losses post-ACLR surgery have a net result of changing the
kinematics of the knee joint100. In the afore-mentioned study, subjects who were at
minimum 12 weeks post-ALR were divided into operationally “weak” and “strong”
groups dependent on the quadriceps LSI, 0.80 and 0.90 respectively. Subjects in the
“weak” group demonstrated showed diminished knee angle (20.99 degrees) at peak
flexion in walking gait when compared to uninjured controls (26.54). Subjects
classified as “strong” demonstrated no significant difference from uninjured
controls100. Decreased knee flexion angles result in decreased surface area of the
tibiofemoral cartilage which experience weight-bearing, resulting in higher loads
placed upon the weight-bearing cartilage101. Diminished quadriceps strength is also
associated with increased variance in knee angle24, resulting in changes of the
portions of the cartilage that experience the higher degrees of load23. These
changes in forces experienced by the knee contribute to the continued development
of knee OA post-ACLR34,35.
Quadriceps Strength and OA
Quadriceps strength deficits are a common development post-ACLR92 as well
as being found in conjunction with knee OA102,103. This results in questions regarding
in OA pathogenesis and development. Currently the literature is conflicting regarding
the presence and nature of this relationship. Previous studies viewing the
association between radiographic OA and quadriceps strength have found results
ranging from there being no relationship between the two104, no protective effect of
strength to incidence of OA- but there being a reported decrease in pain (p<0.002)
and increased function as strength improved (p<0.0001)105, to there being a
protective effect for increased quadriceps strength against patellofemoral cartilage
loss106, to increased strength protecting against the progression of tibiofemoral OA35.
This spectrum is due to the fact that many previous studies defined OA as being
able to be seen and captured by radiograph. In the review by Segal et al., it was
noted that while research which viewed the relationship between strength of the
quadriceps muscle group and radiographic changes to cartilage found no
association between the two; research which evaluated quadriceps strength in
conjunction with the developmental stages of OA found the inverse to be true34,
suggesting that quadriceps strength could be more impactful on cartilage health than
previous research would have suggested. In all cases, authors called for more
research using techniques more sensitive then radiography in order to better identify
the relationship and role of quadriceps strength and the early development of knee
OA21,34,107.
Imaging of Knee OA
Diagnosis of the entity of post-traumatic osteoarthritis can be very difficult due
to the lack of readily available and simple orthopedic testing aside from monitoring a
vital to identify the scope and severity of cartilage damage109. Due to the long-term
implications of being diagnosed with OA, the more rapid diagnosis and location of
degenerative changes in the hyaline cartilage allows for more rapid treatment and
improved strategies to maximize patient outcomes by preventing the development of
knee OA.
Radiography
Radiography is a classic staple for the development of knee OA due its ease
of use and cost-effective nature. It is important to note however, that when viewing
cartilaginous structures that radiography is limited. Due to a lack of ability to capture
cartilage directly, radiography relies on tracking cartilage health through indirect
measures- namely the presence and development of osteophytes and the narrowing
of the tibiofemoral joint space, using systems such as the Kellgren-Lawrence
Grading Scale110.
The presence of marginal osteophytes in the tibiofemoral joint space has
been demonstrated to be a measure used to identify knee OA. A meta-analysis
demonstrated that 20% of those who have sustained an ACL injury demonstrate
“moderate to severe” changes in the cartilage as measured by radiography as
opposed to 4.9% in the control group- representing a 4x increase in risk111 to the
cartilage post-ACL injury. The use of radiography however has been shown to be
not particularly sensitive to evaluating early changes in cartilage degeneration. In a
study by Kijowski et al., 125 patients with tibiofemoral OA were evaluated via
The sensitivity of measuring osteophytes and OA progression in the medial
compartment of the knee was 67% in identifying a true positive, and a specificity of
73% in identifying a true negative. The values of the lateral compartment were less
sensitive, 49%, however it was more specific, 81%. This study also reviewed the
sensitivity and specificity of measuring for the presence of joint space narrowing
(JSN) in the medial and lateral compartments of the tibiofemoral joint. While the
specificity, or true positive, of JSN was low for the medial (46%) and lateral (7%)
compartments, the specificity was very high for both compartments (95%) and
(100%) respectively. This means that by the time that JSN is found on radiography,
OA has already developed in the evaluated limb112.
It is important to note that in the time that there is sufficient change in
osteophyte formation and JSN to be indicative for knee OA, there has been a loss of
11%-13% in cartilage volume as measured by MRI113. As a result, more sensitive
means of imaging are needed to identify early changes to cartilage structure and
health than are offered via radiography.
Magnetic Resonance Imaging
The use of magnetic resonance imaging has been increasing in recent years
as related to knee OA identification and tracking due to its multiplanar imaging,
tissue contract, and lack of invasiveness. It is used clinically when attempting to
visualize tissue that is not readily visible on radiographs; such as the cruciate
ligaments, meniscus, and knee hyaline cartilage43. Clinical magnetic resonance
between tissues to be better able to identify defects in the cartilage38. It is important
to note that the use of MRI serves to provide a snapshot of the body segment of
interest at any given moment and serial images need to be taken to track changes
over time, particularly in the case of knee OA where changes can be
insidious9,43,65,114.
While tracking changes to the knee cartilage in OA, it is important to have a
grading system in order to classify and the levels of damage. One of the best has
shown to be the whole organ magnetic resonance imaging score (WORMS). A given
knee is classified by the thickness of the cartilage and its corresponding signal.
Healthy, undamaged cartilage is scored as a 0, signifying normal thickness and
signal. Early chondral defects of 1 signify normal cartilage thickness but with an
increased signal. The score of 2 identifies a partial thickness focal defect that is less
than 1 cm in width. A score of 3 signifies the presence of either multiple areas of
partial thickness defects mixed with areas of normal thickness or a grade 2 defect
wider than 1 cm but less than 75% of the region. For a knee to be scored as a 4,
there needs to be diffuse regional partial thickness loss that extends for more than
75% of the cartilage. To score a 5 identifies multiple areas of full thickness loss or a
grade 2.5 lesion wider than 1 cm but less then 75% of the region. Finally, scoring 6
signals the presence of full thickness loss of the cartilage. The normal WORMS
T1rho
Recent developments in imaging have brought about the creation of
quantitative MRI techniques39,40. These allow the clinician to quantifiably measure
components of the tissue of interest45. Regarding the study of OA, the technique of
T1rho has been found to be able to accurately measure proteoglycan density via
measuring the motion interaction between water and the local macromolecule
environment116,117. This provides the clinician the capability to identify the breakdown
of cartilage by measuring proteoglycan (PG) depletion in the cartilage38. PG
depletion is identified when the values for a particular region of interest are elevated
as the lack of PGs result in a decrease of free water and a resulting increase in
T1rho mean relaxation time118.
The use of T1rho to identify cartilage health post-ACLR has been shown to be
effective. T1rho imaging has able to identify PG health at injury baseline and
reductions of PG density as recently as 6 to 12 months post-ACLR46,119. This was
evidenced in a study completed by Theologis et al., in which 18 subjects had T1rho
imaging done in order to evaluate the health of the tibiofemoral cartilage at the 12
and 16 months post-ACLR. Each patients’ knee was divided sagittally into medial
and lateral portions, each of which was further divided into 8 different regions of
interest (ROI); 5 on the femur, 3 on the tibia. The results showed evidence of
changes to the T1rho relaxation times in the weight-bearing zone of the medial tibial
plateau and femoral condyle at 12-16 months post-ACLR, with no notable difference
in cartilage thickness between injured and healthy knees. The opposite was found to
profiles for the lateral femoral condyle and tibial plateau were significantly thinner.
Sub-compartment analysis of the medial tibia revealed the weight-bearing region
had greater T1rho and thinner cartilage compared to the uninjured knee. The medial
femoral cartilage’s most anterior compartment and weight-bearing regions
demonstrated greater T1rho relaxation times in the injured knee when compared to
the same region in the uninjured knee80.
The sensitivity of T1ro to identifying pre-osteoarthritic changes has been well
documented120. Research done by Gubta et al., found T1rho presented with
elevated values for the whole knee when compared with what was quantified as
normal cartilage via arthroscopy and traditional magnetic resonance imaging at time
of ACLR surgery. Statistically significant elevations were seen in the lateral tibia at
the superficial (p=0.03), deep (p=0.04), and full thickness (p=0.02) cartilage defects.
T1rho relaxation times were also seen to increase as severity of arthroscopic lesion
increased in the superficial and deep regions of the knee. This leads to the
conclusion being drawn that T1rho is more sensitive than arthroscopy when viewing
small cartilage lesions at time of ACLR121. The increase in lesions experienced by
the lateral compartment is not surprising when bearing in mind the shear and
rotational component that is experienced at the time of ACL injury and the resulting
apoptosis of chondrocytes9.
The use of T1rho has also been helpful in illustrating the damage to the
cartilage in relationship to the presence of bone marrow lesions (BML). In research
conducted by Bolbos et al., the knee joint of 16 patients with concurrent ACL tear
the subjects. The lesions experienced were distributed so 81% of patients had BML
present on the lateral tibia, 56% had BML present on the lateral femoral condyle,
and 44% had BML to both regions. After T1rho imaging, the results were that
cartilage values in the cartilage overlaying the BML was significantly increased over
the lateral tibia, (47.15ms ±12.96ms (p=0.002) when compared to the control of
uninjured cartilage122.
Abnormal tibiofemoral kinematics following ACLR have been associated with
increased cartilage degradation25,123. In the study by Haughom et al., 11 subjects
had MRI images acquired at 18 months post-ACLR surgery. T1rho relaxation times
were significantly increased in the general medial femoral cartilage with injured
knees having a mean T1rho relaxation time of 42.63.7ms and with healthy knees
demonstrating a mean relaxation time of 39.83.3ms and a p value of 0.04. This
difference was more pronounced when investigators looked specifically at the
weight-bearing portion of the medial femoral cartilage, with the cartilage-injured
knees demonstrating a mean T1rho relaxation time of 42.2±5.9ms, while healthy
knees presented with a mean T1rho relaxation time of 38.54.0ms, with the resulting
p being equal to 0.0125. In measuring anterior tibial translation(ATT), there was a
statistically significant increase in the T1rho relaxation times for those patients
categorized as having abnormal ATT, suggesting that there is a possible link
Chapter III
METHODS
Participants
All participants were between 18-35 years of age and were recruited to the
study within 14 days of sustaining an ACL injury. Recruitment occurred upon initial
presentation at an orthopedic clinic. Prior to inclusion into the study, an orthopedic
physician confirmed ACL rupture via clinical exam and anatomical MRI.
Measurements of the variables of interest were completed at 6 months post-ACLR.
We excluded females who were currently pregnant or planning on becoming
pregnant within the course of the study, patients who had a prior diagnosis of
inflammatory arthritis, surgery consisting of the reconstruction of multiple structures
within the injured knee, or those declining to undergo ACLR. Subjects who exhibited
the presence of a cardiac pacemaker, cochlear implant, clinical hypertension,
claustrophobia, hepatic diseases or seizures were also excluded.
Contact and scheduling of participants was completed via phone and email
correspondence by study personnel. Follow up visits were completed at the Sports
Medicine Research Lab (SMRL) on the campus of the University of North Carolina at
that was approved by the Institutional Review Board at the University of North
Carolina at Chapel Hill.
ACLR and Therapeutic Rehabilitation
All participants received a patellar tendon autograft performed by one of the
three orthopedic surgeons participating in the study. Following the completed ACLR
surgery, study participants were referred to either a licensed physical therapist or
athletic trainer for a supervised rehabilitation program. This program began during
the first week post-ACLR and was deemed complete when the patient was able to
return to activity.
Procedures
Quadriceps Strength Measurement
Isometric quadriceps strength was tested at 6 months post-ACLR using a
HUMAC Norm dynamometer (Computer Sports Medicine Inc., Stoughton, MA). The
variable of interest was quadriceps MVIC in both the ACLR limb and contralateral
limb. The order of limbs being tested was selected randomly (ACLR vs.
contralateral). The subject was seated in the HUMAC and positioned in 85 degrees
of hip flexion and 90 degrees of knee flexion31. The adjustable straps on the
dynamometer were then used to secure the pelvis and torso of the test subject. This,
coupled with the instruction for the subject to maintain the position of arms crossed
in front of the chest, helped isolate the generation of force to the quadriceps
through the middle of the tibiofemoral joint, the lever arm was secured to the leg at 3
cm above the ankle mortise.
Participants were acclimatized to the testing procedure through the use of a
progressive “warm-up” of isometric contractions31. The subjects were instructed to
“kick out” into the lever arm while attempting to reach a given percentage of their
perceived maximum effort124. Participants maintained each contraction for 2 seconds
at 25%, 50%, and 75% of maximal effort125. Following the warm-up, the participants
performed 3 to 5 maximal voluntary isometric contractions, spaced 60 seconds apart
until the peak torque in the limb being tested was within 10% of the previous trial in
two consecutive trials31. The torque produced during the three highest trials was
averaged and used to set a target torque threshold for test trials.
Two maximal effort tests were completed in which the torque met or
surpassed the torque threshold. The torque signal was sampled at 2000Hz and low
pass filtered at 50 Hz (zero-phase shift, fourth-order Butterworth)31. The maximum
torque produced in these two trials was normalized to body mass and averaged as
the variable of interest for quadriceps strength. The limb symmetry index (LSI) for
quadriceps strength was calculated by dividing the injured limb by the uninjured limb.
Magnetic Resonance Imaging of the Articular Cartilage
Magnetic Resonance Acquisition
T1rho MRI images were sampled using a Siemens Magnetom TIM Trio 3T
Munich, Germany). Participants arrived at our biomedical-imaging center 30 minutes
prior to the scan and remained seated to unload the knee cartilage prior to the scan.
The injured knee was scanned prior to the contralateral knee. For imaging, we used
a T1rho prepared three-dimensional Fast Low Angle Shot (FLASH) with a spin lock
power at 500 Hz, five different spin lock durations (40, 30, 20,10, 0 ms) and a voxel
size of 0.8 mm x 0.4 mm x 3 mm (field of view =288 mm, slice thickness = 3.0 mm,
TR = 9.2 ms, 160 × 320 matrix, gap = 0 mm, flip angle = 10 degrees, echo train
duration time = 443 ms, phase encode direction of anterior/posterior).
Articular Cartilage Segmentation
A single investigator manually segmented the tibiofemoral articular cartilage
on the 0ms spin lock duration T1rho image using the ITK Snap software. A
musculoskeletal radiologist confirmed anatomical accuracy of segmentations. The
weight-bearing regions of medial and lateral femoral condyles and medial and lateral
tibial plateaus were each identified and sub-sectioned into 3 regions of interest (ROI)
based on the representation of the meniscus in the sagittal plane.
The femoral condyles were segmented anterior to posterior by identifying the
weight-bearing portions of the cartilage via their contact and positioning relative to
the meniscus. The first ROI (MFC 1/LFC 1) comprised of the portion of the cartilage
superior to the region demarcated by the borders of the anterior horn of the
meniscus. The second ROI (MFC 2/LFC 2) comprised of the cartilage superior to the
meniscus. The third ROI (MFC 3/LFC 3) comprised the cartilage superior to the
posterior horn of the meniscus80.
The tibial plateaus were segmented anterior to posterior by identifying the
cartilage in relationship to the position of the meniscus. The first region of interest
(MTC 1/LTC 1) comprised of the portion of the cartilage inferior to the region
demarcated by the anterior horn of the meniscus. The second region of interest
(MTC 2/LTC 2) comprised of the cartilage inferior to the zone between the anterior
horn of the meniscus and the posterior horn of the meniscus. The third region of
interest (MFC 3/LFC3) comprised the cartilage inferior posterior horn of the
meniscus80.
T1rho Relaxation Time Quantification
Voxel by voxel T1rho relaxation times were calculated from a five-image
sequence created with a MatLab program (MatLab R2014b [8.4.0] MathWorks,
Natick, MA, USA) using the following equation: S(TSL) = S0 exp(-TSL/T1rho). In this
equation S corresponds to signal, TSL is the length of the spin-lock time, S0 is signal
intensity when TSL equals zero, and T1rho is the T1 relaxation time in the rotating
frame. The segmented T1-weighted MRI image was overlaid onto the calculated
T1rho image to determine T1rho relaxation times for the above ROIs. Mean T1rho
relaxation times were extracted for each ROI and used for analyses. Greater T1rho
relaxation times were interpreted as being associated with lesser proteoglycan
Based on previous studies which looked at the strength of the association
between isometric measures of quadriceps strength and quantitative MRI (T2
mapping), we estimated that there would be moderate correlations between mean
T1rho relaxation times and isometric quadriceps strength126. We determined that at
=0.05, with a power analysis of 1-=0.8, to find a moderate correlation of 0.45, 29
subjects would be needed in order to determine statistical significance.
Statistics
Statistical analyses were completed using SPSS Statistical Software (SPSS,
Version 23.0, IBM Corp., Somers, NY).
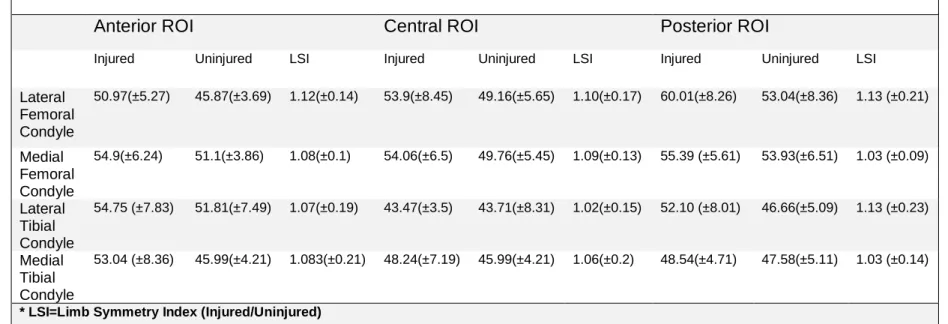
The mean T1rho relaxation times and measure of cartilage volume were
generated for the 6 weight-bearing regions of interest of the tibiofemoral cartilage in
each subject’s injured and uninjured knees using the ITK-Snap software127. After
having gathered the mean relaxation times for each compartment, a LSI was then
calculated (injured/uninjured) to evaluate the symmetry between the injured and
uninjured knees in each respective region of interest (Table 6). An LSI was not
calculated for cartilage volume.
To establish reliability of imaging segmentations, inter- and intra-rater
reliability was calculated using intra-class correlation coefficients (ICC). Levels of
reliability were previously established, with (ICC 2,1 <0.49) demonstrating a low level
of agreement, (ICC 2,1=0.5-0.75) demonstrating moderate agreement, and (ICC 2,1 >
0.76) being a high level of agreement. Inter-rater reliability was completed by
re-segmenting a subset of 10 randomly selected knees previously segmented by a
scores and segmentations of the previously segmented knees (Table 2). Intra-rater
reliability was completed by re-segmenting a subset 10 randomly segmented knee
that had been segmented more than 6 months previously by the same investigator
(Table 3). Standard error of the measurement(SEM) was calculated for both the
inter- and intra-rater reliability measures to establish the precision of the
measurements. SEM was calculated as 𝑆𝐷√1 − 𝐼𝐶𝐶.
Intra-rater reliability was also assessed for the cartilage volume of each ROI
(Table 3). Cartilage volume was used to determine if there were differences in the
volume of each ROI between the injured and uninjured limb.
To identify differences between injured and uninjured knees at 6 months
post-ACLR separate paired t-tests were used to compare the mean T1rho relaxation
time and cartilage volume for each sub region of cartilage (MFC 1/LFC 1, MFC
2/LFC 2, MFC 3/LFC 3, MTC 1/LTC 1, MTC 2/LTC 2, MTC 3/LTC 3) between limbs.
The statistical significance was set a priori at =0.05 for all comparisons.
Our second aim was to identify the presence of an association between
quadriceps strength and mean T1rho relaxation times. When assessing for normality
using Shapiro Wilks (p<0.05), the data for some of the ROIs were non-normally
distributed (LFC 1 injured, LTC 3 injured, LTC 2 injured, MTC 1 injured, LFC 1
uninjured, LTC 3 uninjured, LTC 2 uninjured, LTC 1 uninjured, MFC 2 uninjured).
Pearson Product Moment correlations were used to determine the association
between quadriceps strength and T1rho LSI when the data was normally distributed.
Spearman’s Rank Order coefficient was calculated when data was non-normally
injured limb and the T1rho LSI of the following ROIs: (MFC 1/LFC 1, MFC 2/LFC 2,
MFC 3/LFC 3, MTC 1/LTC 1, MTC 2/LTC 2, MTC 3/LTC 3), 2) quadriceps strength
LSI and the T1rho LSI of the ROIs listed above. For post hoc analysis, partial
correlations were used to evaluate the effect of patient-reported pain during activity,
measured by the KOOS pain subscale128 at 6 months post injury, on significant
associations between quadriceps strength and T1rho values.
Results
Thirty subjects participated in the study. Two subjects were unable to
complete strength testing for the injured knee at 6 months post-ACLR due to pain
and were excluded from statistical analysis. Four additional subjects were excluded
due to a history of ACL injury prior to the injury which qualified them for the study.
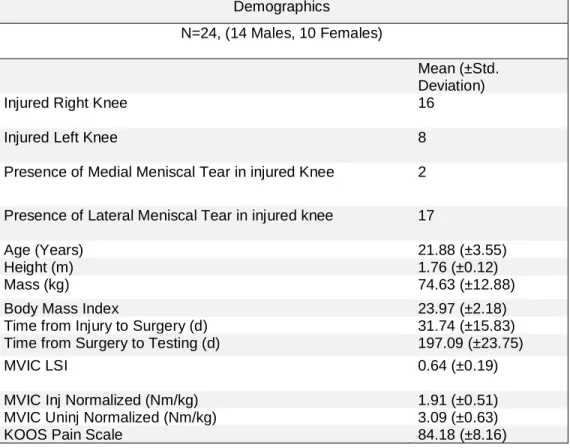
Bilateral T1rho MRI and strength outcomes were collected for the remaining 24
subjects, and their demographics are presented in Table 1.
T1rho Segmentation
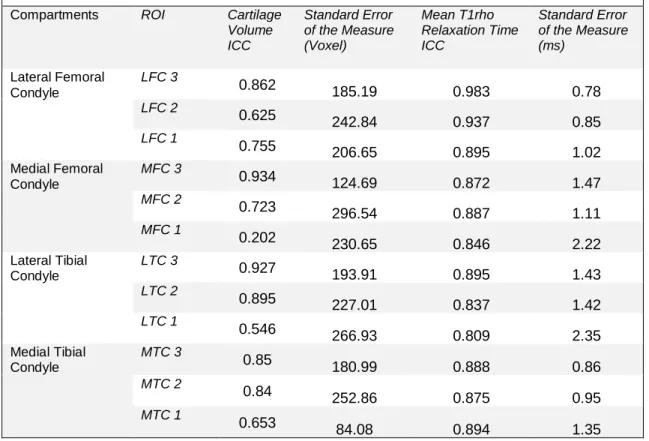
Inter-Rater Reliability
There was a high level of inter-rater absolute agreement (ICC 2,1 ≥ 0.80 for all
ROI) between the novice and trained investigator for the T1rho mean relaxation
times for each ROI. Additionally, there was high inter-rater consistency (ICC 2,1 ≥
0.84) for all ROI. Inter-rater reliability for cartilage volume demonstrated a range of
agreement and consistency (ICC 2,1 ≥ 0.60), with one region of interest (MFC 1)
showing a low level of agreement for both absolute agreement (ICC 2,1 = 0.202) and
consistency (ICC 2,1 = 0.210) (Table 2).
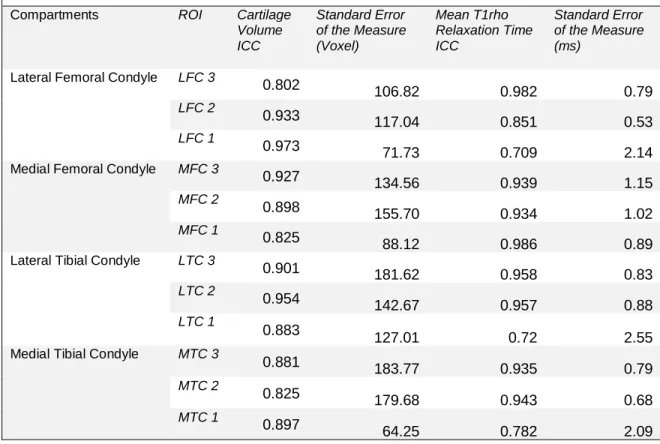
Intra-Rater Reliability
The intra-rater reliability for T1rho relaxation times was high (ICC 2,1 ≥ 0.70)
for absolute agreement, as well as for consistency (ICC 2,1 ≥ 0.70). Intra-rater
reliability of the cartilage volume measure was also evaluated (Table 5, Intra-rater
reliability of cartilage volume). High reliability was found in both the absolute
agreement (ICC 2,1 ≥ 0.82) and the consistency measures (ICC 2,1 ≥ 0.84) (Table 3).
Differences in T1rho Relaxation Times
Significantly greater T1rho relaxation times were found in the ACLR limb
compared to the contralateral limb for the region of LFC 3 (t23=2.866, p=0.009), LFC
2 (t23=2.793, p=0.01), LFC 1 (t23=4.358, p<0.001), LTC 3 (t23=2.513, p=0.019), MFC
2 (t23=3.157, p=0.004), and MFC 3 (t23=2.866, p=0.001) (Table 5).
Cartilage Volume
A statistically significant increase in cartilage volume between the injured and
uninjured limbs was found in MTC 3 (t23=-2.428, p=0.022). No other significant
Quadriceps Strength and T1rho Values
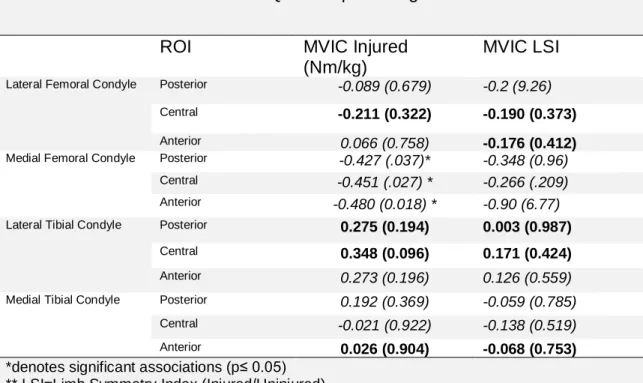
A statistically significant negative association was found between the MVIC of
the injured limb with T1rho values for MFC 3 (=-0.40, p=0.049; Figure 3), MFC 2
(r=-0.45, p=0.027; Figure 2), and MFC 1 (=-0.46, p=0.022; Figure 1). No
statistically significant associations were found between injured limb quadriceps
strength for the ROI in the lateral femoral condyle or the tibia. Additionally, there
were no statistically significant associations between the quadriceps strength LSI
and the mean t1rho relaxation times in any of the femoral or tibial ROI.
Post Hoc Analysis
In post-hoc analysis, we controlled for the KOOS pain scale at 6-months
following ACLR for the significant associations previously found between MVIC of
the injured limb and the T1rho LSI. At time of analysis, only 18 subjects had
completed the KOOS survey. As a result, we conducted the partial correlations using
the available 18 subjects as a subset. We found that after accounting for pain the
associations between MVIC and T1rho LSI for MFC 3 (r15= -0.33, p=0.2), MFC 2
(r15= -0.32, p=0.21), MFC 1 (r15= -0.26, p=0.32) were not statistically significant.
Discussion
The most important finding of the current study was the significant negative
association between injured knee quadriceps strength and T1rho LSI for the weight
bearing regions of the medial femoral condyle at 6 months post-reconstruction. The
demonstrated greater T1rho relaxation times in the injured knee compared to the
contralateral knee. There were significantly greater T1rho relaxation times in the
injured knee compared to the contralateral knee in 50% of the weight bearing ROIs,
particularly in the femoral condyles. This supports our hypothesis that ACLR limbs
would demonstrate a higher mean T1rho relaxation time than the contralateral limb.
This indicates that there are compositional changes occurring in the cartilage in the
injured limb as early as 6 months post-ACLR. This early change in cartilage
composition, and evident association with quadriceps strength, illustrates the impact
of muscle strength on the compositional health of cartilage and its role in
post-traumatic knee osteoarthritis.
T1rho Relaxation Times
Greater T1rho relaxation times were noted in the ACLR limb in the regions of
MFC 1, MFC 2, LFC 1, and LFC 2, while the remaining regions in the femur and tibia
in the injured limb did not display as high of relaxation times. The greater T1rho
relaxation times in the injured knees are similar to previous studies that
demonstrated greater relaxation times in the medial compartment of the femur
post-ACLR compared with contralateral control subjects118 or the contralateral limb46,80. In
a study by Osaki et al., those who underwent ACLR exhibited significantly greater
T1rho relaxation times in the anterior and middle weight-bearing compartments of
the medial femoral condyle at 2 years post-ACLR when compared with contralateral
controls118. Theologis et al. identified a significantly greater relaxation time in the
compared to the contralateral knee80. The present study contributes to the current
literature by noting these same elevated levels in T1rho relaxation times, but at the
much earlier time point of 6 months, indicating that compositional changes to
cartilage can occur much sooner than previously identified.
It is relevant that the increase in T1rho relaxation times was found when there
was little difference in cartilage volume between injured and uninjured knees, with a
difference in cartilage volume only being noted in MTC 3. This suggests
compositional change can occur with little to no change in the cartilage volume. This
concurs with the understanding that changes in the proteoglycan density can begin
as early as 6 months after ACLR, which has been noted in the recent
literature62,129,130 and without visible changes to cartilage volume131. This is relevant
to the understanding of the etiology of post-traumatic OA, since changes in cartilage
composition may not be easily addressed by traditional rehabilitation techniques.
Therefore, early identification of individuals at risk for developing OA could
contribute to the implementation of strategies to mitigate OA development.
It is important to note that there are likely a variety of factors that result in an
uneven distribution of stresses and loads on the cartilage, explaining the varied
change in T1rho relaxation times. One of these proposed factors is the presence of
damage to the cartilage sustained at initial injury132. As a result of the traumatic
nature of an ACL rupture, some damage to the cartilage has been found in almost all
ACL injuries when initially evaluated9. Due to the cross-sectional nature of the
current study at 6 months post-injury, the role of initial damage to cartilage on mean
usage of serial MRI sessions, evaluating the cartilage at multiple time points and
evaluating the changes in T1rho relaxation times over time.
Another mechanism for greater T1rho relaxation times is the occurrence of a
meniscal tear133. The presence of meniscal injury results in an increased amount of
compressive and shear force experienced by the underlying cartilage because of the
loss of structural integrity in the meniscus134. The presence of meniscal tear is
associated with a greater T1rho relaxation time for both the tibial and femoral
cartilage 135. While the presence of a meniscus tear was not a formal part of the
investigation and analysis, we observed that the majority of the 24 subjects
presented with some form of meniscal tear. Of the 24 subjects, there were 17 lateral
meniscus and 2 medial meniscus tears present.
The role of functional biomechanics has been proposed as a mechanism for
the development of knee OA post-ACLR8. Alterations in joint kinetics would bring
about changes in loading experienced by knee cartilage136 and therefore influence
proteoglycan density and T1rho relaxation times. Van Rossom et al., found that
T1rho relaxation times were significantly correlated with the type of tibiofemoral
contact forces experienced by the knee137. In this study, the walking gait kinematics
and T1rho relaxation times were evaluated in 15 healthy subjects. The researchers
found that greater T1rho relaxation times were associated with the presence of
anterior-posterior shear loading in the regions of both the medial (r=0.69, p=0.008)
and lateral condyle (r=0.7, p=0.007) of the femur. Analysis of the association of
compressive loading of the femoral condyles found a negative association for the
in the region of the medial femoral condyle137. Zaid et al. found that that those who
had experienced ACLR demonstrated a more anterior tibial position compared to the
contralateral control limb during weight-bearing MRI The anterior tibial position
post-ACLR was found to be associated with greater T1rho relaxation time in the medial
femoral compartment of the injured knee at 1 year post-reconstruction (ρ=0.66,
p=0.01)138, demonstrating the relationship between kinematics and relaxation times
in injured subjects.
In summary, the proteoglycan content of cartilage is integral to its structural
integrity. Alterations to joint kinematics post ACLR139-142 expose the cartilage to
altered wear patterns and contribute to its breakdown, exhibited by elevated T1rho
relaxation times as the proteoglycan content is depleted.
Quadriceps Strength Post-ACLR
It is well documented in the current literature that there are decreases in
quadriceps strength post-ACL injury immediately post-injury143, at return to
activity144, and even as long as 20 years post-injury{Tengman, 2014 #689}
compared to healthy controls. In the current study, the injured limb was found to
produce just 62% of the torque generated by the contralateral limb at 6 months
post-ACLR (injured=1.91nm/kg, contralateral=3.09nm/kg). The importance of regaining
muscular strength post-ACL injury is readily recognized as an important part of a
successful outcome96. In the clinical setting, in order for the patient to return to
pre-injury activity, he or she is required to achieve at minimum an 80% symmetry
more than 3.00Nm/Kg in knee extension 97 as part of a battery of tests144. The
presence of a significant deficiency in injured knee quadriceps strength illustrated by
a weak (MVICinj=1.91Nm/Kg) and a decreased MVIC LSI (0.64) in the current study
raises serious concerns, due to the importance of the quadriceps muscle group not
only in functional and patient-reported outcomes post-ACLR but also for its role in
maintaining healthy knee function.
Quadriceps Strength Post-ACLR and Knee Function
Quadriceps strength post-ACLR has been associated with patient reported
outcomes for knee health and function31,146,147. Pietrosimone et al. found that
isometric quadriceps strength normalized to body weight displayed great accuracy
(AUC=0.76; 95%, CI 0.6-0.86) for identifying a subject’s high self-reported function
as reported by the IKDC survey, and that subjects who demonstrated a quadriceps
torque normalized to body weight of > 3.10 Nm/kg were 6 times more likely to report
a high level of knee function as compared to those with lower levels of quadriceps
strength31.
Deficiencies in strength post-ACLR result in changing the kinetics of the knee
joint100,148, thus understanding the role of a weaker quadriceps group in relationship
to knee joint function is critical. Weakness in the quadriceps muscle group results in
asymmetries in knee movement during drop landing tasks149 and during walking gait
24,100. Schmidtt et al. found that 8 months from ACLR, those who were classified as
“low strength” (isometric quadriceps LSI <85%) demonstrated greater asymmetries