T
HREEE
SSAYS INA
PPLIEDM
ICROECONOMICSChunxiao Li
A dissertation submitted to the faculty of the University of North Carolina at Chapel Hill in par-tial fulfillment of the requirements for the degree of Doctor of Philosophy in the Department of
Economics.
Chapel Hill 2017
Approved by:
Donna Gilleskie
Jane Fruehwirth
Valentin Verdier
David Guilkey
Helen Tauchen
c
2017
Chunxiao Li
ABSTRACT
CHUNXIAO LI: Three Essays in Applied Microeconomics. (Under the direction of Donna Gilleskie)
This dissertation is comprised of three independent chapters. The first chapter studies the ef-fectiveness and consequences of exclusionary school discipline. Exclusionary school discipline techniques, such as out-of-school suspension, are often criticized for their inability to improve students’ behavior, their adverse effects on students’ achievement outcomes and their dispropor-tionate use on minority students. Using large-scale administrative data on North Carolina public school students, I find that harsher disciplinary rules (measured by higher out-of-school suspension likelihood) significantly deter students from committing first offenses, but that they are less effec-tive (or ineffeceffec-tive) for repeat offenses. I also find that their adverse effects on offending students’ achievement outcomes, such as end-of-grade test scores and high school dropout probability, are much smaller than the effects documented in the existing literature. In addition, I find that harsher disciplinary rules could significantly improve the academic achievement of middle school students with no offense record. To carefully address endogeneity and selection issues in a large-scale data context, my preferred identification strategy combines the instrumental variable method and a machine learning cluster method (k-means). These findings suggest that current policy reform of exclusionary school discipline should carefully balance its benefits and costs for different student populations.
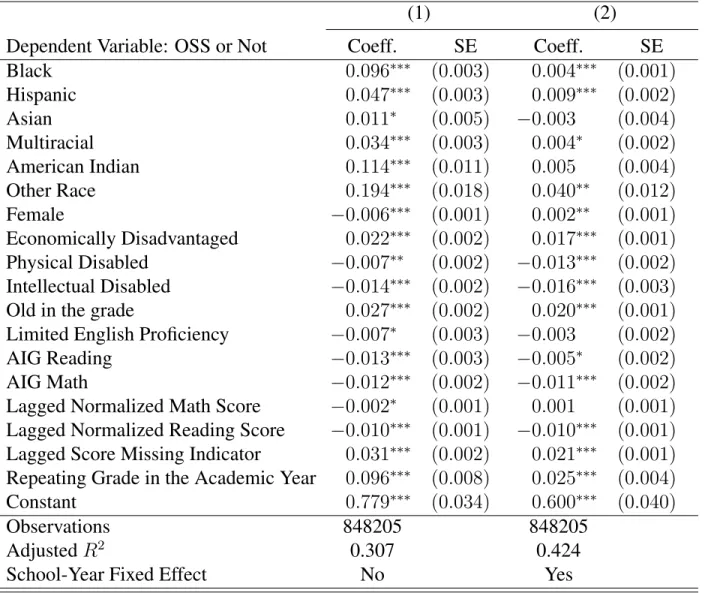
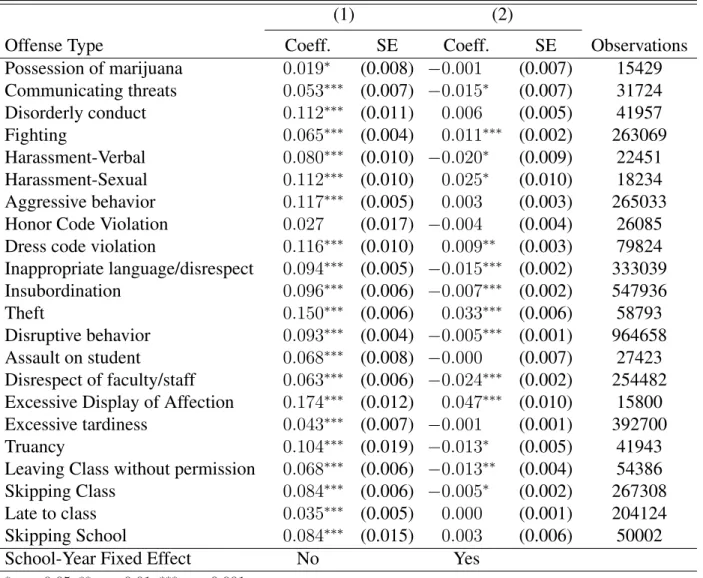
of offenses when black and white students are compared within the same school. While black stu-dents are more likely to be suspended, for example, for fighting, theft and sexual harassment, white students are more likely to be suspended for insubordination, disrespect toward faculty, or leaving class without permission. I also find that Economically Disadvantaged students are consistently more likely to be suspended out-of-school for different types of offenses, even if the comparison is within schools.
ACKNOWLEDGMENTS
TABLE OF CONTENTS
LIST OF TABLES . . . ix
LIST OF FIGURES . . . xii
1 The Effectiveness and Consequences of Exclusionary School Discipline . . . 1
1.1 Introduction . . . 1
1.2 Data Description . . . 7
1.2.1 Data Sources . . . 7
1.2.2 Sample Construction . . . 9
1.2.3 Descriptive Statistics and Data Issues . . . 11
1.3 Empirical Framework . . . 14
1.3.1 The Model for Students’ Behavior . . . 15
1.3.2 Administrators’ Punishments and Identification Strategies . . . 19
1.3.3 Students’ Achievement Outcomes . . . 24
1.3.4 Discussion . . . 28
1.4 Estimation Details . . . 31
1.4.1 Instrument Construction and Validity . . . 31
1.4.2 Disciplinary Punishment Index Construction . . . 35
1.4.3 Student Unobserved Heterogeneity . . . 37
1.5 Results . . . 39
1.5.1 Results for Deterrence Effects . . . 39
1.6 Conclusions . . . 50
2 The Equity of Exclusionary School Discipline . . . 66
2.1 Introduction . . . 66
2.2 Data Description . . . 69
2.3 Estimation and Results . . . 70
2.4 Conclusion . . . 75
3 The Influence of Endogenous Behaviors among Social Pairs: Social Interaction Ef-fects of Smoking (with Donna Gilleskie) . . . 88
3.1 Introduction . . . 88
3.2 Basic Empirical Model . . . 91
3.2.1 Basic Setup . . . 91
3.2.2 Model Specification . . . 94
3.2.3 Smoking Outcomes for Relationship Pairs . . . 96
3.2.4 Health Transitions and Mortality . . . 97
3.2.5 Initial Conditions . . . 98
3.2.6 Additional Considerations for Estimation . . . 100
3.3 Data and Construction of Variables . . . 103
3.3.1 Framingham Heart Study . . . 103
3.3.2 Construction of Key Variables . . . 105
3.3.3 Replication of Previous Findings . . . 106
3.4 Results and Discussion . . . 111
3.4.1 Effects of Own Observed Behavior and Characteristics . . . 111
3.4.2 Effects of Social Contact’s Observed Behavior . . . 112
3.4.3 Effects of Social Contact’s Observed Characteristics . . . 118
B Appendix for Chapter 2 . . . 130
C Appendix for Chapter 3 . . . 131
LIST OF TABLES
1.1 Summary Statistics for Selected Categories of Offenses . . . 52
1.2 Sample Means of Student Characteristics . . . 53
1.3 Instrumental Variable and Time Varying School Observed Variables . . . 54
1.4 Monotonicity of the Instrumental Variable . . . 55
1.5 General Deterrence Effects for First Offense by Offense Category . . . 56
1.6 General Deterrence Effects for First Offense by Offense Type . . . 57
1.7 General Deterrence Effects for First Offense by Student Characteristics . . . 58
1.8 General and Specific Deterrence Effects for Second Offense . . . 59
1.9 General Deterrence Effects for Second Offense by OSS Experience . . . 60
1.10 Effects of Suspension Experience on Offending Students’ Achievement Outcomes . 61 1.11 Effects of Suspension Experience on Achievement by Race . . . 62
1.12 Effects of Discipline on Achievement of Well-Behaved Students and All Students . 63 1.13 Overall Effects of Discipline on Achievement by Race . . . 64
2.1 Sample Means of Offending Students’ Characteristics . . . 77
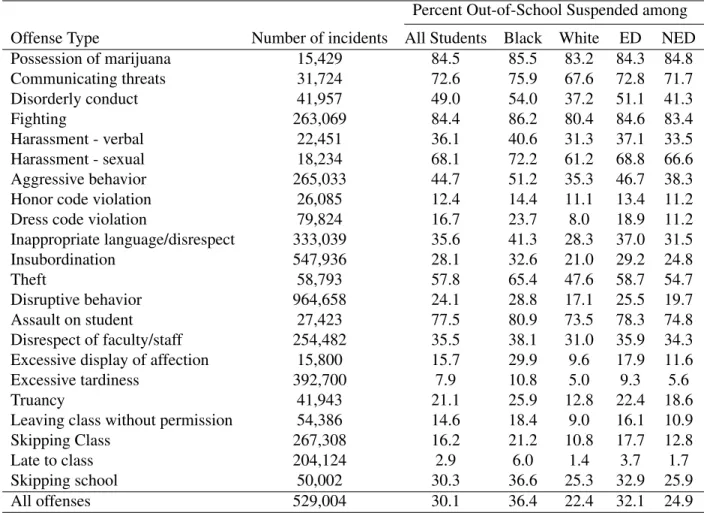
2.2 Percentages of Out-of-School Suspension for Selected Offense Types . . . 78
2.3 Estimation Results: Out-of-school Suspension for All Offenses . . . 79
2.4 Estimation Results: Out-of-school Suspension for First Offense . . . 80
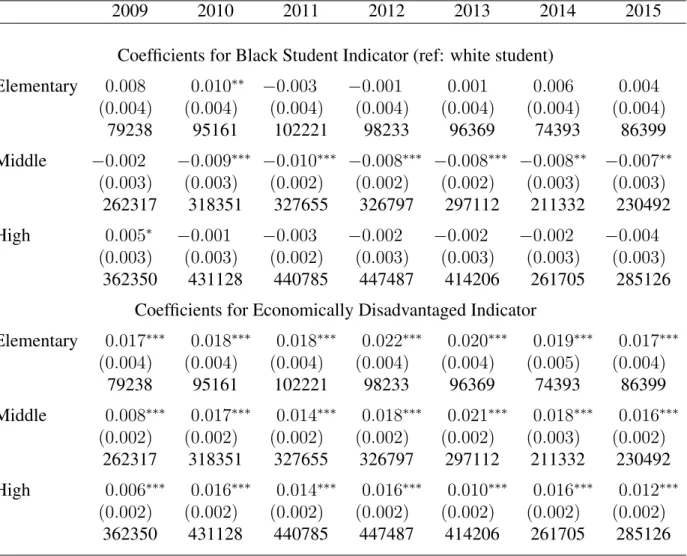
2.5 Estimation Results: Out-of-School Suspension by School Level and Year . . . 81
2.6 Estimation Results: Black White Differences in OOS by Offense Type . . . 82
2.7 Estimation Results: Economically Disadvantaged Students’ Differences in OSS by Offense Type . . . 83
2.8 Estimation Results: Black White Differences in OOS by Students’ Gender . . . 84
2.10 Estimation Results: Black White and ED Differences in OOS by Principal’s Race . 86
2.11 Estimation Results: Black White and ED Differences in OOS by Assistant
Princi-pal’s Race . . . 87
3.1 Summary Statistics for Individual-Exam Observations . . . 107
3.2 Percentage Change in the Likelihood of Ego Smoking when Alter Smokes versus does not Smoke for Different Social Pairs . . . 110
3.3 Estimation Results: Smoking and Health Probabilities for Spouse Pairs . . . 113
3.4 Marginal Effects: Alter’s Smoking Behavior on Ego’s Smoking Behavior for All Social Pairs . . . 115
3.5 Estimation Results: Alter’s Characteristics on Ego’s Smoking Behavior for All Social Pairs . . . 118
A1 Offense Categories and Types . . . 119
A2 General and Specific Deterrence Effects for Second Offense . . . 121
A3 General Deterrence Effects for Second Offense by OSS Experience . . . 122
A4 First Stage Results for 2SLS&GFE Specification in Table 1.5 . . . 123
A5 First Stage Results for 2SLS&GFE Specification in Table 1.8 . . . 123
A6 First Stage Results for 2SLS&GFE Specifications in Table 1.10 . . . 124
A7 First Stage Results for 2SLS&GFE Specification in Table 1.11 . . . 124
A8 Comparison of Sample Means of Student Characteristics for Each Sample in Table 1.8 . . . 125
A9 Other Estimation Results for Specification “All Offenses” in Table 1.5 (Part 1:βˆ12, ˆ β13,βˆ10) . . . 126
A10 Other Estimation Results for Specification “All Offenses” in Table 1.5 (Part 2:βˆ11, ˆ β15) . . . 127
A11 Other Estimation Results for Specification “All Offenses” in Table 1.5 (Part 3: βˆ14) 128 A12 Selected Estimation Results (βˆ33,βˆ32,βˆ30) for Specification “OLS&GFE” for Equa-tion 1.7 . . . 129
B2 Estimation Results: Black White Differences in OOS by Offense Type . . . 130
C1 Estimation Results: Smoking and Health Probabilities for Friend Pairs . . . 133
C2 Estimation Results: Smoking and Health Probabilities for Sibling Pairs . . . 134
C3 Estimation Results: Smoking and Health Probabilities for Parent-Child Pairs . . . 135
C4 Additional Estimation Results: Initial Conditions and Attrition for Spouse Pairs . . 136
C5 Additional Estimation Results: Initial Conditions and Attrition for Friend Pairs . . 137
C6 Additional Estimation Results: Initial Conditions and Attrition for Sibling Pairs . . 138
C7 Additional Estimation Results: Initial Conditions and Attrition for Parent-Child Pairs . . . 139
LIST OF FIGURES
1.1 Estimated Student Group and Offense Numbers . . . 65
3.1 Equilibrium Pattern for Error Space . . . 101
CHAPTER 1
THE EFFECTIVENESS AND CONSEQUENCES OF EXCLUSIONARY SCHOOL DISCIPLINE
1.1 Introduction
In U.S. public schools, exclusionary school discipline techniques, such as out-of-school sus-pension or expulsion, are commonly used methods to address student misbehaviors – ranging from severe misconduct (e.g., assaults at school) to minor offenses (e.g., disruptive behavior in the class-room). In the 2013-2014 school year alone, 2.8 million of the 50 million public school students were suspended out-of-school at least once, and 130,000 students were expelled.1 The high rate of out-of-school suspension reflects the consequences of policies such as “zero tolerance,” which emphasize tough punishment, including social exclusion, as a primary response to crime or mis-conduct (Skiba and Knesting 2001; Losen and Skiba 2010). However, this disciplinary practice is widely criticized for its inability to improve students’ misbehavior and its adverse consequences for suspended students and the broader school community.
Some existing literature suggests that suspension does little to discourage misbehavior and may, in fact, encourage it (Wettach, Owen, and Hoffman 2015; Skiba and Rauch 2015). The literature also finds that suspension lowers academic achievement and raises school dropout rates of offend-ing students (Raffaele Mendez 2003; Arcia 2006; Lee, Cornell, Gregory, and Fan 2011; Skiba and Rauch 2015). Students who are suspended or expelled from school are more likely to be involved in the justice system; this relationship is often referred to as the “school to prison pipeline” (Wald and Losen 2003). A recent study shows that high rates of school suspensions actually harm math and reading scores for non-suspended students (Perry and Morris 2014). Concerns about these ad-verse effects are amplified by findings of disparities in school disciplinary practices, especially the
disproportionate representation of students of color in school suspension rolls. In the 2013-2014 academic year, while black students represented 15.5 percent of the public school student popu-lation, they comprised 39 percent of student out-of-school suspensions.2 This disparity suggests that the disciplinary practice is particularly harmful to minority groups. Morris and Perry (2016) document that school suspensions produce a racial achievement gap, which accounts for approxi-mately one-fifth of black-white differences in school performance.3 These findings have motivated the U.S. Department of Justice and Education to release a school discipline guidance package in 2014 to reform discipline policies and practices, several states to enact new legislation, and many schools to consider ongoing school discipline policy reform.4
Despite concern expressed in the literature and in the popular press, the effectiveness and conse-quences of exclusionary school discipline techniques remain controversial. Several issues inherent in identifying “causal effects” in this context, such as endogeneity and selection issues, have not been fully addressed in the literature, which mostly uses descriptive statistics or regressions with limited sets of observables. For example, the negative correlation between out-of-school suspen-sion and suspended students’ achievement may reflect the following causal relationships. First, principals may be more likely to suspend less-engaged students or students who commit more se-rious offenses (even for the same observed type of offense). The lower achievement outcomes of suspended students may not be explained by the consequences of suspension but just simply re-flect that these students are “bad apples.”5 Second, students who choose to commit offenses under the threat of suspension may have different personality traits, such as lacking self-control, com-pared to students who commit offenses under no threat of suspension (the “selection on students’
2Civil Rights Data Collection, 2016, U.S. Department of Education Office for Civil Rights.
3Black-white academic achievement gap is of great importance for understanding black-white gaps in economic
outcomes. For example, Neal and Johnson (1996) document that a test score (AFQT) explains nearly three-quarters of the racial wage gap for young men and all of the gap for young women.
4See the following websites for the guidance package: http://www.ojjdp.gov/enews/14juvjust/140109.html;
http://www2.ed.gov/policy/gen/guid/school-discipline/index.html. There is new related legislation in several states; for example, California (AB 420, 2014) and Illinois (SB 100, 2015).
unobservables”).6 Therefore, the lower achievement outcomes of suspended offending students may be due to the lack of self-control but not the suspension itself. These issues cannot be fully addressed using regressions with limited sets of observables because the engagement levels of stu-dents, the severity of offenses and the personality traits are typically not observed by researchers.7 Furthermore, they cannot be fully addressed with student- or school-level fixed effects (or simi-lar methodologies) because some of the unobservables, such as the severity of offenses or other life-changing circumstances of students, are time-varying factors.8
While attempting to carefully address the identification issues, this essay studies the causal effects of exclusionary school discipline on students’ in-school behaviors and achievement out-comes, such as end-of-grade test scores, dropout probability and ACT scores.9 With regard to students’ in-school behaviors, I separately identify a “general deterrence effect” and a “specific deterrence effect” of the discipline. As punishments, these discipline techniques may serve as threats to students who intend to commit offenses and deter them from infractions. I refer to this mechanism as “general deterrence effect” following the economics of crime literature.10 In addi-tion, the experience of a specific punishment may serve as an effective “wake-up call” and decrease students’ likelihood of re-offending in the future. I refer to this mechanism as a “specific deterrence
6Heckman, Stixrud, and Urzua (2006) discuss how personality traits affect risky behaviors of children.
7Even if we observe the type of offense (e.g., fighting), we typically do not observe additional details about the
offense (e.g., severity).
8A fixed effect approach uses differences in punishment across the same type of offenses for the same student or
in the same school to identify the effect. However, the fact that the same type of offenses may be punished differently for the same student or in the same school over time is likely to reflect that some unknown sources that determine the punishment have changed, such as the severity of offenses. There are also other limitations for applying the fixed effect approach in this context. For example, the student fixed effect is not applicable when the student’s outcome, such as ACT score, is not observed repeatedly.
9Specifically, I focus on the effects of out-of-school suspension (including expulsion) in this essay because it is the
major controversy in policy making.
10The standard economic model of criminal behavior with the discussion of deterrence is introduced by Becker
effect.”11
I also examine the impact of exclusionary school discipline on students’ achievement out-comes. When a principal faces a decision to out-of-school suspend an offending student or not, an important effect under consideration is whether the suspension will lead to worse (or better) achievement outcomes for the offending student.12 Furthermore, since one reason for suspending offending students is to benefit “well-behaved” students, an important question is whether harsher disciplinary rules (i.e., with higher probability of out-of-school suspension) can benefit achieve-ment outcomes of those “well-behaved” students. In addition, for principals to make disciplinary rules or decisions and governments to decide related policies, it is important to know the total effects of the exclusionary school discipline on achievement outcomes of all students. Therefore, I separately identify the effect of exclusionary school discipline on the achievement outcomes of offending students, students with no offense record, and all students.13
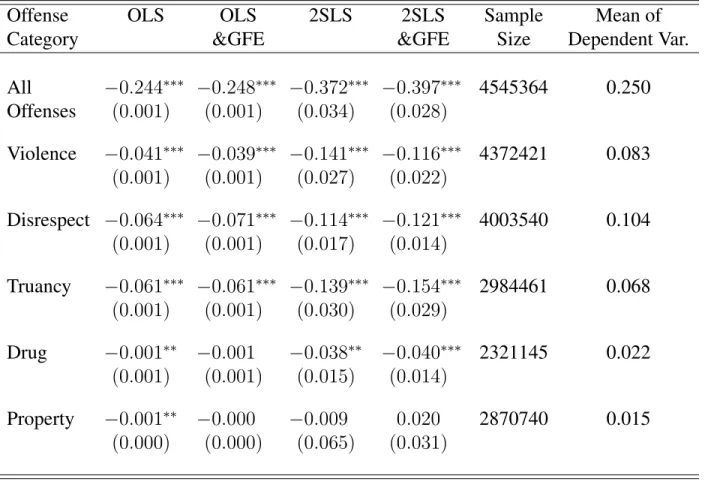
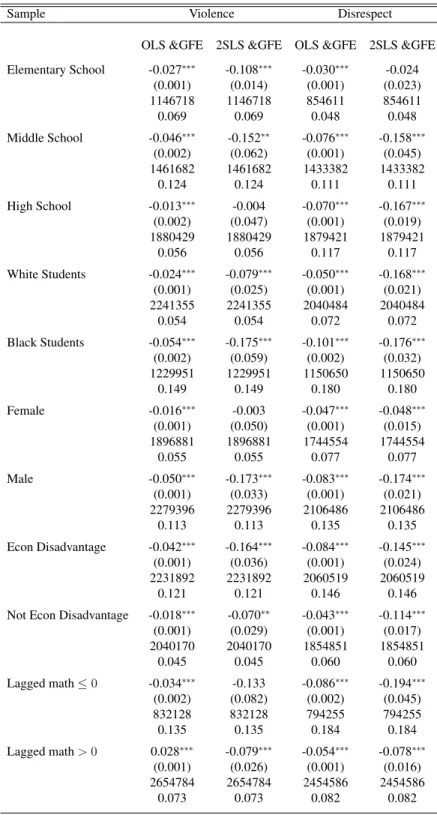
Using linked administrative data with detailed misbehavior records for all North Carolina pub-lic school students in grades 3-12 from the 2008-2009 to 2014-2015 academic years, this research makes several contributions to the literature. First, I find statistically significant “general deter-rence effects” of harsher discipline rules (measured by out-of-school suspension likelihood) on students’ first offenses. The effects are heterogeneous for different types of offenses and different student subpopulations. For example, while a 10 percentage point increase in the out-of-school suspension likelihood reduces the mean rate of first offenses for most categories or types of of-fenses by 7 to 40 percent, this effect is not statistically significant for some types of ofof-fenses, such as “fighting.” In addition, I find that the effect is generally smaller for students’ repeat offenses
11The general and specific deterrence effects can be with opposite signs since the exclusionary school discipline
may encourage students to commit offenses and the experience of out-of-school suspension may be a “bad lesson” to students and increase their likelihood of re-offending instead.
12In North Carolina, as in most U.S. states, local boards of education establish their own disciplinary policies
following the broad principles in the state statutes. However, the disciplinary policies often list a broad range of punishments for each type of misbehavior and, thus, school principals or assistant principals may, at their discretion, determine appropriate punishment for each student infraction instance.
13A student with no offense record means that she does not have an offense record in my sample period. I use them
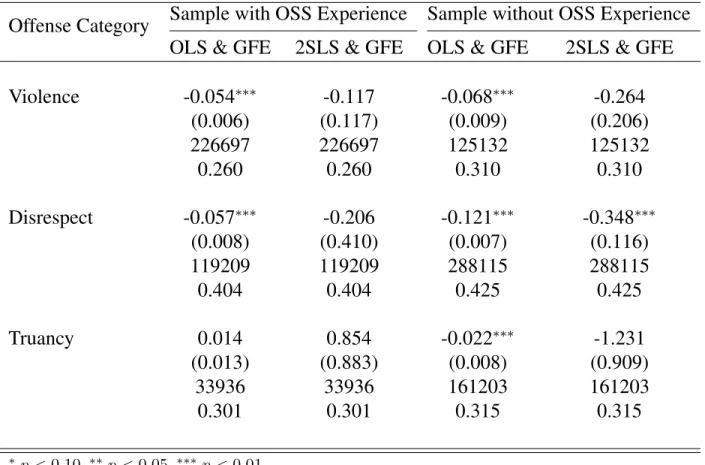
and not statistically significant for students who have already had an out-of-school suspension ex-perience. I also find suggestive evidence that the “specific deterrence effect” is either small or not statistically significant.
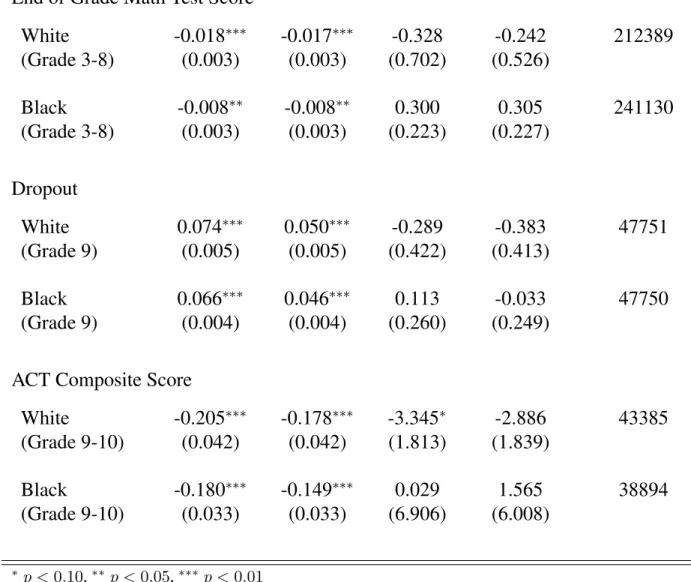
Second, and contrary to the existing literature, I find that the effects of suspension experience on offending students’ achievement outcomes are either small or not statistically significant. For example, an OLS regression with a limited set of controls suggests that a suspension is associated with lower end-of-grade math test scores of offending students by as much as 0.2 standard devi-ations, but estimates using my preferred empirical strategy suggests that this effect of suspension is not statistically significant. Furthermore, while the OLS regression suggests that suspension experience is positively associated with an offending high school student’s dropout probability with increases as high as 18 percentage points, my preferred estimator suggests no statistically significant causal effect. Since the major argument of “school to prison pipeline” theory is that suspension increases the probability of dropping out of high school, and high school dropouts are more likely to be involved with the justice system, this invalidation of the first premise suggests that the “school to prison pipeline” argument is questionable. In addition, these results do not support the argument that the black-white suspension disparity creates a black-white achievement gap.
Finally, I find that harsher disciplinary rules have statistically significant positive but small effects on end-of-grade math scores of students with no offense record.14 For example, I find that a 10 percentage point increase in the out-of-school suspension likelihood in a school could increase the end-of-grade math scores of middle school students with no offense record by about 0.02 standard deviations. I also find that they have an overall positive effect on all middle school white students’ end-of-grade math scores. However, I find that the effects are not statistically significant for other student populations or other achievement outcomes.
My preferred estimation procedure identifies the causal effects by a strategy that combines the instrumental variable (IV) method with a method (two-step grouped-fixed effects) that addresses
the “selection on students’ unobservables” in a large-scale data context. The identification strategy exploits important features of the data; namely, students and principals are followed across aca-demic years and across schools.15 The IV is a measure of out-of-school suspension propensities of principal teams, which is constructed by principal team members’ out-of-school suspension deci-sions in other schools. It is assumed to affect students’ misbehavior or achievement outcomes only through the principal teams’ discipline decisions in the school of concern.
A problem with directly applying the IV strategy is that the “selection on students’ unobserv-ables” is not addressed and it may jeopardize the validity of IV. Since traditional approaches to address this issue are quite computationally expensive given the sample size (to be detailed in section 1.3), my preferred model uses an empirical framework that combines the IV method with recent approaches (i.e., two-step grouped-fixed effects) that address the unobserved heterogeneity problem. Following the literature (Lin and Ng 2012; Bonhomme and Manresa 2015; Bonhomme, Lamadon, and Manresa 2016b), I model the student unobserved heterogeneity in a flexible yet par-simonious way, which allows it to vary across different groups (types) of students, across different types of misbehaviors and across different academic years. I estimate the causal effects by iden-tifying group memberships of students in the first step, and then applying the IV strategy with an imputation of the group memberships of students in the second step. The step identifying students’ group memberships applies the k-means clustering algorithm, which is widely used in machine learning and other related fields (Forgy 1965; Steinley 2006). Since the model also includes school fixed effects, the second step identifies the causal effects by comparing outcomes of otherwise identical students in the same identified unobserved heterogeneity groups in the same schools but assigned to principal teams with different out-of-school suspension propensities.
In addition to the literature mentioned above, the work of Kinsler (2013) is most closely related to my research. Using data on middle school students in the three largest school districts in North Carolina in one academic year (2000-2001), Kinsler (2013) studies the effects (and mechanisms) of
15The feature that principals transfer across schools is used to construct the IV. The feature that students are followed
racial disparities in school discipline on the racial achievement gap in end-of-grade test scores. This work documents significant “general deterrence effects” of out-of-school suspension.16 It also doc-uments that out-of-school suspension has an overall positive influence on middle school students’ end-of-grade test scores. The study attempts to address the endogeneity and selection issues by including permanent unobserved student heterogeneity while jointly estimating structure parame-ters of student behavior, end-of-grade test score production, and principals’ punishment decisions. It assumes, conditional on the observed student characteristics and the permanent unobserved stu-dent heterogeneity, that discipline punishments are exogenous; that is, they are predetermined by principals with identical preferences by their forward-looking evaluation of different parties’ wel-fare at the beginning of the academic year. Using this assumption, the study achieves identification without an exclusion restriction that affects principals’ punishment decisions but does not affect students’ misbehaviors. However, a concern is that there might be unobservables that determine principals’ decisions other than permanent unobserved student heterogeneity, such as school-level unobservables, time-varying environmental shocks, student level time-varying unobserved factors or the unobserved severity of offenses. My analysis shows that the exclusion restriction (or IV) I construct, which stems from heterogeneous preferences of principals (in contrast to Kinsler’s identical preferences assumption), is important to recover the causal effects.
The rest of the chapter is organized as follows. In section 1.2, I describe the data used in estimation. In section 1.3, I present the empirical framework. Section 1.4 discusses important estimation details. Section 1.5 offers results. Section 1.6 concludes.
1.2 Data Description
1.2.1 Data Sources
This study uses administrative data from North Carolina public schools provided by the North Carolina Education Research Data Center (NCERDC). The data were originally collected by the North Carolina Department of Public Instruction (NCDPI) and the National Center for Education
16Comparing the magnitude of the general deterrence effects between my research and Kinsler (2013) is not
Statistics (NCES). They include all North Carolina public school students’ disciplinary infraction records, academic records and other administrative information. They also include teachers’ and other licensed personnels’ information, and other school-level statistics.17
The students’ disciplinary infraction records were collected by the NCDPI through each local education agency’s (LEA) superintendent’s office (Director/Principal’s office in the case of charter schools). They were first reported by the school disciplinary data coordinator, but the principal is ultimately responsible for the data elements. Due to state and federal statutes and state Board of Eduction policies, a record of offense incidents involving the following must be reported: 1.) any of 17 criminal acts committed on a school campus or in connection with a school function;18 2.) any act resulting in an out-of-school suspension or expulsion; 3.) any in-school suspension received by an exceptional student;19 4.) any of the following acts, regardless of consequences assigned: fighting (or affray), bullying, discrimination, harassment, a violent assault not resulting in serious injury, communicating threats, gang activity, extortion, property damage, and possession or use of tobacco products. In addition to the offense incidents required to be reported by statutes and policies, other routine disciplinary incidents were also recorded and reported for analysis or administrative purpose. Guidelines have been created to ensure consistent reporting.
The academic records were collected by the NCDPI, and include of-grade test scores, end-of-course test scores, ACT scores and other academic record information of all North Carolina
17Additional information on perceptions of school environments is obtained from a survey (NCTWCS) of all
teach-ers, principals and other licensed personnel in North Carolina public and charter schools conducted by the North Carolina Professional Teaching Standards Commission (NCPTSC) and the Governor’s office. Additional information on Positive Behavior Intervention and Support (PBIS) school recognition is collected from the NCDPI website.
18The 17 reportable acts are: homicide, assault resulting in serious bodily injury, assault involving the use of a
weapon, rape, sexual offense, sexual assault, kidnapping, robbery with a dangerous weapon, robbery without a dan-gerous weapon, taking indecent liberties with a minor, assault on school personnel, bomb threat, burning of a school building, possession of alcoholic beverage, possession of controlled substance in violation of law, possession of a firearm or powerful explosive, and possession of a weapon. Robbery without a dangerous weapon was removed from this category (moved to category 5) after the 2009-2010 academic year. The 17 (or 16) criminal acts are required to be reported to law enforcement before the 2011-2012 academic year. Since the 2011-2012 academic year, possession of alcoholic beverage, bomb threat, and burning of a school building are no longer required to be reported to police.
19Guidelines in later years (e.g., 2014/2015) require reporting any act resulting in-school suspension. I do not find
public school students. In North Carolina, students in grades 3-8 are required to take end-of-grade tests in reading and math, and students in grades 9-12 are required to take end-of-course tests for Algebra I and English 1 when they are enrolled for credit in these courses.20 In addition, beginning in the 2012-2013 academic year, every 11th grader is required to take the ACT college entrance exam as part of the new North Carolina Standard Course of Study. These test scores are used as academic achievement measures in this essay.21
The disciplinary infraction records were matched with the academic records and all other in-formation by NCERDC.22 Each student and licensed school personnel was assigned an unique identifier (a randomized number). This identifier allows me to follow a student or school personnel (e.g., principals or assistant principals) over time and across schools, which is important for my identification strategy.
1.2.2 Sample Construction
The disciplinary infraction data provided by NCERDC span academic years from 2000-2001 to 2014-2015. Beginning in the 2007-2008 academic year, reporting requirements for offenses have been greater, and the matching rate of infraction data with other data has largely increased.23 However, in the 2013-2014 academic year, there may be a data imputing problem caused by an upgrade of the data system of the N.C. public schools.24 Therefore, for most of the empirical
20An End-of-Course test in English 2 instead of English 1 has been required since the 2012-2013 academic year.
The data also include records of students who were absent or exempt from the tests.
21Other academic records provided by NCERDC, such as end-of-grade or end-of-course test scores for writing,
computer skills, biology, Algebra 2, Civics and Economics, U.S. History, Chemistry and Physics, and SAT scores are not used in this essay because they are not available for all the academic years (or only available for a subset of the students).
22The detail of the matching process is on the website of NCERDC:
http://childandfamilypolicy.duke.edu/research/nc-education-data-center/list-files-variables/.
23The matching rate is greater than 99 percent since the 2007-2008 academic year.
24Since the 2013-2014 academic year, N.C. public schools have upgraded from an NC WISE to a Pearson’s
work, I use data from the 2007-2008 to 2012-2013 academic years. I use the 2013-2014 and 2014-2015 academic year data mostly for robustness checks, except that the ACT score information and dropout information in these academic years are used for the main estimation.25
The data for charter schools are not used in this essay because the offense reporting requirement and rates can be different and school administrator information is largely unavailable. In addition, I use student observations in grades 3-12 since several common explanatory variables, such as economically disadvantaged status and limited English proficiency status, are not available for grades K-2.
In the data, there are 1,909,831 distinct public school students in grades 3-12 from the 2007-2008 to 2012-2013 academic years, who contribute 6,559,362 student-year observations.26 For most of the empirical work, lagged student or school offense statistics are used as explanatory variables; in these cases, the 2007-2008 academic year data are used for explanatory variables but not dependent variables. Further, I drop schools missing one or more years of data. These deletions result in 1,687,330 distinct students and 5,271,039 student-year observations. I use this sample to calculate the summary statistics in the next subsection. Depending on the empirical work, there may be additional data selections. For example, for estimating the effects of suspension on end-of-grade test scores, I use students in grades 3-8. For estimating the effects on ACT scores, I mainly use disciplinary data of students in grade 9-10 from the 2009-2010 to 2012-2013 academic years, with their ACT scores from the 2012-2013 to 2014-2015 academic years. For the effects on dropout probability, I mainly use grade 9 students’ disciplinary data with the information that they finally graduate or dropout from high school.27
25The IV is constructed by using punishment records from the 2007-2008 to 2014-2015 academic years. The
2013-2014 and 2013-2014-2015 academic year data are used to ensure enough observations to construct the IV.
26A student-year observation is calculated as one yearly observation per student if the student is ever enrolled and
assigned an identifier in the data. The student might have several offenses or transfer to different schools within one year, but they are all regarded as one observation in this calculation. Students who are not matched between disciplinary data and other administrative data (less than 1%) are not in this calculation and not used for this essay.
27In the dropout analysis, only first time grade 9 students (no students who repeat grade 9) are included in the
1.2.3 Descriptive Statistics and Data Issues
There are 3,951,754 recorded offense instances in the constructed sample, which were com-mitted by 651,040 distinct students with 1,236,497 student-year observations. That means about 23 percent of student-year observations have at least one offense in the academic year, and about 38 percent of distinct students have at least one offense record in the sample period. In addition, about 56 percent of offending students re-offended in the same academic year.28 About 20 percent of distinct students (349,611 distinct students) had at least one out-of-school suspension record in the sample period.29
The NCDPI classified offenses using about 90 offense types.30 There were nearly 40 conse-quence types that were assigned to the offenses. The most commonly used conseconse-quence types were out-of-school suspension and in-school suspension, each representing about 30 percent of all consequences in the data. Most of the out-of-school suspensions were short-term (≤ 10 days); only one percent of out-of-school suspensions were long-term (>10days).31 There were only 146 cases of expulsions in the sample. Most other consequence types were less severe punishments than suspensions, such as lunch detention or a warning.32 Since controversy in policy making surrounds of-school suspension, my empirical work simplifies the punishment as either out-of-school suspension (including expulsion) or not, where the “not” category includes in-school
Since there might still be censored information for students who repeat grades, I do robustness checks by only using students from the 2008-2009 to 2010-2011 academic years.
28The calculation is based on student-year observations but not distinct students.
29About 10 percent of student-year observations (577,886 student-year observations) were out-of-school suspended
at least once in the academic year.
30Each offense instance may be described by multiple offense types. Since only about one percent of offenses have
associated with them more than one offense types, I use the first (typically most serious) offense type to represent the offense. The number of offense types and the definition of each type changed across years. They only changed slightly, however, from 2007 to 2015 and most of the changes only involve adding new types.
31According to the North Carolina state statute, a long-term suspension must be assigned by the superintendent
under a principal’s recommendation (115C-390.7).
32One percent of offenses were assigned the consequence of “alternative learning program.” Of these, about 40
suspension or other less severe punishments.33
To simplify the discussion, I provide two classifications of the offense types based on their similarities.34 The first classification contains six categories - “violence,” “drug,” “disrespect,” “truancy,” “property” and “other offenses.” This classification is used to discuss deterrence effects by category. A more detailed classification further divides the “violence” and “other” categories into four sub-categories respectively, resulting in twelve categories. This classification is used for constructing explanatory variables and identifying student unobserved heterogeneity. Appendix A shows the offense types in each category by classification. One concern for estimating the deter-rence effects of out-of-school suspension is that additional punishments assigned by the juvenile justice system for criminal acts are not observed. Very few violent offenses (less than 4 percent) and property offenses (less than 0.5 percent) required reporting to law enforcement. Most of the offenses in the “drug” category, however, required such reporting and might have resulted in addi-tional punishment; results from this specification should be interpreted with caution.
Table 1.1 provides summary statistics for different categories of offenses and several types of offenses within categories.35 The percentages of offenses punished by out-of-school suspension (Column 3-4) show that out-of-school suspension was frequently used even for minor offenses, such as disruptive behavior and excessive tardiness.36 The generally higher rates of out-of-school suspension for students’ second offenses than for their first offenses reflect that escalating pun-ishment rules are commonly used in education practices. This finding motivates my empirical framework that separately specifies the first and second punishment in order to more fully evaluate the deterrence effects.
33Additional inquiry into the effects of in-school suspension on students’ misbehavior or achievement outcomes
would complement this analysis.
34The classifications also take into account the number of observations.
35“Excessive tardiness” and “disruptive behavior” are from “other” category, which account for more than 53
per-cent of offense cases of the category.
36The percentages also show that the sample includes a large portion of offenses that were assigned less severe
According to the data reporting requirement, almost all types of offenses in the “violence,” “drug” or “property” categories must be reported regardless of the consequences assigned. How-ever, one concern is whether other minor offenses, such as from the category “truancy,” are well reported. To get a sense of the reporting requirement, Column 5 lists the percent of schools with at least one reported offense in the academic year for each type of offense. The percentages suggest that “violence” and “disrespect” offenses are widely reported in many schools.37 Furthermore, although schools were required to report most of the “drug” and “property” offenses, there was a relative low percentage of schools that actually reported them. This low percentage is likely due to lower offense or catching rates. Note that some less severe offenses, such as “disruptive behavior,” are also widely reported. For other less severe offenses, such as “truancy” and “excessive tardi-ness,” the percentages are relative low. A further check by different school levels shows that the reporting rate of these offenses changes largely by school levels. More than 84 percent of middle school or high school school-year observations reported at least one “truancy” case, and more than 50 percent of middle school or high school school-year observations reported at least one exces-sive tardiness case. However, it is likely that many minor offenses were not reported. Therefore, in addition to the econometric effort I will make to address this issue, results from these offenses should be interpreted with caution.
To further illustrate the data, Table 1.2 separately reports sample means of student characteris-tics for the student-year observations with and without any offense record in the academic year. For the observations with any offense record, I further divide them into those who were not punished by out-of-school suspension in the academic year and those who were punished by out-of-school suspension ever in the academic year. The table shows that the three groups differ considerably along all the dimensions, which indicates possible selection of students into the offender group and into the out-of-school suspended group. While the ratios of white students decrease from the no offense group to the offender group, and from the not out-of-school suspended offender group to
37Since, intuitively, the likelihood of being caught committing these offenses should be high, I use these offenses to
the out-of-school suspended group, the ratios of black students differ in these groups in an opposite direction. Black student-year observations account for 23 percent of the no offense group and 33 percent of the not out-of-school suspended offender group, but they account for 51 percent of the school suspended group, which indicates the over-representation of black students in out-of-school suspension rolls. Female students make up a smaller percentage of the offender group and an even smaller percentage of the out-of-school suspended group. Economically disadvantaged students account for a higher percentage of the offender group and an even larger percentage of the out-of-school suspended group.38 The offender group and the out-of-school suspended group were more likely to be physically or intellectually disabled, less likely to be academically and in-tellectually gifted, and more likely to be above typical age in the grade or be repeating the grade in the academic year than the no offense group. They also had lower lagged test scores. Grade 9 was the grade with the highest offense and out-of-school suspension percentages.
1.3 Empirical Framework
In this section, I introduce the empirical framework used to estimate the “general deterrence effects,” the “specific deterrence effects,” and the effects of exclusionary school discipline on stu-dents’ achievement outcomes. I also discuss the motivation for the empirical models and the econometric issues that must be addressed in order to obtain causal effects.
38Economically disadvantaged students are students receiving free or reduced price meals. Eligibility for free
1.3.1 The Model for Students’ Behavior
Let D1ist (D2ist) indicate whether or not student i in school s committed a first (or second)
offense in academic yeart. I assume the following linear-in-the-parameters model:
D1ist =β10+α11P1∗ist+β11Dist−1+β12Gist−1+β13Xiststd+β14Xstsch+β15X−stdist+φ sch
1s +1ist
(1.1)
D2ist =β20+α21P2∗ist+α22P1ist+β21Dist−1+β22Gist−1+β23Xiststd+β24Xstsch+β25X−stdist
+β26D1typeist +β27N1ist+φsch2s +ϑ1ist+2ist if D1ist= 1
(1.2)
where P1∗ist (P2∗ist) is the potential punishment for the student if she commits the first (second) offense; P1istis the actual punishment (out-school suspension or not) received for her first of-fense (i.e., if D1ist = 1); Dist−1 is a vector that captures a student’s misbehavior in academic
year t−1;39 Gist−1 denotes the student’s test scores in academic year t −1;40 Xiststd is a vector of student’s observed characteristics (see variables in Table 1.2);Xsch
st is a vector of time-varying school observables (see variables in Table 1.3);Xstd
−ist is a vector of the student’s peers’ observed characteristics;41 Dtype
1ist is the type of her first offense; andN1ist is a variable that captures the re-maining number of in-school days for the student in the academic year after her first offense. φsch
s
represents school time-invariant factors, which are not observed by the researcher. ϑ1istrepresents
39For these variables, I use the student’s offense frequencies of each misbehavior category (twelve categories) in the
previous academic year.
40I use the student’s lagged math and reading scores from end-of-grade tests (grades 3-8) or end-of-course tests
(grades 9-12) for these variables.
41I use same-grade peers’ characteristics in estimation. The variables include the ratios of black students (to the
unobserved (by the researcher) shocks that were not observed by the student when she chose her be-havior (D1ist), but were observed by administrators when they assigned the punishment (P1ist); for
example, it could be the realized severity of the student’s first offense that was not expected by her when she made the first offense decision. The error termist captures the student’s unobservable (by the researcher) characteristics or other environmental shocks (or misbehavior opportunities) that are observed by the students when they make offense decisions and by administrators when they assign punishments.
The model aims to recover consistent estimates ofα11,α21, andα22. The coefficientsα11and
α21 measure the average “general deterrence effects,” which describe the effects that result from
the threat of a punishment for misbehavior. The coefficient α22 measures the average “specific
deterrence effect,” which describes the role of a previous punishment (as one’s punishment expe-rience) on re-offending.42 The equation 1.1 captures the general deterrence effect of out-of-school suspension on “ever misbehaving or not” in the academic year, and the equation 1.2 isolates the general and specific deterrence effects on “recidivism or not” in the academic year.43
The statistical model can be regarded as an approximation to an economic model of a student’s decision, in which the student chooses to commit an offense or not (Dist) based on her “tastes” for current behaviors and her expectation on potential punishments.44 Her “tastes” for current behaviors are determined by her past behaviors (Dist−1, Dtype1ist,ϑ1ist) through habit formation (or “criminal capital” accumulation), the punishment for her past offense (P1ist) through learning, her past grades (Gist−1), other observables (Xiststd, Xstsch, X−stdist), and student- and school-level unob-servables (ist, φschs ). Theoretically, the effectiveness of the potential punishments (the size of the “general deterrence effects”) will depend on students’ knowledge of or beliefs about potential
42While beyond the scope of this analysis, the model can be expanded to include correlated random coefficients (in
which students sort into suspension status on the basis of heterogeneous gains from the suspension).
43As a robustness check, I also estimate a specification that defines the outcome variables as the student’s first
(second) offense in middle school or high school, instead of the first (second) offense in an academic year.
44A forward-looking student may consider the punishments for the second or further offenses when she chooses
punishments, their forward-looking ability, their expected probability of being caught, and their expected utility loss from punishments (e.g., physical or emotional unhappiness directly due to out-of-school suspension or indirectly due to consequences of out-of-school suspension).45 For example, potential punishments may not effectively deter students from committing offenses if students are fully myopic, or they do not know (or do not correctly understand) the disciplinary rules, or they do not care about the consequences of out-of-school suspension.46
The variable, “remaining number of in-school days” (N1ist), is calculated by subtracting the
days of out-of-school suspension for the first punishment from the total remaining days in the academic year after her first offense. Inclusion of this variable addresses a potential concern when estimating the specific deterrence effect. That is, if a student was out-of-school suspended (or expelled) for the first offense, then she would not be able to re-offend (in-school) during her out-of-school suspension. The “incapacitation effect” might confound the “specific deterrence effect” because a lower re-offending likelihood may be due to less available time for another offense during the academic year and not due to the “wake-up call” effect of the suspension.47 Using the additional variable to control for the “incapacitation effect,” I identify the “specific deterrence effect” by comparing students who have the same remaining number of days to commit the second offense.
For these equations, I also separately estimate the effects by categories (or types) of misbehav-ior, where for categorycmisbehavior, for example, the outcomes are defined as “ever committing a categorycmisbehavior or not in the academic year,” and “re-offending a categoryc misbehav-ior or not in the academic year.” Punishments (or potential punishments) for these specifications
45To discuss the policy-relevant effects, I define the deterrence effects as the effects of objective punishments. See
Apel (2013) for a detailed discussion of perceptual-deterrence and actual deterrence.
46They may even prefer to be punished (i.e., the general deterrence effect is with an opposite sign) if out-of-school
suspension provides greater relative enjoyment than staying in the classroom (studying or not studying). This phe-nomenon is described as “negative reinforcement” in the education literature, which describes that out-of-school sus-pension may offer students an incentive to misbehave.
47A discussion on the relationship between the “specific deterrence effect” and the “incapacitation effect” may be
are defined by the punishments for the corresponding categories.48 If we regard punishments as “prices,” these specifications assume different categories of misbehaviors (demand) operate in dif-ferent markets and are priced separately.49 Therefore, an interesting research question that is not explored in this essay is the substitution patterns of general (and specific) deterrence effects (cross-price elasticities) among different types of misbehaviors; for example, whether harsher punishment for violent behaviors would deter students from truancy.
Note that potential punishment variables (P1∗ist, P2∗ist) are not directly observed in the data. While ex-post realized punishments might be regarded as a good approximation for ex-ante poten-tial punishments for those who misbehaved (and have records of resulting punishments), ex-ante potential punishments for those who did not misbehave need to be carefully defined.50 To address this issue, I use variables P˜1st and P˜2st, to approximate P1∗ist and P
∗
2ist, and to define potential punishments for all students (misbehaved and not misbehaved).51 For misbehavior categoryc, for example,P˜1st (P˜2st) is defined by a “normalized” (by offense types) rate of out-of-school suspen-sion assigned to the first offense (the second offense) ofccategory misbehavior of all the students in schools in academic year t.52 I refer to these variables as “Disciplinary Punishment Indexes
48For these specifications, I include the number of her offenses in other categories before the first offense in the given
category as controls for equation 1.2. I also include her same-grade peers’ offense rates of other offense categories in the current academic year as controls for both equations 1.1 and 1.2. I carefully choose to not control for the peers’ offense rates of the same offense category model in order to allow the general deterrence effect for violent behavior, for example, to include both its direct effects on a students’ violent behavior and its indirect effects through the student’s peers’ violent behavior. I control for offense rates of other categories because one concern for my IV estimates (introduced later) by category of offense is that the IV may change the discipline decisions for other categories as well. This response might be another channel that through which the IV affects the misbehavior outcomes in the discussed category if the discipline rule for the category is not representative for other categories. Robustness checks are done with controls for peers’ offense rates in all offense categories to achieve the direct effects (not through peer effects) of the discipline. Robustness checks are also done without controlling for peers’ misbehavior rates to address the concern that controlling for the peers’ offense rate in other categories may cause an additional endogeneity problem for estimating the deterrence effects.
49Cross-market criminal capital accumulation is allowed since past offenses of all categories are controlled for,
although cross-market specific deterrence effects are not studied.
50Punishments for those who misbehaved but were not caught or reported by the administrators are also not
ob-served.
51The reason for using these variables to define potential punishments for all students but not only for
(DPI)” of the school. I discuss the details of their construction in section 1.4.2.
To recover the general and specific deterrence effects, an important issue is the endogeneity of the punishment variables caused by principals’ decisions (P1ist, P˜1st andP˜2st); that is, principals’ punishment decisions may depend on unobservables in equation 1.1 and 1.2.53 A related concern for recovering the specific deterrence effect is the selection of students into committing a first offense (D1ist = 1) (the “selection issue”). From equation 1.1, we know that ifα11 6= 0, we have
Cov( ˜P1st, 1ist|D1ist = 1) 6= 0. Therefore, sinceP1ist is correlated withP˜1st by construction, we might haveCov(P1ist, 2ist|D1ist= 1)= 06 ifCov(1ist, 2ist)6= 0.54 Additional concerns include: student misbehaviors are not observed if they were not caught or reported and endogeneity of past behaviors, test scores, and remaining number of days variables (Dist−1Gist−1,N1ist) in these
equations, which might affect identification of deterrence effects. I discuss how I address these concerns in the subsequent subsections.
1.3.2 Administrators’ Punishments and Identification Strategies
A principal or an assistant principal’s punishment rules or decisions may depend on misbe-havior frequencies and severity and other observable or unobservable characteristics of students or schools since these factors may affect their beliefs on the optimal rules or decisions that maximize the welfare of students and other stakeholders. In addition, it is also possible that some principals’ punishment decisions are affected by their prejudice toward students with particular observed or unobserved characteristics. The inclusion of the comprehensive set of controls in the student mis-behavior equations (Dist−1,Gist−1,Xiststd,Xstsch,X−stdist,D
type
1ist,φschs ) partially addresses the concern
assigned for the current year offending students should exactly be the potential punishments they would get when they make offense decisions, and these punishments should also better reflect the current year disciplinary policy for other students. The idea of not using past year data to construct the measure also follows the spirit of the “Lucas Critique.” The problem in this context could be, for example, if the ineffectiveness of past year lenient punishments had led the principals to change to a harsher discipline rule in new academic year, which was announced to (or expected by) students and changed their behavior, using past punishments would lead to a false conclusion that the lenient discipline changed students’ behavior.
53The issue is similar forP∗
ist andP˜st, assuming thatP˜st is a good approximation forPist∗ . Therefore, I do not
distinguish them in the discussion that follows.
54The selection problem might also be an issue for estimating the general deterrence effect in equation 1.2 if
that an administrator’s punishment decisions depend on the observables and time-invariant school unobservables. However, it does not address the problem that an administrator’s punishment de-cisions may also depend on other unobservables; that is, P1ist, P˜1st, and P˜2st may be correlated with ϑ1ist, 1ist, and 2ist.55 The first empirical strategy I use to address this issue is an instru-mental variable (IV) method. I specify the following reduced-form equations for the punishment variables:
˜
P1st =γ10+γ11Z1st+γ12Dist−1+γ13Gist−1+γ14Xiststd+γ15Xstsch+γ16X−stdist
+φp,sch1s +p1st
(1.3)
˜
P2st =γ20+γ21Z1st+γ22Z2st+γ23Dist−1+γ24Gist−1 +γ25Xiststd+γ26Xstsch+γ27X−stdist
+γ28D1typeist +γ29N1ist+φp,sch2s + p
2st if D1ist= 1
(1.4)
P1ist =γ30+γ31Z1st+γ32Z2st+γ33Dist−1+γ34Gist−1 +γ35Xiststd+γ36Xstsch+γ37X−stdist
+γ38D1typeist +γ39N1ist+φp,sch3s + p
3ist if D1ist= 1
(1.5)
where the instrumental variables (Z1st,Z2st) describe the out-of-school suspension propensity for
the first or second offense of a principal team, which are constructed as the “normalized” out-of-school suspension rates in other out-of-schools in which the team members worked. That is, for each principal team (i.e., principals and assistant principals) in each school in each academic year, if there were members who had principal experience in other schools, I calculate a “normalized” out-of-school suspension rate for these schools. I use it to construct the IV for suspension decisions in the school of concern.56 The underlying assumption is that principals who were more likely to use out-of-school suspensions in other schools might be more likely to use them in the current school because it may reflect their preferences or beliefs about the effectiveness of out-of-school suspension (or harsher discipline rules). I do not include any out-of-school suspension decisions
55Recall thatP1˜standP2˜stare constructed by actual punishmentsP1ist andP2istfor offending students in school
s; therefore, they might be correlated with the individual level observables or unobservables.
56The IV is defined at the school level but not at the principal level because for each case I do not observe which
(for any types of offenses in any academic years) in the current school in construction of the IV because they may have direct effects on the students’ outcomes in the current school, which would violate the IV assumption. Additional detail about construction of the IV is presented in section 1.4.1. The idea of constructing the IV by using the “punishment propensity” of people is similar in spirit to Kling (2006) and Aizer and Doyle (2015) for the identification of causal effects of incarceration, and Doyle (2007) for the identification of causal effects of foster care.
Suppose∗2ist=ϑ1ist+2ist, the IV strategy is supposed to address the problem thatCov(p1st, 1ist)6=
0, Cov(p2st, ∗2ist|D1ist = 1) 6= 0 and Cov(p3st,
∗
2ist|D1ist = 1) 6= 0, which is due to the en-dogeneity or selection issues discussed before. However, the problem in IV estimation is that, if selection plays a role, the exclusion restriction assumptions for the IV might not be satisfied. The exclusion restriction assumptions areCov(Z1st, 1ist|Ω1ist, φschs ) = 0,Cov(Z1st, ∗2ist|D1ist =
1,Ω2ist, φschs ) = 0andCov(Z2st, ∗2ist|D1ist = 1,Ω2ist, φschs ) = 0, whereΩ1ist (Ω2ist) is the vector of control variables, which include Gist−1, Dist−1, Xiststd, Xstsch, X−stdist (and D
type
1ist, N1ist). How-ever, from equation 1.1, we know that ifα11 6= 0and γ11 6= 0, we have Cov(Z1st, 1ist|D1ist =
1,Ω1ist, φschs ) 6= 0. Therefore, if Cov(1ist, 2∗ist) 6= 0, the assumption Cov(Z1st, ∗2ist|D1ist =
1,Ω2ist, φschs ) = 0might not be satisfied.57 That is, if students react to the threat of punishment when they make first offense decisions, principals with different out-of-school suspension propen-sities may end up with students with different unobserved characteristics in the offending group (D1ist = 1) and, if these unobserved characteristics affect students’ recidivism decisions, the IV assumption would not be satisfied for equation 1.2.
To address this problem, I propose an empirical strategy that combines the IV method with a method that recovers student unobserved heterogeneity. The method that addresses student un-observed heterogeneity follows the recent “two-step grouped-fixed effects” literature (Lin and Ng 2012; Bonhomme and Manresa 2015; Bonhomme et al. 2016b). Specifically, I assume that there are a relatively small number of distinct groups of students. The subscriptgi ∈ {1, . . . , G} rep-resents the student i’s group membership, which is estimated from the data, and is assumed to
not change across time (and across misbehavior categories or types when estimation is for differ-ent categories or types of misbehaviors). Usingn = 1,2 to represent the equation 1.1 and 1.2, I decompose the error termsnist as follows:
nist =θngist+vnist (1.6)
where the componentθngist captures studenti’s unobserved heterogeneity.
58 One way to interpret
θngist is to regard it as a product of some permanent student unobserved characteristics and the
coefficient on these characteristics (the effects of the student unobserved characteristics); that is,
θngist = ρntθgis. I assume that the componentθngist absorbs all the correlation between1ist and
∗2ist. That is, I assume that Cov(v1ist, ϑ1ist+v2ist) = 0, where vnist may capture, for example, transitory environmental shocks.
Modeling the student unobserved heterogeneity may help to addresses the endogeneity of pun-ishment variables and the selection problem discussed above. In addition, it may also help to ad-dress endogeneity of the student’s past offense history (Dist−1), past test scores (Gist−1) and “the
remaining days variable” (N1ist) for estimating both equation 1.1 and 1.2, if the endogeneity bias is assumed to be due to the correlation between the identified student unobserved heterogeneity and these student-level explanatory variables (i.e., if we assume Dist−1 andGist−1 are not correlated
withv1ist orv2ist, and we assumeN1ist is not correlated withv2ist).59 I use this empirical strategy
to estimate equations 1.1 and 1.2.
The estimation proceeds in two steps. The first step is to partition all students into Ggroups. Partitions are determined by an application of the k-means clustering algorithm, which is widely used in machine learning and other related fields (Forgy 1965; Steinley 2006). In the second step, the group-specific unobserved heterogeneity (θngist) is estimated with equations 1.1 and 1.2
58When the estimation is for different categories of types of misbehaviors, the θ
ngist term is also different for
different misbehavior categories (or types), i.e., it isθc
ngist, wherecrepresents a specific category (or type).
59D
ist−1,Gist−1,N1istare also assumed to be uncorrelated withϑ1ist. In reality,N1istmight be correlated with
by imputing the estimated group memberships of students, ˆgi. This step amounts to adding the group membership indicators of students into the new estimation. Details about this procedure are discussed in section 1.4.3.
While I show results using the “two-step grouped-fixed effects” without the IV strategy, my preferred model combines the IV strategy with the “grouped-fixed effects” of students. The IV strategy is important for estimating the general and specific deterrence effects even after condi-tioning on the student unobserved heterogeneity: P˜1st (P˜2st) might be correlated withv1ist (v2ist)
andP1ist might be correlated withϑ1ist (i.e., principals’ punishment rules or decisions might de-pend on environmental shocks and the severity of students’ offenses).60 After conditioning on
θnˆgist, the exclusion restriction assumptions for the IV becomeCov(Z1st, v1ist|Ω1ist, φ
sch
s , θˆgist) =
0, Cov(Z1st, ϑ1ist +v2ist|D1ist = 1,Ω2ist, φssch, θˆgist) = 0, and Cov(Z2st, ϑ1ist + v2ist|D1ist =
1,Ω2ist, φschs , θˆgist) = 0.
The information I use to identify the unobserved heterogeneity is students’ misbehavior de-cisions for different types of offenses across all academic years (Dis = {Dis1, Dis2, ..., Dis¯t}) conditional on observables and school fixed effects. I assume that the student unobserved group is reflected by her misbehavior decisions across time and across different types of misbehaviors. Conditional on all observed factors, students who have different unobserved characteristics, for example, might more (or less) frequently commit offenses across different types of misbehaviors or across time although the punishment rules change across these dimensions.61 Following As-sumption 4 in (Bonhomme et al. 2016b), I assume that vnist are independent across students i, across timet, acrossn, and across different types of misbehaviors and assume that the groups of students are large and well-separated in the population. The assumption allows the product of the
60Principals may change the severity of overall punishments in response to students’ behaviors and the realized
offense rate within a school/academic year. This reaction creates a problem, called “reverse causality,” for estimating the “general deterrence effects,” i.e., observed high (low) rates of out-of-school suspension might be the consequences of, but not the reasons for, high (low) misbehavior rates. “Reverse causality” is another way to interpret the correlation between the punishments and the environmental shocks.
61I use this information because, intuitively, it closely reflects the unobserved factors that cause the selection issue
discussed above. Note thatD1istorD2ist should not be directly used sinceD2ist = 1has positive probability only
number of students’ misbehavior types and the number of academic years to grow polynomially more slowly than the number of students. According to (Bonhomme and Manresa 2015), the as-sumption can be relaxed to allow weak dependence of vnist across types of offenses, academic years or individuals (i.e., assumptions 1 and 2 in Bonhomme and Manresa (2015)).62 However, the assumption that there are only a relatively small number of distinct groups of students in terms of unobserved heterogeneity is critical for achieving consistent estimates using this estimation strat-egy. If the population students’ unobserved heterogeneity is a continuous variable, the method will generate biased estimates and a bias reduction method should be applied (Bonhomme, Lamadon, and Manresa 2016a).
1.3.3 Students’ Achievement Outcomes
For a student who has committed an offense, a principal needs to make a decision on either out-of-school suspending her (i.e., the treatment) or not. An important effect under considera-tion for such a decision is whether the treatment would lead to worse achievement outcomes for the offending student. To study such an effect, I estimate the following linear-in-the-parameters models:
Yist=β30+α31Pist+β31Dist+β32Gist−1+β33Xiststd+β34Xstsch+β35X−stdist+β36D−ist
+φsch3s +ϑist+3ist if D1ist= 1
(1.7)
Yist=β300 +α 0
31P1ist+β310 Dist−1+β320 Gist−1+β330 X
std ist +β
0 34X
sch st +β
0 35X
std
−ist+β
0 36D−ist
+β370 Dtype1ist +φ03schs +ϑ01ist+03ist if D1ist= 1
(1.8)
where Pist is an indicator of whether the student was ever suspended out-of-school in academic yeartandP1istis an indicator of whether the student was suspended out-school for her first of-fense in academic yeart;Distis a vector of her offense frequencies of each misbehavior category in academic yeart;D−istis a vector of her same-grade peers’ average offense frequencies of each
corre-misbehavior category in the current academic year;ϑ01istrepresents unobserved (to the researcher) shocks that were not observed by the student when she choseD1ist, but were observed by
adminis-trators when they assigned the punishmentP1ist, such as the realized severity of the student’s first offense that is not expected by her when she makes the first offense decision. ϑist represents, for example, unobserved severity of all her offenses in academic yeart.
The equations are estimated using students who have ever committed an offense in academic yeart(D1ist = 1) since these students are students at risk for receiving out-of-school suspension treatment. An out-of-school suspension may directly affect an student’s achievement outcomes be-cause, for example, it may reduce the student’s classroom learning time. In addition, it may change the student’ subsequent misbehavior (through the specific deterrence effect) or her peers’ behav-iors and, thus, indirectly affects the student’s achievement outcomes by such behavioral changes. The coefficient α31 captures the direct effect of out-of-school suspension on offending students’
achievement outcomes since students’ behaviors (Dist, D−ist) are in the controls. The coefficient
α031 captures both the direct and indirect effects of out-school suspension for students’ first of-fenses on their achievement outcomes.
Yistin these equations generally represents different types of achievement outcomes. The
out-comes I study include end-of-grade math scores of students (GM ath
ist ), ACT composite scores of students (GACT
is ), and an indicator of whether the student dropped out or graduated (Qis). When the outcome variable is end-of-grade math scores of students, GM ath
ist , the scores for students in grades 3-8 are observed at the end of each academic year and thus the model estimates the short-run effect of the punishment within an academic year. The model has a value added structure since the past outcome (Gist−1) is included and multiple observations across academic years are used for
each student. ACT composite scores of students (GACT
is ) and the indicator of high school dropout or graduate (Qis) are observed only once for each student. Therefore, I estimate, for example, how the punishment to a student in grade 9 affects her final dropout or graduation from high school or her final ACT score.