PRENATAL ARSENIC EXPOSURE IS ASSOCIATED WITH DECREASED MITOCHONDIRAL DNA COPY NUMBER AND INCREASED GENOMIC INDICATORS OF REACTIVE OXYGEN
SPECIES IN NEWBORN CORD BLOOD LEUKOCYTES
Gabriella Noel Gallo
A thesis submitted to the faculty at the University of North Carolina at Chapel Hill in partial fulfillment of the requirements for the degree of Master of Science in the Department of
Environmental Sciences and Engineering in the Gillings School of Global Public Health.
Chapel Hill 2018
©2018
ABSTRACT
Gabriella Noel Gallo: Prenatal Arsenic Exposure is Associated with Decreased Mitochondrial DNA Copy Number and Increased Genomic Indicators of Reactive Oxygen
Species in Newborn Cord Blood Leukocytes (Under the direction of Rebecca C. Fry)
ACKNOWLEDGEMENTS
TABLE OF CONTENTS
LIST OF TABLES ... viii
LIST OF FIGURES ... ix
LIST OF ABBREVIATIONS ... x
CHAPTER 1. INTRODUCTION ... 1
CHAPTER 2. METHODS ... 4
Study Subjects and Subcohort Selection ... 4
Sample Collection ... 5
Detection of Arsenic in Drinking Water and Urine ... 5
DNA Isolation and Genotyping ... 6
Statistical Analysis ... 8
CHAPTER 3. RESULTS ... 10
Demographics, Birth Outcomes, and Leukocyte mtDNA Content of Mothers and Newborns in the Study Population ... 10
Maternal Whole Blood Leukocyte mtDNA Content is Not Associated with Newborn Cord Blood Leukocyte mtDNA Content. ... 11
Maternal Total Urinary Arsenic is associated with Newborn Cord Blood Leukocyte mtDNA Content. ... 12
Newborn Cord Blood Leukocyte mtDNA Content Displayed an 82% Reduction in Comparison to Maternal Urinary Total Arsenic ... 13
20 Infants Contained Genome Wide Expression Data ... 14
Mitochondrial DNA Copy Number is associated with Increased Indicators of Reactive Oxygen Species in the Newborn ... 15
Mitochondrial DNA Copy Number is associated with Key Genes that are Perturbed by Prenatal Arsenic Exposure in the Newborn ... 17
CHAPTER 4. DISCUSSION, LIMITATIONS, FUTURE DIRECTIONS, AND
LIST OF TABLES
Table 1. Selected demographic characteristics, levels of iAs in drinking water
and urinary arsenicals, and mtDNA content of the present BEAR study. ... 11 Table 2. Description of all arsenic measures versus leukocyte mtDNA counts
for mother and newborn. ... 13 Table 3. Arsenic associated genes with significant association to mtDNA copy
number in the newborn. ... 18 Table 4. Top 3 transcriptional regulators as determined by GSEA output. ... 19 Table 5. Top 5 enriched networks as determined by IPA. ... 19 Appendix Table 1. All mtDNA associated genes: 20 infants contain genome
LIST OF FIGURES
Figure 1. Newborn cord blood leukocyte mtDNA copy number versus maternal whole blood leukocyte mtDNA copy number. Log-transformed newborn cord blood leukocyte mtDNA copy numbers are plotted against
log-transformed maternal whole blood leukocyte mtDNA copy number. ... 12 Figure 2. Newborn cord blood leukocyte mtDNA copy number versus
maternal urinary total arsenic. Log-transformed newborn cord blood leukocyte mtDNA copy numbers are plotted against log-transformed
maternal urinary total arsenic levels. ... 13 Figure 3. Newborn cord blood leukocyte mtDNA copy number versus
maternal urinary total arsenic. Log-transformed newborn cord blood leukocyte mtDNA copy numbers are plotted against quartiles of
log-transformed maternal urinary total arsenic levels. ... 14 Figure 4. Gene expression for PRDX5 versus log transformed newborn cord
blood leukocyte mtDNA copy number. Significant association demonstrates a negative relationship between PRDX5 expression and mtDNA copy number in
the newborn. ... 15 Figure 5. Gene expression for PRDX6 versus log transformed newborn cord
blood leukocyte mtDNA copy number. Significant association demonstrates a negative relationship between PRDX6 expression and mtDNA copy number in
the newborn. ... 16 Figure 6. Gene expression for GSTP1 versus log transformed newborn cord
blood leukocyte mtDNA copy number. Significant association demonstrates a negative relationship between GSTP1 expression and mtDNA copy number in
LIST OF ABBREVIATIONS
BEAR Biomarkers of Exposure to ARsenic
As Arsenic
iAs Inorganic arsenic
WHO World Health Organization mtDNA Mitochondrial DNA
ATP Adenosine-5’-triphosphate ROS Reactive oxygen species
Cd Cadmium
DBF Dibenzofuran BPA Bisphenol A
PM Ambient particulate matter
UJED Universidad Juarez del Estado de Durango
UNC Chapel Hill- University of North Carolina at Chapel Hill APGAR Appearance, Pulse, Grimace, Activity, Respiration LBW Low birth weight
SGA Small for gestational age LGA Large for gestational age
HG-AAS Hydride generation–atomic absorption spectrometry LOD Limit of detection
U-iAs Urinary inorganic arsenic
U-tAs Total arsenic in maternal urine
RT-PCR Real-time quantitative polymerase chain reaction SG Specific gravity
Ct Average threshold cycle number ΔCt Delta Ct
miRNA Micro RNA PRDX5 Peroxiredoxin 5 PRDX6 Peroxiredoxin 6
GSTP1 Glutathione S-transferase pi 1
CRIM1 Cysteine rich transmembrane BMP regulator 1
CHAPTER 1. INTRODUCTION
Arsenic exposure through drinking groundwater water is a major public health problem, and it is estimated to effect more than 100 million people globally (Uddin & Huda, 2011). Elevated levels of arsenic exposure are linked to adverse health outcomes (Vahter, 2009). As a known carcinogen, inorganic arsenic targets the lung, skin, liver, prostate and urinary bladder, among other sites (NTP, 2011). Inorganic arsenic exposure is also linked to numerous non-cancerous health outcomes such as heart disease, diabetes, liver
hypertrophy, and detrimental effects on intellectual function and memory (Kapaj, Peterson, Liber, & Bhattacharya, 2006). The World Health Organization (WHO) recommends a limit of 10 µg/L of arsenic in drinking water (WHO, 2006). However, levels of arsenic far beyond this limit have been found in drinking sources around the globe, including India,
Bangladesh, Vietnam, Mexico, and the United States (ATSDR, 2007).
In addition to health effects associated with chronic exposure, exposures that occur during pregnancy are also of concern. Pregnant women and their fetuses are especially susceptible to inorganic arsenic exposure and the associated adverse health effects (Vahter, 2009). Inorganic arsenic is a developmental toxicant that can reach fetal organs by easily crossing the placenta (Concha et al., 1998). Exposure during pregnancy has been associated with both early life and later life diseases. For example, prenatal inorganic arsenic exposure has been associated with increased risk of spontaneous abortion, low birth weight,
addition to adverse early life outcomes, prenatal exposure to arsenic is associated with increased later in life disease (Dauphiné et al., 2011; Naujokas et al., 2013; Smith et al., 2012; Yuan et al., 2010) as well as higher mortality rates in adulthood (Smith et al., 2012).
A potential mechanism that may link pre-natal arsenic exposure to disease
outcomes is through effects to mitochondrial DNA (mtDNA). As an intracellular organelle, mitochondria provide the cell with energy through the production of
adenosine-5’-triphosphate (ATP) by oxidative phosphorylation (Janssen et al., 2015), and are critical in maintaining proper organ and cell function (Shaughnessy et al., 2015). Both the nuclear and mitochondrial genome are essential contributors to this cellular energy-producing apparatus, and of the more than 80 proteins involved in human oxidative phosphorylation, 13 are encoded by maternally inherited mtDNA (Xin & Butow, 2005). Multiple copies of double stranded circular mtDNA are contained in the mitochondria, and these copies can change in number in response to damage or mutations (Janssen et al., 2012). Variation in mtDNA content is a proven marker of mitochondrial damage (Hou et al., 2010), and has a high rate of mutation (Linnane, Ozawa, Marzuki, & Tanaka, 1989). Changes in mtDNA content is an important area of study as it influences mitochondrial function, which has been linked to a variety of disease mechanisms (Hou et al., 2010).
oxidative stress (Janssen et al., 2015). Environmental toxicants such as Cadmium (Cd), Dibenzofuran (DBF), Bisphenol A (BPA), and ambient particulate matter (PM) have been associated with mitochondrial malfunction or changes in mtDNA copy number (Byun et al., 2013; Duarte et al., 2013; Kurochkin, Etzkorn, Buchwalter, Leamy, & Sokolova, 2011; Lin et al., 2013). The effects of these environmental toxicants are profound in the mitochondria, since mitochondria accumulate DNA damage at a five-fold rate as compared to nuclear DNA (Baccarelli, 2015). The effects of arsenic on mtDNA are currently unknown.
CHAPTER 2. METHODS
Study Subjects and Subcohort Selection
From August 2011 through March 2012, pregnant adult women were recruited before delivery at the General Hospital of Gómez Palacio as BEAR participants. The
requirements for participation for each woman included a minimum residence of 1 year in the Gómez Palacio region, confirmation of a pregnancy without complications, and good overall health status. At the start, 221 women were approached for the study. Of those, 93% (n = 206) provided informed consent for participation in the study. Six women were not included in the study as a result of confirmation of a twin pregnancy (n = 1; 0.5%) or sample collection failure (n = 5; 2.4%). Of this number, a total of 164 women were included in our study’s subcohort, as data on their mtDNA was available. The mean gestational age at birth was 39.4 weeks (range, 36–42 weeks). All procedures associated with this study were approved by the institutional review boards of Universidad Juarez del Estado de Durango (UJED), Gómez Palacio, Durango, Mexico, and the University of North Carolina at Chapel Hill (UNC-Chapel Hill) (Laine et al., 2015).
Questionnaires, administered by a social worker, gathered information surrounding the women’s age, education, occupation, time living at residence, smoking status and alcoholic beverage consumption during pregnancy, daily prenatal supplement intake, residence location, seafood consumption, source and daily consumption of drinking and cooking water, and source of bathing water. In addition, information on previous
losses was gathered. Physicians gathered information on birth outcomes and measures of the children, including newborn birth weight, newborn length, gestational age, head circumference, placental weight, and 5-min Appearance, Pulse, Grimace, Activity,
Respiration (APGAR) score at time of delivery by the physician (Montgomery 2000). Data including preterm birth (gestational age < 37 weeks), low birth weight (LBW; < 2,500 g), small for gestational age (SGA; birth weight < 10th percentile), and large for gestational age (LGA; birth weight > 90th percentile) were collected to determine adverse outcomes (Laine et al., 2015). SGA and LGA categories were based on newborn data collected from northern regions of Mexico (Montes-Núñez et al., 2011; Ríos, Tufiño-Olivares, Reza-López, Sanín, & Levario-Carrillo, 2008).
Sample Collection
Before birth, maternal spot urine samples were collected at the hospital. These samples were immediately transferred to cryovials, and placed in liquid nitrogen. Aliquots of urine samples were shipped on dry ice to UNC-Chapel Hill and immediately stored at – 80°C. The research team collected a drinking-water sample at the homes of each of the study participants within 4 weeks of newborn delivery. The subjects’ primary drinking-water source determined the drinking-drinking-water samples that were collected. The women were informed of the levels of iAs in their drinking water within 3 months of delivery, as the levels were not available before the birth of their children (Laine et al., 2015).
Detection of Arsenic in Drinking Water and Urine
et al., 2004; Le & Ma, 1998). The HG-AAG limit of detection (LOD) for iAs in drinking water by was 0.46 µg As/L. The Trace Elements in Water standard reference material (SRM 1643e) (National Institute of Standards and Technology, Gaithersburg, MD) was used for quality control. UNC-Chapel Hill conducted all urine analyses. HG-AAS determined the concentrations of urinary arsenicals, including inorganic arsenic (U-iAs), monomethylated arsenic (U-MMAs), and dimethylated arsenic (U-DMAs) with cryotrapping (Devesa et al. 2004; Hernández-Zavala et al. 2008, 2009). Pentavalent iAs standards (> 98% pure) were used to prepare five-point calibration curves as described previously (Hernández-Zavala et al. 2008), and the SRM 2669 Arsenic Species in Frozen Human Urine (National Institute of Standards and Technology) was used for quality control (Del Razo et al., 2011). iAs, U-MMAs, and DMAs had LOD’s of 0.2, 0.1, and 0.1 µg As/L, respectively. A handheld
refractometer (Reichert TX 400 #13740000; Reichert Inc., Depew, NY) was used to
measure the specific gravity (SG) of each urine sample. The concentrations of U-iAs, in each urine sample were adjusted using the following equation: iAs × (mean SG – 1)/(individual SG – 1) in order to account for differences in water intake/differential hydration as
previously described (Nermell et al. 2008; Yassine et al. 2012). Urinary concentrations of total arsenic (U-tAs) is the sum of iAs, MMAs, DMAs, and were reported as SG-adjusted values (micrograms As/L urine) (Laine et al., 2015).
DNA Isolation and Genotyping
evaluated on a NanoDrop 2000c UV–vis spectrophotometer (Thermo Scientific) (Drobná et al., 2016). Of these, 162 maternal and 140 fetal samples were available for mtDNA analysis. An assay based on real-time quantitative polymerase chain reaction (RT-PCR) was used for both nuclear DNA (nDNA) and mtDNA quantification using TaqMan probe as a fluorescent dye. We amplified the region of the mtDNA using the TaqMan probe
corresponding to forward primer 5’ CCACGGGAAACAGCAGTGATT 3’ (Integrated DNA Technologies) and reverse primer 5’ CTATTGACTTGGGTTAATCGTGTGA 3’ (Integrated DNA Technologies). We amplified the region of the nucleic DNA (nDNA) using the TaqMan probe corresponding to 5’ TGCCAGCCACCGCG 3’-MGB (ThermoFisher, #4316034). The real-time PCR conditions consisted of initial denaturation at 50 °C for 2 minutes and Taq polymerase activation at 95 °C for 10 minutes, followed by 40 cycles at 95 °C for 15 seconds and 60 °C for 1 minute, with a melting curve analysis of 65 °C for 1 minute. Real-time quantitative PCR was carried out using Stratagene nX3005P qPCR System (Agilent Technologies). The ratio of the mitochondrial gene (mtDNA 12S ribosomal ribonucleic acid) to a nuclear gene (Ribonuckease P gene), which is normalized to the reference DNA sample (a pool of 200 test samples) to obtain relative mitochondrial DNA copy number values controlled for plate effects.
To determine the quantities of mtDNA and nDNA present in samples, the average threshold cycle number (Ct) values of the nDNA and mtDNA were obtained from each case. The level of mtDNA was calculated using the delta Ct (ΔCt) of average Ct of mtDNA and nDNA (ΔCt=CtmtDNA-CtnDNA) in the same well as an exponent of 2 (2-ΔCt) (Mondal et al.,
Statistical Analysis
Data were analyzed using SAS 9.3 (SAS Institute Inc., Cary, NC). Firstly, simple regression analyses were conducted to determine the relationship between mtDNA copy number in mothers and infant cord samples, as it is not known if they are related. These were controlled for maternal age at delivery (as a continuous variable), education level as a measure of socioeconomic status (below high school, high school and above), smoking status (dichotomized as yes/no), and alcoholic beverage consumption during pregnancy dichotomized as yes/no). Secondly, we analyzed the relationship between the arsenic measures: drinking water arsenic, maternal urinary arsenic, and infant cord plasma
arsenic. Lastly, mtDNA copy number in infants was merged into existing genome-wide gene expression data (Rager et al., 2014). Of the 38 individuals for which genome-wide gene expression analysis was conducted, there were 20 that were analyzed for mtDNA copy number. These subjects were used to interrogate the relationship between mtDNA copy number and altered gene expression through linear regression analysis where mtDNA was the independent variable and gene expression was the dependent variable.
To understand the relevance of mtDNA-associated genes, a formal enrichment analysis was carried out using Ingenuity Network Analysis (IPA) followed by a gene set enrichment analysis (GSEA) analysis. The affymetrix chip was selected as the background for the enrichment analyses. Predicted network enriches among this gene set were
enriched with the predicted targets. GSEA (PMID: 16199516Subramanian, Tamayo, et al. (2005, PNAS 102, 25545-15550)) was used as a second method to examine pathway enrichment. GSEA uses a rank-based analysis method to assess biological enrichment, and examines discordant differences between two biological states by calculating an
CHAPTER 3. RESULTS
Demographics, Birth Outcomes, and Leukocyte mtDNA Content of Mothers and Newborns in the Study Population
Table 1. Selected demographic characteristics, levels of iAs in drinking water and urinary arsenicals, and mtDNA content of the present BEAR study.
Characteristic Mean [range or %]
Maternal age at delivery (years) 24.1 [18-40]
Education
Below High School
High School and Above 42 [25.6] 122 [74.4]
Smoking Status Yes
No 11 [6.7] 153 [93.3]
Alcohol Consumption Yes
No
36 [22.0] 128 [78.0] Newborn Sex
Male
Female 73 [52.14] 67 [47.86]
Birth Weight (g) 3316 [2100-4690]
Gestational Age (weeks) 39.4 [36.0-42.0]
Drinking Water Arsenic (µg/L) Maternal
Newborn
25.5 [<LOD-235.6] 22.7 [<LOD-226] Maternal Urinary Arsenic (µg/L)
Maternal
Newborn 38.3 [<LOD-319.7] 36.0 [<LOD-261.4]
Infant Plasma Arsenic (ng/L) 336.4[<LOD-2261.6]
mtDNA content Maternal
Newborn 298.8 [27.1-3294.5] 295.8 [11.6-5431.6]
Maternal Whole Blood Leukocyte mtDNA Content is Not Associated with Newborn Cord Blood Leukocyte mtDNA Content.
Figure 1. Newborn cord blood leukocyte mtDNA copy number versus maternal whole blood leukocyte mtDNA copy number. Log-transformed newborn cord blood leukocyte mtDNA copy numbers are plotted against log-transformed maternal whole blood leukocyte mtDNA copy number.
Maternal Total Urinary Arsenic is associated with Newborn Cord Blood Leukocyte mtDNA Content.
We next set out to determine whether arsenic exposure was associated with mtDNA copy number in either maternal leukocyte DNA or newborn leukocyte DNA. We compared all measures of arsenic to both maternal and newborn mtDNA count. Interestingly,
maternal total urinary arsenic levels were associated with infant mtDNA count (β = -0.5894 and p-value<0.0001) (Figure 2), but not maternal mtDNA count. Neither drinking water arsenic nor infant plasma arsenic levels were associated with mtDNA count (Table 2). These data suggests that as prenatal arsenic exposure increased, mtDNA content in
Table 2. Description of all arsenic measures versus leukocyte mtDNA counts for mother and newborn.
Maternal mtDNA count Newborn mtDNA count Drinking Water Arsenic β = 0.002365
p-value= 0.2675 βp-value= 0.4479 = 2.288 Maternal Urinary Arsenic β = -0.007820
p-value= 0.2374
β = -0.5894 p-value<0.0001
Infant Plasma Arsenic -- β = -0.1498
p-value= 0.1715
Figure 2. Newborn cord blood leukocyte mtDNA copy number versus maternal urinary total arsenic. Log-transformed newborn cord blood leukocyte mtDNA copy numbers are plotted against log-transformed maternal urinary total arsenic levels.
Newborn Cord Blood Leukocyte mtDNA Content Displayed an 82% Reduction in Comparison to Maternal Urinary Total Arsenic
The data shown in Figure 3 highlight that in the lowest quartile of arsenic exposure, the average mtDNA content was 6.53, with a standard deviation of 0.77, while at the
one (mean= 10.56 µg/L, range= 4.33-15.05 µg/L) to quartile four (mean= 88.74 µg/L, range= 39.5-319.74 µg/L), mtDNA content decreases by 82.29%.
Figure 3. Newborn cord blood leukocyte mtDNA copy number versus maternal urinary total arsenic. Log-transformed newborn cord blood leukocyte mtDNA copy numbers are plotted against quartiles of log-transformed maternal urinary total arsenic levels.
20 Infants Contained Genome Wide Expression Data
We are fortunate with this cohort to have data from gene expression that was collected for the infants at birth (n=38). Of the infants that had data representing genome-wide gene expression, 20 of the infants in our study had also been profiled for mtDNA. To determine whether mtDNA copy number was associated was the altered expression of genes, we preformed multivariable regression modeling between the content of mtDNA in fetal leukocytes across 53,617 genes. Interestingly a total of 767 of genes displayed
Mitochondrial DNA Copy Number is associated with Increased Indicators of Reactive Oxygen Species in the Newborn
Interestingly, among the genes that showed association between gene expression and mtDNA were genes that encode for proteins that play a role in ROS. We found that the expression of Peroxiredoxin 5 (PRDX5), Peroxiredoxin 6 (PRDX6), and Glutathione S-transferase pi 1 (GSTP1) was associated with mtDNA copy number. All three ROS
associated genes displayed a negative association with mtDNA content (Figure 4, Figure 5, Figure 6). For example, PRDX5 is an endogenous antioxidant involved in the protection against diseases characterized by oxidative stress, and has a significant negative
association (p-value= 0.0025, R2= 0.3899) with mtDNA copy number in the newborn.
Figure 5. Gene expression for PRDX6 versus log transformed newborn cord blood leukocyte mtDNA copy number. Significant association demonstrates a negative relationship between PRDX6 expression and mtDNA copy number in the newborn.
Mitochondrial DNA Copy Number is associated with Key Genes that are Perturbed by Prenatal Arsenic Exposure in the Newborn
Table 3. Arsenic associated genes with significant association to mtDNA copy number in the newborn.
Gene Symbol Full Gene Name R p-value
CRIM1 cysteine rich transmembrane BMP regulator
1 (chordin-like) 0.743978 0.00011044
B3GNT5 UDP-GlcNAc:betaGal
beta-1,3-N-acetylglucosaminyltransferase 5 -0.625077 0.00244686 CD44 CD44 molecule (Indian blood group) -0.565554 0.00754045
UCK1 uridine-cytidine kinase 1 0.556897 0.00873362
MDC1 mediator of DNA-damage checkpoint 1 0.544144 0.0107693
BTNL8 butyrophilin-like 8 -0.526218 0.0142692
ENC1 ectodermal-neural cortex (with BTB-like domain)
0.525335 0.0144629 KLHL28 kelch-like 28 (Drosophila) 0.503986 0.0198317
TXLNG Taxilin Gamma 0.494676 0.0226245
ZNF600 zinc finger protein 600 0.480607 0.0274303
CYTH4 cytohesin 4 -0.47455 0.029733
FGF19 fibroblast growth factor 19 -0.472754 0.0304445 RPS6KA2 ribosomal protein S6 kinase, 90kDa,
polypeptide 2 -0.468801 0.0320576
H3F3B H3 histone, family 3B (H3.3B); H3 histone,
family 3A pseudogene -0.46452 0.0338793
IFNG interferon, gamma 0.455591 0.0379403
EXT1 exostoses (multiple) 1 -0.455381 0.0380401
MFAP3 microfibrillar-associated protein 3 0.45231 0.0395243
MIR4292 MicroRNA 4292 0.443789 0.0438789
CREM cAMP responsive element modulator 0.438579 0.0467196 C2orf57 chromosome 2 open reading frame 57 -0.434613 0.0489749 MXD1 MAX dimerization protein 1 -0.434463 0.0490619 D2HGDH D-2-hydroxyglutarate dehydrogenase 0.433728 0.0494897
Pathway Enrichment Analysis of Predicted Targets.
encoded by this gene is involved in many cellular processes, including apoptosis and response to DNA damage (Bajpai & Nagaraju, 2017).
Table 4. Top 3 transcriptional regulators as determined by GSEA output. Gene Set Name Number of
Genes p-value q-value Specificity Protein 1 (SP1) 94 7.09x10⁻¹⁷ 1.54x10⁻¹³ ELK1, ETS Transcription Factor
(ELK1)
46 3.24x10⁻¹¹ 3.24x10⁻⁸ Transcription Factor 3 (E12) 72 4.49x10⁻¹¹ 3.24x10⁻⁸
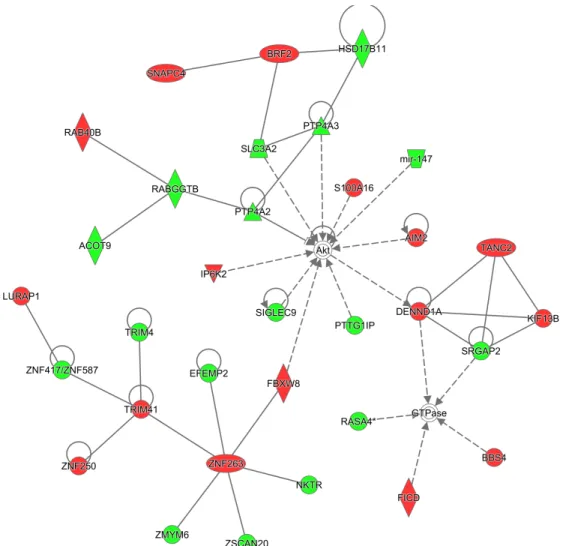
To get a general sense of the biological processes that displayed altered expression in relation to mtDNA, we analyzed the genes for their biological pathways and enrichment and identified using both IPA and GSEA. After performing enrichment analysis, we
identified several pathways of interest (Table 5). Among these were processes relating to cellular and embryonic development (p-value =1.93x10⁻⁸, q-value =3.88x10⁻⁶), which was enriched by 33 genes including NKTR, ACOT9, and SNAPC4.
Table 5. Top 5 enriched networks as determined by IPA. Top Diseases and
Functions
Number of Genes
IPA Score
GSEA
p-value
GSEA
q-value Genes in Network
Cellular Development, Cellular Growth and Proliferation, Embryonic Development
33 54 1.93x10⁻⁸ 3.88x10⁻⁶
ACOT9,AIM2,Akt,BBS4,BRF2,DE NND1A,EFEMP2,FBXW8,FICD,G TPase,HSD17B11,IP6K2,KIF13B ,LURAP1,mir147,NKTR,PTP4A2, PTP4A3,PTTG1IP,RAB40B,RAB GGTB,RASA4,S100A16,SIGLEC9, SLC3A2,SNAPC4,SRGAP2,TANC 2,TRIM4,TRIM41,ZMYM6,ZNF2 50,ZNF263,ZNF417/ZNF587,ZS CAN20 Small Molecule Biochemistry, Cell Morphology, Cellular Assembly and Organization
28 41 3.19x10⁻⁸ 6.08x10⁻⁶
Top Diseases and
Functions Number of Genes IPA Score GSEA value p- GSEA q-value Genes in Network
NF112,SLC2A6,SRSF10,UBE2,U BE2J2,UBE2R2,WDR83OS
Gene Expression, DNA Replication, Recombinatin, and Repair, Cell Cycle
28 41 1.46x10⁻⁷ 2.0x10⁻⁵
ACD,BICRAL,DNMT1,GSTP1,H2 AFV,Hdac,Histone h4,HNRNPC,KCNQ1OT1,KCTD1 3,KIFC1,KNDC1,MDC1,mir- 29,MXD1,N-cor,NUP107,PAF1,PNO1,Ras,Rb, RFWD3,RNPC3,RNU12,RPA,SM ARCD1,snRNP,SNRPE,SNRPN,T BCD,TBX15,USP28,WAC,ZMAT5, ZNF518A Cellular Development, Hematological System Development and Function, Hereditary Disorder
26 37 1.58x10⁻⁷ 2.06x10⁻⁵
ANKRD11,ATAD3B,BORCS5,Cas pase 3/7,CASQ1,CCDC88B,COPRS,cyt ochrome C,ERN2,FAAH,Hsp27,Jnk,L3MBT L1,LACTB,MAGEC2,MAP2K4/7, MAP3K4,MED28,mediator,NDU FAF3,NSMCE4A,PARP,PARP11, PARP12,PARP16,PPAN-P2RY11,PSENEN,Ribosomal 40s subunit,RNF166,Rnr,RPS2,RPS1 1,RPS25,TRIO,ZNF324 Carbohydrate Metabolism, Small Molecule Biochemistry, Post-Translational Modification
25 35 8.96x10⁻⁹ 2.12 x 10 -6
Adaptor protein
CHAPTER 4. DISCUSSION, LIMITATIONS, FUTURE DIRECTIONS, AND CONCLUSIONS
The goal of this study was to examine the relationship between prenatal arsenic exposure and mitochondrial DNA copy number in a population in Gómez Palacio, Mexico with an established exposure ranging from below the limit of detection (0.46 µg As/L) to 236.0 µg As/L (Laine et al., 2015). Mitochondrial dysfunction is associated with increased ROS generation, as well as elevated mtDNA mutations, among other things (Reddy & Beal, 2005). Inorganic arsenic is thus of interest as a potential contaminant associated with mitochondrial dysfunction as is not only associated with an increased level of reactive oxygen radicals, but also increases the risk of oxidative stress in exposed persons (Wu et al., 2001). As an established marker of mitochondrial damage, mtDNA content has been linked to infant outcomes, such as both small and large for gestational age (Gemma et al., 2006). The results of the present study demonstrate that as levels of arsenic exposure increased during pregnancy, mtDNA content decreased. Interestingly, mtDNA content was associated with altered expression of genes known to be involved in ROS and genes known to be altered by arsenic exposure. To our knowledge, this is among the first studies to describe the relationship between prenatal arsenic exposure and mitochondrial DNA copy number in a human population.
resistance (Lee et al., 1998; Song et al., 2001). Specifically, decreased mtDNA content of white blood cells has been shown in type 2 diabetes (Choi, Kim, & Pak, 2001; Gianotti et al., 2008; Wong et al., 2009) and breast cancer (Xia et al., 2009; Yu et al., 2007). Birth outcomes in relation to changes in mtDNA content is an area of our interest, as it has been found that the mtDNA copy number was significantly lower for both small for gestational age and large for gestational age infants in comparison to the mtDNA copy number for appropriate weight for gestational age infants (Gemma et al., 2006). Additionally, in utero exposure to airborne particulate matter with aerodynamic diameter ≤ 10 um (PM10) is associated with
a lower mtDNA content in placental tissue (Janssen et al., 2012). The air pollution results are consistent with a separate report on maternal smoking (a personalized form of air pollution) and a lower mtDNA content (Bouhours-Nouet et al., 2004). It is known that nuclear DNA has more efficient repair mechanisms as well as a lower rate of mutation than does mtDNA (Chistiakov, Sobenin, Revin, Orekhov, & Bobryshev, 2014), as mtDNA lacks protective histones, chromatin structure, and introns (Janssen et al., 2012), as well as is in close proximity to endogenous ROS in the mitochondrial inner membrane (Liu and Demple, 2010) . The proposed hypothesis for the biological basis of this decline is that as
depleted due to the loss of bioenergetics and replicative functions of the defective mitochondria, leading to an ultimate loss of mitochondrial function (Wong et al., 2009).
In the analysis of the relationship between altered gene expression from newborn cord blood and mtDNA copy number in cord-derived leukocytes, a total of 3 genes were identified. Among these were genes that are known to play a role in ROS. For example, the expression of PRDX5, PRDX6, and GSTP1 decreases as ROS increases. Both PRDX5 and PRDX6 are endogenous antioxidants involved in the protection against diseases
characterized by oxidative stress, and their expression has previously been shown to be negatively correlated with biomarkers of inflammation (Kunze et al., 2014). It is
hypothesized that PRDX’s are either consumed or their production is impaired in proportion to degree of oxidative stress. In addition to these genes, GSTP1 was also
identified, which is a critical phase II metabolism gene that plays a role in detoxification in the cell (Hayes, Flanagan, & Jowsey, 2004). Our data displayed a negative association between GSTP1 expression and known ROS related genes, whichis supported by prior work which revealed that decreased GSTP1 expression is involved in the imbalance of oxidant and anti-oxidant in human hepatocellular carcinoma cases (Li et al., 2013). The genes identified were not limited to ROS, but also many have been shown to be altered by arsenic exposure previously (Laine et al., 2016). In this study, a total of 22 genes to be altered by arsenic exposure were identified. For example, in the present study, CRIM1 showed increased gene expression to mtDNA copy number. In a prior study, this gene has been induced by arsenic exposure plays a role in the regulation of cell growth (Bailey et al., 2014). Lastly, pathway analysis identified the top enriched network as cellular
importance of the broader set of mtDNA-associated genes to fetal development. The functional consequence of altered gene expression associated with altered mtDNA copy number should be evaluated in the future.
The study is not without limitations. While we have identified that prenatal arsenic exposure is associated with mtDNA copy number, the exact mechanism for this is
unknown. It is hypothesized that the negative association is a result of arsenic’s ability to damage mitochondria, and reducing their ability to replicate. This loss of replicative function leads to a depletion of mtDNA content and an ultimate loss of mitochondrial function (Wong et al., 2009). Still, future research should focus on determining the
mechanistic basis for this association. A second limitation of the work is that the impact of mtDNA content on functional outcome of children’s health was not studied here. While we did not find any association with mtDNA and birth outcomes this could be a function of sample size and thus future research should seek to establish the relationship between birth outcomes and mtDNA levels related to arsenic exposure.
APPENDIX: SUPPLEMENTAL TABELS
Appendix Table 1. All mtDNA associated genes: 20 infants contain genome wide gene expression data.
Gene Symbol r p-value(correlation)
q-value
(p-value(correlation))
CRIM1 0.743978 0.00011044 0.998676
AIM2 0.728011 0.000183146 0.998676
SOLH 0.724107 0.000206176 0.998676
S100A16 0.716973 0.000254738 0.998676
OR4K14 -0.713333 0.000283089 0.998676
WDR91 -0.700786 0.000402557 0.998676
MFSD1 -0.678102 0.000729235 0.998676
RNA5SP139 -0.676388 0.000761167 0.998676
PTP4A2 -0.675658 0.000775118 0.998676
MIR4642 -0.675392 0.000780248 0.998676
NOXRED1 -0.666009 0.00098101 0.998676
PTGER2 0.661005 0.00110491 0.998676
IL11RA 0.656271 0.00123409 0.998676
LIM2 0.655488 0.00125664 0.998676
LOC100507530 -0.655202 0.00126496 0.998676
NOL12 0.654236 0.00129341 0.998676
LINC00173 -0.65362 0.00131184 0.998676
TMEM114 -0.649546 0.0014394 0.998676
FLJ11235 0.647225 0.00151663 0.998676
RBM10 0.64449 0.00161213 0.998676
KCNQ1OT1 -0.642844 0.00167202 0.998676
MAP7 -0.638352 0.00184503 0.998676
OTTHUMG00000163338 0.634678 0.00199754 0.998676
OTTHUMG00000151591 0.630508 0.00218333 0.998676
FBXL14 0.627865 0.00230844 0.998676
LOC649133 -0.626855 0.00235782 0.998676
ZMAT5 -0.626244 0.00238812 0.998676
B3GNT5 -0.625077 0.00244686 0.998676
PRDX5 -0.624412 0.0024809 0.998676
ACD 0.621357 0.00264239 0.998676
PSENEN -0.621318 0.00264452 0.998676
TRIM64B 0.619774 0.0027295 0.998676
GTF2H1 0.618859 0.00278091 0.998676
TTC38 0.618126 0.00282266 0.998676
MAPK9 0.617536 0.00285669 0.998676
SLC22A20 -0.617116 0.00288113 0.998676
SPATA31A4 -0.616507 0.00291684 0.998676
CBWD3 -0.616361 0.00292546 0.998676
RAB40B 0.614406 0.00304286 0.998676
Gene Symbol r p-value(correlation) (p-value(correlation)) q-value
PPIAP30 0.612695 0.00314885 0.998676
VPS9D1 0.610452 0.00329251 0.998676
BRF2 0.609705 0.00334154 0.998676
SNHG1 -0.608844 0.00339881 0.998676
FER -0.608597 0.00341537 0.998676
GRWD1 0.608141 0.00344617 0.998676
SUZ12P1 -0.605549 0.00362557 0.998676
MKNK1 -0.605404 0.00363583 0.998676
ANKRD10-IT1 -0.605017 0.00366332 0.998676
RTN4RL1 -0.60397 0.0037386 0.998676
LYPLAL1 -0.603223 0.00379311 0.998676
TMEM5 -0.603093 0.00380268 0.998676
LOC100130071 -0.602142 0.00387312 0.998676
HCRTR1 -0.600086 0.00402929 0.998676
SNORD121B -0.598738 0.00413444 0.998676
SLC25A13 -0.598405 0.00416076 0.998676
LOC100506713 -0.598233 0.00417445 0.998676
ZMYND10-AS1 0.596732 0.00429515 0.998676
MIR29C -0.596368 0.00432491 0.998676
SCN4B 0.596043 0.0043516 0.998676
OR52B6 -0.595121 0.00442796 0.998676
PAN2 0.592321 0.0046669 0.998676
PRND -0.591535 0.00473588 0.998676
ENO1 -0.590504 0.00482762 0.998676
NANP 0.59013 0.00486125 0.998676
MIR147A -0.589994 0.00487354 0.998676
ERLIN2 0.588687 0.00499291 0.998676
ENTPD4 0.588421 0.00501752 0.998676
GTSF1 -0.588229 0.00503535 0.998676
DND1 0.588029 0.00505393 0.998676
OASL 0.587521 0.00510141 0.998676
GAGE12C 0.58739 0.00511374 0.998676
TMEM234 0.58687 0.00516287 0.998676
RNA5SP65 -0.58636 0.00521145 0.998676
LINC00885 0.585862 0.00525922 0.998676
LCAT -0.585612 0.00528334 0.998676
NPR2 0.584776 0.00536466 0.998676
SRM 0.583566 0.00548419 0.998676
SURF2 0.583506 0.00549018 0.998676
KIAA0754 -0.583505 0.00549026 0.998676
PTP4A3 -0.583279 0.00551285 0.998676
LILRB4 -0.582601 0.00558101 0.998676
SNORA11D 0.582366 0.00560491 0.998676
Gene Symbol r p-value(correlation) (p-value(correlation)) q-value
FAM127B 0.580701 0.00577596 0.998676
CASQ1 0.580172 0.00583122 0.998676
MIR433 -0.579069 0.00594786 0.998676
GDPGP1 0.578702 0.00598718 0.998676
CMAHP 0.577063 0.00616498 0.998676
PLA2G2C -0.576021 0.00628025 0.998676
ING5 -0.575795 0.0063055 0.998676
SEMA5A 0.574877 0.00640891 0.998676
ABCA2 0.574774 0.00642058 0.998676
LOC100128172 0.573944 0.00651539 0.998676
VCAN-AS1 -0.573138 0.00660862 0.998676
PARP11 -0.571946 0.00674842 0.998676
UPB1 0.570407 0.00693253 0.998676
PEX6 0.569966 0.00698608 0.998676
ZNF439 0.569782 0.00700857 0.998676
CLDND2 0.56976 0.00701116 0.998676
WNT3A 0.568408 0.00717787 0.998676
CFD -0.567989 0.00723022 0.998676
ZNF90 -0.567223 0.00732671 0.998676
RNA5SP486 0.566799 0.00738051 0.998676
TMEM163 -0.566792 0.00738136 0.998676
DVL3 0.566784 0.00738237 0.998676
PBX4 -0.566147 0.00746396 0.998676
PEX7 -0.565729 0.0075179 0.998676
CD44 -0.565554 0.00754045 0.998676
ZSCAN20 -0.565439 0.00755544 0.998676
HSPA9 0.563589 0.00779884 0.998676
MIR181A2 0.563208 0.00784973 0.998676
FAM192A -0.563007 0.00787674 0.998676
PER2 0.562123 0.00799621 0.998676
H6PD 0.561758 0.00804606 0.998676
RARRES2 0.561545 0.00807514 0.998676
PINLYP 0.561314 0.00810694 0.998676
FAAH -0.559086 0.00841818 0.998676
CRY2 0.558885 0.00844681 0.998676
LOC728145 0.558667 0.00847782 0.998676
ZCCHC17 0.558234 0.00853983 0.998676
RPS25 -0.557696 0.00861745 0.998676
MED28 -0.557599 0.0086315 0.998676
UCK1 0.556897 0.00873362 0.998676
MVD 0.556794 0.00874874 0.998676
TOR2A 0.556196 0.00883666 0.998676
KCTD13 0.556169 0.00884068 0.998676
Gene Symbol r p-value(correlation) (p-value(correlation)) q-value
ACTN1-AS1 0.555199 0.00898484 0.998676
CBWD5 -0.553421 0.0092542 0.998676
OTTHUMG00000018686 -0.553291 0.0092742 0.998676
GALNT12 0.553189 0.0092899 0.998676
HABP4 0.552933 0.0093293 0.998676
ERVK3-1 0.552157 0.00944981 0.998676
FZD6 0.551889 0.00949165 0.998676
FKBP2 0.551503 0.00955218 0.998676
GPR62 0.549708 0.00983819 0.998676
LINC00638 0.548901 0.00996908 0.998676
PARP16 -0.54848 0.0100379 0.998676
CCDC6 -0.547434 0.0102105 0.998676
AHCY -0.547288 0.0102346 0.998676
SCRN3 -0.547109 0.0102646 0.998676
LOXL3 0.546918 0.0102964 0.998676
OTTHUMG00000035804 0.546888 0.0103014 0.998676
LMBR1 -0.546653 0.0103409 0.998676
ACOT9 -0.546632 0.0103444 0.998676
SNRPN -0.546178 0.0104209 0.998676
LOC100506048 0.545488 0.010538 0.998676
OTTHUMG00000164174 0.545112 0.0106023 0.998676
UNKL 0.545109 0.0106028 0.998676
STAT4 0.544322 0.0107384 0.998676
MDC1 0.544144 0.0107693 0.998676
RNA5SP462 -0.543727 0.0108419 0.998676
ZDHHC11 0.543558 0.0108714 0.998676
INSIG2 -0.542953 0.0109776 0.998676
CLEC18C 0.54269 0.0110241 0.998676
OSER1-AS1 0.542678 0.0110263 0.998676
RAP1B -0.542362 0.0110823 0.998676
PPP1R12C 0.541992 0.0111482 0.998676
KLHL17 -0.541859 0.0111718 0.998676
EXOC3L1 0.541293 0.0112734 0.998676
LURAP1 0.541031 0.0113207 0.998676
C2orf42 0.541018 0.0113231 0.998676
ARFGAP2 0.540425 0.0114308 0.998676
OSGEP -0.540084 0.0114931 0.998676
RHBDF2 0.539988 0.0115106 0.998676
KBTBD11 0.539014 0.0116902 0.998676
L3MBTL1 0.538522 0.0117818 0.998676
MPP5 -0.538089 0.011863 0.998676
ATAT1 0.537681 0.0119397 0.998676
ATAT1 0.537681 0.0119397 0.998676
Gene Symbol r p-value(correlation) (p-value(correlation)) q-value
ATAT1 0.537681 0.0119397 0.998676
ATAT1 0.537681 0.0119397 0.998676
ATAT1 0.537681 0.0119397 0.998676
ZNF263 0.537396 0.0119937 0.998676
NFKBIL1 0.537095 0.0120509 0.998676
DUS3L 0.53694 0.0120804 0.998676
SNORD116-10 0.536295 0.0122037 0.998676
LOC100506801 -0.53618 0.0122259 0.998676
RPS2 -0.535883 0.012283 0.998676
FBXW8 0.53536 0.0123844 0.998676
RABGGTB -0.534324 0.0125874 0.998676
TMEM132A 0.533309 0.0127887 0.998676
CALHM1 0.533114 0.0128276 0.998676
ZXDA -0.533094 0.0128316 0.998676
WHAMM 0.532997 0.0128511 0.998676
ZCCHC5 -0.532897 0.012871 0.998676
LAYN 0.532878 0.0128749 0.998676
PTTG1IP -0.532682 0.0129143 0.998676
RPL23AP53 0.53237 0.0129773 0.998676
RAB5C -0.531753 0.0131023 0.998676
TMEM91 -0.53149 0.0131559 0.998676
NADSYN1 0.530119 0.0134384 0.998676
RHOBTB2 0.529923 0.0134793 0.998676
FAM173A 0.529543 0.0135586 0.998676
ARL16 0.529129 0.0136455 0.998676
SMG9 0.529101 0.0136513 0.998676
ZNF737 -0.528893 0.0136952 0.998676
NR5A1 -0.528671 0.0137421 0.998676
OTTHUMG00000149070 0.527107 0.0140764 0.998676
ZHX2 -0.526654 0.0141743 0.998676
SRGAP2 -0.526275 0.0142568 0.998676
BTNL8 -0.526218 0.0142692 0.998676
EMC7 -0.525822 0.0143558 0.998676
ENC1 0.525335 0.0144629 0.998676
LOC115110 0.525321 0.0144659 0.998676
OTTHUMG00000158962 -0.52516 0.0145015 0.998676
TSPAN13 0.525032 0.0145297 0.998676
LRRC14 0.52489 0.0145614 0.998676
COQ7 -0.524617 0.0146218 0.998676
SSH1 0.522947 0.0149974 0.998676
HCG18 0.522456 0.0151093 0.998676
SPRY2 0.522131 0.0151835 0.998676
FLJ32255 0.522054 0.0152013 0.998676
Gene Symbol r p-value(correlation) (p-value(correlation)) q-value
ZNF333 0.521103 0.015421 0.998676
NOXO1 -0.520038 0.0156698 0.998676
APOBR -0.51957 0.0157804 0.998676
CLDN19 -0.518641 0.0160014 0.998676
DPY19L2P2 0.518625 0.0160051 0.998676
NFKBIL1 0.518414 0.0160558 0.998676
NFKBIL1 0.518414 0.0160558 0.998676
NFKBIL1 0.518414 0.0160558 0.998676
NFKBIL1 0.518414 0.0160558 0.998676
NOC4L 0.518357 0.0160695 0.998676
EHD2 0.518272 0.0160898 0.998676
ZNF324 -0.517947 0.0161682 0.998676
OTTHUMG00000163965 0.517893 0.0161813 0.998676
ETFA -0.517646 0.0162409 0.998676
ALPK1 -0.516804 0.016446 0.998676
LOC391322 -0.51664 0.0164861 0.998676
SNRPN 0.516284 0.0165735 0.998676
MIB2 0.516256 0.0165804 0.998676
MIR4638 0.516066 0.0166272 0.998676
H2AFV 0.515976 0.0166495 0.998676
DNAJC3-AS1 -0.515747 0.0167062 0.998676
PET112 0.515656 0.0167287 0.998676
TRIO 0.515502 0.0167669 0.998676
ZNF497 0.515466 0.0167758 0.998676
YPEL1 0.515042 0.0168815 0.998676
LOXHD1 0.51479 0.0169446 0.998676
RFWD3 0.514526 0.0170109 0.998676
CLEC4F -0.514315 0.017064 0.998676
SHISA8 0.513876 0.017175 0.998676
SPCS1 -0.513446 0.0172841 0.998676
RBCK1 0.51305 0.0173851 0.998676
PDE9A -0.512582 0.0175052 0.998676
ARPC5L 0.512069 0.0176376 0.998676
GAGE12C 0.511723 0.0177275 0.998676
GAGE12C 0.511723 0.0177275 0.998676
GAGE12C 0.511723 0.0177275 0.998676
THAP4 -0.51106 0.0179003 0.998676
TRIM41 0.510227 0.0181197 0.998676
LOC100128002 0.509662 0.0182696 0.998676
AASDHPPT -0.50953 0.0183046 0.998676
CLASRP 0.509434 0.0183303 0.998676
SRGAP2-AS1 -0.509048 0.0184336 0.998676
ANKRD18A 0.509038 0.0184364 0.998676
Gene Symbol r p-value(correlation) (p-value(correlation)) q-value
PTEN -0.508394 0.0186096 0.998676
SPAG9 -0.508259 0.0186462 0.998676
COL18A1-AS1 0.507847 0.018758 0.998676
CPT1A 0.507598 0.0188256 0.998676
AGBL2 0.507128 0.0189544 0.998676
SNORD11 0.50648 0.0191326 0.998676
LOC389332 0.506412 0.0191516 0.998676
LOC148696 0.506354 0.0191675 0.998676
MIR1301 0.506333 0.0191732 0.998676
ZNF429 0.506241 0.0191989 0.998676
RNU12 0.506225 0.0192033 0.998676
ZMYM6 -0.506101 0.0192376 0.998676
OTTHUMG00000169787 0.505957 0.0192775 0.998676
ZNF619 0.505938 0.0192829 0.998676
PTPRN -0.505818 0.0193164 0.998676
PRAMEF16 -0.505272 0.0194688 0.998676
ANXA2P2 -0.505249 0.0194752 0.998676
ZNF542 -0.505129 0.0195089 0.998676
LACTB -0.5051 0.0195171 0.998676
TBCD 0.504803 0.0196005 0.998676
MAK -0.50474 0.0196184 0.998676
DNMT1 0.504555 0.0196706 0.998676
PYGB -0.50434 0.0197314 0.998676
SNORD116-27 0.504093 0.0198014 0.998676
KLHL28 0.503986 0.0198317 0.998676
ANKRA2 -0.503644 0.0199292 0.998676
GTF2A1 -0.503614 0.0199379 0.998676
CBWD1 -0.503549 0.0199565 0.998676
HNRNPC -0.502893 0.0201446 0.998676
COBLL1 0.502876 0.0201496 0.998676
COL4A3BP -0.502837 0.0201608 0.998676
KCND3 0.502822 0.0201651 0.998676
RNA5SP70 -0.502357 0.0202993 0.998676
RPS11 -0.502225 0.0203378 0.998676
GZMA 0.502083 0.0203788 0.998676
IGSF8 0.501977 0.0204097 0.998676
UBE2R2 -0.501975 0.0204104 0.998676
KATNAL2 0.501888 0.0204356 0.998676
AAMP -0.501787 0.0204652 0.998676
SUFU 0.501748 0.0204764 0.998676
C9orf169 0.501411 0.0205749 0.998676
WASH4P 0.501288 0.0206111 0.998676
USP28 0.500548 0.0208288 0.998676
Gene Symbol r p-value(correlation) (p-value(correlation)) q-value
OTTHUMG00000172076 -0.500295 0.0209038 0.998676
UBTD1 -0.499976 0.0209987 0.998676
LOC100129034 -0.499872 0.0210297 0.998676
CHTOP -0.499801 0.0210507 0.998676
MIR3918 0.499648 0.0210965 0.998676
APOL2 0.499418 0.0211652 0.998676
LOC100303749 -0.499238 0.0212193 0.998676
ZMIZ2 0.498689 0.0213844 0.998676
SLFN13 0.498522 0.0214352 0.998676
RABL6 0.498273 0.0215106 0.998676
MIR4640 0.498056 0.0215765 0.998676
HOMER1 0.498012 0.0215899 0.998676
OTTHUMG00000164332 0.497461 0.021758 0.998676
UST 0.497066 0.0218792 0.998676
KIF13B 0.496993 0.0219017 0.998676
KIN -0.496715 0.0219874 0.998676
DDC -0.496499 0.0220543 0.998676
PHPT1 -0.496328 0.0221072 0.998676
WDR83OS -0.49627 0.0221253 0.998676
MIR4772 0.49616 0.0221593 0.998676
SLC3A2 -0.495778 0.0222784 0.998676
LACE1 0.495758 0.0222845 0.998676
ID4 0.495733 0.0222924 0.998676
TMEM186 -0.495448 0.0223815 0.998676
LOC650368 0.495383 0.022402 0.998676
LOC100506191 -0.495174 0.0224674 0.998676
BAIAP2 0.494964 0.0225337 0.998676
TXLNG 0.494676 0.0226245 0.998676
ANKRD11 0.49404 0.0228259 0.998676
ZBTB40-IT1 0.493488 0.0230023 0.998676
RABAC1 -0.493191 0.0230976 0.998676
PAQR4 0.493114 0.0231223 0.998676
OTTHUMG00000166666 -0.492845 0.0232089 0.998676
IREB2 0.492636 0.0232763 0.998676
C6orf48 -0.492511 0.0233166 0.998676
OTTHUMG00000173008 0.492201 0.0234171 0.998676
LOC389641 -0.492012 0.0234787 0.998676
DBH 0.49171 0.023577 0.998676
RNU7-77P 0.491589 0.0236167 0.998676
UBE2J2 0.491436 0.0236666 0.998676
U2AF1 -0.4914 0.0236784 0.998676
SCARNA5 0.491387 0.0236827 0.998676
CELSR2 -0.491369 0.0236887 0.998676
Gene Symbol r p-value(correlation) (p-value(correlation)) q-value
TMEM167B -0.490876 0.0238507 0.998676
SMYD4 0.490331 0.0240307 0.998676
CXorf21 -0.490177 0.0240817 0.998676
C16orf3 0.490114 0.0241027 0.998676
DOC2A 0.489805 0.0242057 0.998676
IGLC1 -0.489766 0.0242186 0.998676
ZNF789 0.489712 0.0242366 0.998676
SEC22A 0.489664 0.0242525 0.998676
ALKBH4 0.489417 0.0243353 0.998676
GAGE12H 0.489404 0.0243395 0.998676
RNF112 0.489234 0.0243967 0.998676
ZNF727 0.488874 0.0245177 0.998676
EIF3K -0.488838 0.0245296 0.998676
OTTHUMG00000014331 0.488221 0.0247383 0.998676
ALYREF -0.488087 0.0247836 0.998676
SLC16A8 0.487996 0.0248146 0.998676
CYP4V2 -0.48774 0.0249017 0.998676
MIR3118-4 -0.487713 0.0249112 0.998676
MIR3118-4 -0.487713 0.0249112 0.998676
CYB561D2 -0.487437 0.0250053 0.998676
WAC -0.487407 0.0250157 0.998676
MBD3 0.487359 0.025032 0.998676
ATF5 -0.487334 0.0250407 0.998676
PRKCI -0.486949 0.0251729 0.998676
SH3BP2 0.486919 0.0251832 0.998676
SCUBE1 0.486742 0.025244 0.998676
MIR877 0.486547 0.0253112 0.998676
MIR877 0.486547 0.0253112 0.998676
MIR877 0.486547 0.0253112 0.998676
MIR877 0.486547 0.0253112 0.998676
MIR877 0.486547 0.0253112 0.998676
MIR877 0.486547 0.0253112 0.998676
SZT2 0.486172 0.0254413 0.998676
SLC6A1 0.486166 0.0254433 0.998676
SLC15A4 -0.48616 0.0254454 0.998676
TARS2 -0.486115 0.0254608 0.998676
SLC2A6 0.485799 0.0255706 0.998676
MIR499A 0.485514 0.0256701 0.998676
SERINC2 -0.485255 0.0257607 0.998676
SNORD51 0.485253 0.0257614 0.998676
PRDX6 -0.484686 0.0259606 0.998676
OTTHUMG00000159435 -0.484032 0.026192 0.998676
MIR877 0.483677 0.0263181 0.998676
Gene Symbol r p-value(correlation) (p-value(correlation)) q-value
PARP12 0.483235 0.0264763 0.998676
TMEM167A -0.482719 0.0266615 0.998676
ITPR1-AS1 0.482605 0.0267023 0.998676
RNPC3 -0.482382 0.0267831 0.998676
ZNF438 -0.482319 0.0268059 0.998676
ZNF658 -0.482254 0.0268293 0.998676
TBCE 0.481943 0.0269418 0.998676
MAST4 -0.481864 0.0269705 0.998676
OTTHUMG00000163653 -0.481795 0.0269958 0.998676
GHRL -0.481542 0.0270879 0.998676
NACA2 0.481351 0.0271573 0.998676
ZNF600 0.480607 0.0274303 0.998676
SNORD58A 0.480351 0.0275246 0.998676
MIR4534 0.480095 0.0276192 0.998676
GCA -0.480027 0.0276445 0.998676
FDX1L -0.479694 0.027768 0.998676
GSTP1 -0.479646 0.0277858 0.998676
FICD 0.479484 0.0278463 0.998676
RP5-905G11.4 0.479206 0.0279499 0.998676
SMAD4 -0.479197 0.0279533 0.998676
HPS4 0.479085 0.0279951 0.998676
ORAI2 0.478971 0.0280378 0.998676
ATAD5 0.4789 0.0280643 0.998676
KCNJ2 -0.478818 0.0280954 0.998676
LOC100506748 -0.478539 0.0282002 0.998676
ITGAV -0.478182 0.0283347 0.998676
DNAH1 0.47806 0.0283808 0.998676
NDST1 -0.477936 0.0284278 0.998676
SETD1A 0.477584 0.0285612 0.998676
OTTHUMG00000171045 -0.477191 0.0287109 0.998676
CRB3 0.476978 0.0287922 0.998676
FLJ31306 -0.476887 0.0288272 0.998676
ANAPC15 -0.476785 0.0288663 0.998676
RNF166 0.4764 0.0290143 0.998676
OTTHUMG00000167737 0.476368 0.0290265 0.998676
ZNF823 0.476358 0.0290302 0.998676
ATAT1 0.476098 0.0291307 0.998676
TMEM143 0.475909 0.0292036 0.998676
CMTM6 -0.475771 0.0292569 0.998676
TRIM4 -0.475651 0.0293034 0.998676
LOC151171 0.475339 0.029425 0.998676
TLR2 -0.475309 0.0294365 0.998676
LGR6 0.474675 0.029684 0.998676
Gene Symbol r p-value(correlation) (p-value(correlation)) q-value
FLJ45248 0.474397 0.0297932 0.998676
HSD3B7 0.474326 0.0298211 0.998676
OTTHUMG00000017561 -0.474292 0.0298346 0.998676
ZNF587 -0.47377 0.0300406 0.998676
AP3B1 -0.473711 0.0300638 0.998676
TMEM65 -0.473498 0.0301483 0.998676
GAPDH -0.473452 0.0301666 0.998676
OTTHUMG00000150919 -0.473448 0.0301682 0.998676
OTTHUMG00000171652 -0.473387 0.0301921 0.998676
WBSCR27 -0.473329 0.0302152 0.998676
OR4C46 0.473321 0.0302187 0.998676
KLHL26 -0.473252 0.0302461 0.998676
LINGO2 0.472944 0.0303687 0.998676
FGF19 -0.472754 0.0304445 0.998676
OTTHUMG00000171137 -0.472193 0.0306697 0.998676
OR10AD1 -0.472177 0.030676 0.998676
MRPL15 -0.472148 0.0306877 0.998676
SRSF2 -0.472062 0.0307221 0.998676
RAMP2-AS1 0.471953 0.0307663 0.998676
C16orf98 0.47176 0.0308439 0.998676
OTTHUMG00000172206 -0.47173 0.030856 0.998676
C11orf58 0.471534 0.0309355 0.998676
LHX3 -0.471273 0.031041 0.998676
LOC730268 0.471212 0.0310659 0.998676
AACSP1 0.471184 0.0310775 0.998676
SNORA11 0.471131 0.0310988 0.998676
ZNF584 -0.471122 0.0311025 0.998676
SLC16A11 -0.471044 0.0311343 0.998676
SRP14-AS1 0.471043 0.0311345 0.998676
MIR211 -0.470923 0.0311835 0.998676
AMICA1 -0.470833 0.03122 0.998676
YJEFN3 0.469966 0.0315753 0.998676
MNAT1 -0.469827 0.0316326 0.998676
STXBP3 -0.469762 0.0316595 0.998676
RASA4 -0.469716 0.0316782 0.998676
C14orf166B 0.469689 0.0316895 0.998676
ADA 0.469303 0.0318489 0.998676
RPS6KA2 -0.468801 0.0320576 0.998676
RPL13 -0.468691 0.0321035 0.998676
DLX1 0.468626 0.0321305 0.998676
LOC100129534 -0.468604 0.0321398 0.998676
TREX1 -0.468374 0.0322359 0.998676
SIGLEC9 -0.468355 0.0322436 0.998676
Gene Symbol r p-value(correlation) (p-value(correlation)) q-value
DENND1A 0.468179 0.0323173 0.998676
RCOR3 -0.468096 0.0323523 0.998676
SLC25A3 -0.467629 0.0325484 0.998676
PNO1 -0.467328 0.0326755 0.998676
ZNF207 -0.467201 0.0327291 0.998676
SCXA -0.466911 0.0328522 0.998676
METTL6 -0.46689 0.0328609 0.998676
OTTHUMG00000033267 0.466824 0.0328892 0.998676
LRRC45 0.466805 0.0328973 0.998676
PCGF3 -0.466794 0.0329018 0.998676
TMEM191A -0.466746 0.032922 0.998676
SIGLEC16 0.466375 0.0330801 0.998676
IGHV4-61 0.466268 0.0331258 0.998676
NSMCE4A 0.466117 0.0331905 0.998676
FCGR1C -0.465715 0.0333628 0.998676
NAIF1 0.465524 0.0334448 0.998676
HS2ST1 -0.465436 0.033483 0.998676
EDEM3 -0.465241 0.0335671 0.998676
DUSP15 0.46492 0.0337057 0.998676
POLM -0.464886 0.0337203 0.998676
CDK2AP2 -0.464792 0.0337612 0.998676
TMEM201 0.464783 0.033765 0.998676
HLA-DRA -0.46469 0.0338057 0.998676
PROC 0.46462 0.0338357 0.998676
SNORD82 0.464579 0.0338539 0.998676
H3F3B -0.46452 0.0338793 0.998676
FAM86C1 -0.46451 0.0338835 0.998676
LINC00523 -0.464414 0.0339253 0.998676
SNORD59A 0.46435 0.0339534 0.998676
OR8U1 -0.464299 0.0339755 0.998676
OTTHUMG00000157083 -0.464273 0.0339867 0.998676
KIFC1 0.464146 0.0340422 0.998676
GCHFR 0.46393 0.0341368 0.998676
TBX15 -0.463899 0.0341504 0.998676
NDUFAF3 -0.463839 0.0341767 0.998676
OR10G9 -0.463695 0.0342394 0.998676
FKBPL 0.463683 0.0342448 0.998676
CRYBB1 0.463605 0.034279 0.998676
TM4SF19 0.463562 0.0342979 0.998676
C21orf90 0.46353 0.0343119 0.998676
POMC 0.462585 0.0347289 0.998676
ISM1 0.462411 0.0348061 0.998676
OTTHUMG00000180685 -0.462387 0.0348167 0.998676
Gene Symbol r p-value(correlation) (p-value(correlation)) q-value
MLLT10 -0.461977 0.0349996 0.998676
OTTHUMG00000150809 0.461539 0.0351952 0.998676
LINC00894 0.46143 0.035244 0.998676
RNF185-AS1 0.461085 0.0353989 0.998676
PGCP1 0.461001 0.0354369 0.998676
LRRC7 -0.460868 0.035497 0.998676
RASA4 -0.460719 0.0355643 0.998676
THOP1 0.460574 0.0356296 0.998676
GZMK 0.460505 0.0356609 0.998676
ANGPT4 0.460435 0.0356924 0.998676
KAT6A -0.460127 0.0358324 0.998676
KNDC1 0.459717 0.036019 0.998676
CENPJ -0.459591 0.0360765 0.998676
FAM98A 0.45955 0.0360951 0.998676
C19orf73 0.459356 0.0361839 0.998676
TSHZ1 0.459314 0.0362032 0.998676
FPR2 -0.459272 0.0362224 0.998676
TARDBP -0.459215 0.0362486 0.998676
MGC16025 -0.459185 0.0362623 0.998676
ZNF837 -0.458741 0.0364664 0.998676
SUGP2 0.458342 0.0366505 0.998676
PGM3 0.458199 0.0367165 0.998676
NFKBIL1 0.457919 0.0368467 0.998676
PRSS27 0.457914 0.0368488 0.998676
MLC1 0.457859 0.0368743 0.998676
SLC2A8 0.457799 0.0369022 0.998676
TRAV8-1 -0.457476 0.0370527 0.998676
SUN5 0.457376 0.0370992 0.998676
GNPDA1 0.457323 0.0371241 0.998676
SMG1P1 0.457109 0.0372241 0.998676
GLTSCR1L -0.45705 0.0372519 0.998676
GAGE12G 0.456877 0.0373329 0.998676
ZNF583 0.456833 0.0373538 0.998676
SMARCD1 0.456748 0.0373933 0.998676
GAGE12G 0.456659 0.0374354 0.998676
BBS4 0.456166 0.0376677 0.998676
C7orf60 -0.456061 0.0377174 0.998676
TANC2 0.455839 0.0378226 0.998676
MIR597 0.455748 0.0378654 0.998676
IFNG 0.455591 0.0379403 0.998676
HERC6 0.455547 0.0379611 0.998676
EXT1 -0.455381 0.0380401 0.998676
OTTHUMG00000013217 0.45523 0.038112 0.998676
Gene Symbol r p-value(correlation) (p-value(correlation)) q-value
RNA5SP405 -0.455031 0.038207 0.998676
HNRNPH1 -0.454911 0.0382641 0.998676
SLIT3 -0.454879 0.0382797 0.998676
OTTHUMG00000017546 0.454661 0.0383838 0.998676
LOC100505613 0.45451 0.0384563 0.998676
RNA5SP431 -0.454351 0.038533 0.998676
OTTHUMG00000021064 -0.454066 0.0386699 0.998676
OTTHUMG00000021064 -0.454066 0.0386699 0.998676
PPP1R16B 0.45405 0.038678 0.998676
C19orf66 0.45398 0.0387118 0.998676
PPP1R12B 0.453951 0.0387255 0.998676
MIR3198-1 -0.453894 0.0387532 0.998676
FAM3C -0.453835 0.0387818 0.998676
C9orf141 0.453727 0.0388339 0.998676
IGHJ1 0.453674 0.0388593 0.998676
ZNF561 0.453583 0.0389035 0.998676
LOC100129361 -0.453549 0.0389201 0.998676
HCAR2 -0.453541 0.0389238 0.998676
PVRL1 0.453479 0.0389539 0.998676
OTTHUMG00000152568 -0.453148 0.039115 0.998676
PCBD2 0.452987 0.0391931 0.998676
GPR75 -0.452953 0.0392099 0.998676
LINC00657 -0.452595 0.0393847 0.998676
CYB5D2 0.45237 0.0394946 0.998676
MFAP3 0.45231 0.0395243 0.998676
AXIN1 0.45223 0.0395635 0.998676
STARD10 -0.452178 0.0395892 0.998676
FKBP9 -0.451846 0.0397521 0.998676
C15orf41 0.451799 0.0397753 0.998676
CERCAM 0.451432 0.0399567 0.998676
ADM5 0.451407 0.0399689 0.998676
ALDOA -0.451401 0.0399722 0.998676
LOC554174 0.451056 0.040143 0.998676
VAPA -0.450984 0.0401787 0.998676
COPRS 0.450972 0.0401847 0.998676
LOC283731 0.450685 0.0403275 0.998676
SNORD101 0.450556 0.040392 0.998676
KPNA5 -0.450388 0.0404759 0.998676
LMAN2 -0.450333 0.0405032 0.998676
EXOSC9 -0.45021 0.040565 0.998676
C1orf74 -0.450202 0.0405686 0.998676
TYROBP -0.45018 0.0405797 0.998676
KIAA1324 -0.450097 0.0406216 0.998676
Gene Symbol r p-value(correlation) (p-value(correlation)) q-value
TRAPPC10 0.449757 0.0407919 0.998676
DOM3Z 0.449683 0.0408293 0.998676
IL2RB 0.449547 0.0408976 0.998676
YTHDF1 -0.449341 0.0410017 0.998676
HINT3 -0.449217 0.0410642 0.998676
ZNF518A -0.449163 0.0410915 0.998676
TAF9B -0.449114 0.0411165 0.998676
EIF2B4 0.448946 0.0412011 0.998676
ATP6V0E2-AS1 0.448659 0.0413467 0.998676
AAGAB 0.448647 0.0413528 0.998676
KLHL6-AS1 -0.448214 0.0415733 0.998676
LRRC56 0.448103 0.0416301 0.998676
CCDC162P 0.448059 0.0416525 0.998676
OTTHUMG00000159297 -0.448046 0.0416592 0.998676
CHCHD1 0.447365 0.0420081 0.998676
MAP3K4 0.447327 0.0420279 0.998676
TALDO1 -0.447244 0.0420704 0.998676
RNA5SP113 0.447081 0.0421547 0.998676
OXGR1 0.446357 0.0425293 0.998676
ADCK4 -0.446343 0.0425366 0.998676
MN1 0.446288 0.0425652 0.998676
ASIC3 -0.446219 0.042601 0.998676
MAPK8 -0.446117 0.042654 0.998676
HSD17B11 -0.445905 0.0427643 0.998676
OTTHUMG00000179141 0.445899 0.0427674 0.998676
GOLIM4 0.44586 0.0427879 0.998676
SLC38A6 -0.445817 0.0428102 0.998676
SLC19A1 -0.445721 0.0428606 0.998676
RNA5SP354 0.445547 0.0429517 0.998676
KAT2A 0.445514 0.0429686 0.998676
TSPYL5 0.445501 0.0429755 0.998676
ORMDL3 0.445397 0.0430299 0.998676
LOC100128002 0.445166 0.0431514 0.998676
MOGAT3 0.445137 0.0431664 0.998676
HMGN2 0.445003 0.0432369 0.998676
HP07349 0.444792 0.0433481 0.998676
RPP21 -0.444626 0.0434353 0.998676
TRDV3 0.44448 0.0435124 0.998676
RNA5SP190 -0.444473 0.0435164 0.998676
SIDT2 -0.444368 0.0435722 0.998676
DHDDS -0.444234 0.0436431 0.998676
OTTHUMG00000164913 0.444137 0.0436945 0.998676
TAF2 -0.444081 0.0437241 0.998676