ELECTRON PARAMAGNETIC RESONANCE STUDIES OF SPIN AND MOLECULAR MOTION IN SURFACTANT AGGREGATES
Lauren E. Jarocha
A dissertation submitted to the faculty at the University of North Carolina at Chapel Hill in partial fulfilment of the requirements for a degree of Doctor of Philosophy in the Department of
Chemistry.
Chapel Hill 2014
Approved by:
Malcolm D. E. Forbes Andrew Moran
James Cahoon
ii
iii
ABSTRACT
Lauren E. Jarocha: Electron Paramagnetic Resonance Studies of Spin and Molecular Motion in Surfactant Aggregates
(Under the direction of Malcolm D. E. Forbes)
Steady-state (SSEPR) and time-resolved electron paramagnetic resonance (TREPR)
spectroscopy have been used to examine the dynamic motion and spin wavefunction evolution of
stable nitroxide radicals or photochemically generated radical pairs in aqueous surfactant
aggregates, respectively. Alteration of the surfactant molecular structure has a pronounced effect
on the aggregation behavior and physical properties of surfactant aggregates. The surfactant
systems discussed here are known to form micelles, vesicles, lamellar phases, surfactant
networks, and gels. Both SSEPR and TREPR are sensitive to the nanometer scale confinement of
radicals, making these experimental techniques usefully in monitoring phase changes in caused
by experimental conditions, such as temperature, concentration, equilibration time, molecular
structure, or surfactant mixing. Analysis of the line shape of the EPR spectra of radicals confined
in these supramolecular structures is accomplished through spectral simulations and provides
information on the physical properties of surfactant aggregates, including size, polarity, and
iv
ACKNOWLEDGEMENTS
There are many, many people I owe a debt of gratitude for their support and
encouragement over these last five years. I owe a special thank you to Prof. Malcolm D. E.
Forbes, whose expertise, guidance, humor, and support got me through the last five years and
made this work possible. Dr. Valery F. Tarasov, thank you for all your time, patience, and hard
work on these projects. I always learned something from our scientific discussions, even by
email. Dr. Natalia Lebedeva, thank you for getting me started. Half of what I know about that
TREPR instrument I learned watching you my first year. The other half was soldered, screwed,
wired, or tied back together since then. To the Forbes Group, I wouldn’t have wanted to share an
office with anyone else. I learned so much from having Dr. Dave Zigler and Dr. Robert Schmidt
those first few years. Dr. Renat Khatmullin, Trey, Sam, Alex, and Rufai – thanks for keeping me
on my toes and making the last few interesting. To the undergraduates I had the pleasure of
working with, especially Eva and Shannon, I hope I didn’t torture you too much. I learned a great
deal in the process. I owe Shannon a special thank you for Chapter 5. Soo, I cannot even begin to
tell you how much it meant to me to have someone to struggle with through this last year and
writing. How hard you worked this year put me to shame. Erin, you were the best thesis-buddy a
friend could ask for. To my family, Mom, Dad, Sarah, Michael, and Grandpa J, thank you for all
v
TABLE OF CONTENTS
LIST OF TABLES ix
LIST OF FIGURES x
LISTS OF SCHEMES xv
LIST OF SYMBOLS AND ABBREVIATIONS xvi
CHAPTER 1: Introduction to Electron Paramagnetic Resonance Spectroscopy 1
1.1General Introduction 1
1.2Experimental Overview 3
1.2.1 Electron Paramagnetic Resonance (EPR) 3
1.2.2 Steady-State Electron Paramagnetic Resonance (SSEPR) 8
1.2.3 Time-Resolved Electron Paramagnetic Resonance (TREPR) 14
1.3Chemically Induced Dynamic Electron Spin Polarization (CIDEP) Mechanisms 19
1.3.1 The Triplet Mechanism (TM) 20
1.3.2 The Radical Pair Mechanism (RPM) 25
1.3.3 The Spin-Correlated Radical Pair Mechanism (SCRPM) 30
1.4References 34
CHAPTER 2: The Asymmetry of the Anti-Phase Structure (APS) of Spin-Correlated Radical Pairs (SCRP) 40
2.1 Introduction 40
2.2 Background 43
vi
2.2.2 The Micellized Radical Pair 45
2.2.3 The History and Theoretical Explanations of the APS 53
2.2.4 The Microreactor Model for the Micellized Radical Pair 58
2.3 Results and Discussion 63
2.3.1 Time and Temperature Dependence of the APS 63
2.3.2 Simulations of the TREPR Spectra 71
2.3.1a Spectroscopic Parameters 73
2.3.1b Micelle Parameters 76
2.3.1c Kinetic Parameters 77
2.3.1d Results 78
2.3.3 Spectral Decomposition 81
2.4 Conclusions and Future Directions 90
2.5 Experimental 91
2.6 References 93
CHAPTER 3: Electrostatic and Hydrophobic Effects in the TREPR of Ionic Surfactants 97
3.1 Introduction 97
3.2 Background 98
3.3 Results and Discussion 103
3.3.1 Electrostatic Effects in the TREPR of Ionic Micelles 103
3.3.2 Hydrophobic Effects in the TREPR of Ionic Micelles 113
3.3.3 TREPR of Zwitterionic Surfactants 121
3.3.4 TREPR of Surfactant Monomers in Solution 124
vii
3.4.1 Conclusions 129
3.4.2 Future Directions 130
3.5 Experimental 132
3.6 References 133
CHAPTER 4: EPR studies of Mixed Catanionic Surfactant Systems 138
4.1 Introduction 138
4.2 Background 141
4.2.1 Catanionic Surfactant Mixtures 141
4.2.2 Spin Probe Studies of Micelles and Vesicles 151
4.2.3 TREPR Studies of Micelles and Vesicles 161
4.2.3 The SDS-DTAC Catanionic Surfactant System 162
4.3 Results and Discussion 170
4.3.1 Characterization of the Phase Behavior of Mixtures of SDS-DTAC 170
4.3.2 Synergism in Mixed Micelles of SDS-DTAC 172
4.3.3 SSEPR Spin Probe Studies of Surfactant Aggregate Structure 175
4.3.3a Rotational Correlation Time 175
4.3.3b Solution Equilibrium 187
4.3.4 TREPR Studies of Radical Pair Dynamics in Mixed Micellar Aggregate 195 4.4 Conclusions and Future Directions 199
4.4.1 Conclusions 199
4.4.2 Future Directions 200
4.5 Experimental 202
viii
CHAPTER 5: EPR Investigation of Nonionic Surfactants 213
5.1 Introduction 213
5.2 Background 214
5.2.1 Nonionic Core-Shell Surfactants 214
5.2.2 Triblock Copolymer Surfactants 222
5.2.2a Background 222
5.2.2b Spin Probe Studies of Pluronic micelles 226
5.5.2c Electron Spin Polarization (ESP) of Nitroxides in Supramolecular Systems 229
5.3 Results and Discussion 233
5.3.1 TREPR of Core-Shell Surfactants 233
5.3.2 Spin Trapping of Alkyl Radicals in Micellar Solutions of Core-Shell Surfactants 242
5.3.3 SSEPR of the Thermoresponsive Behavior of Pluronic Surfactants 249
5.3.4 Hydrogen Atom Abstraction Reactions in Pluronic Solutions Studied by TREPR 255
5.3.5 ESP of Nitroxides in solutions of Pluronic Surfactants 260 5.4 Conclusions and Future Directions 264
5.5 Experimental 268
ix
LIST OF TABLES
Table 2.1 Assignments of the energies, spectral shifts, and transition types
for the components of the APS in the CFN and quasi-static models 57
Table 2.2 Structure and hyperfine coupling constants for the SDS and BP radicals 74
Table 2.3 Parameters obtained from the simulation of the TREPR spectra
of the SDS-BP radical pair in micellar solutions of different temperatures 81
Table 3.1 Critical micelle concentration, aggregation number, and size of
some common ionic surfactants 101
Table 3.2 Structure and hyperfine coupling constants for ionic surfactant
and anthraquinone-based radical 105
Table 3.3 Rotational correlation time for four spin probes incorporated into
micellar solutions of SDS, DTAC, and CTAC 120
Table 4.1 Literature values for the physical properties of the hyperfine, area per Head group, and size of the aggregate structure in the SDS-DTAC system at
50 mM total surfactant concentration as a function of mole fraction SDS 165
Table 4.2 Decree of precipitation, effective concentration, mole fraction of SDS in the aggregate, concentration of surfactant in aggregates, concentration of free monomer, and CMCmix for 50 mM solutions of
SDS-DTAC as a function of the mole ratio of SDS in solution 172
Table 4.3 Rotational correlation times obtained from spectral fittings of slow motion SSEPR spectra of spin probes 4-HTB in solutions of 50 mM
SDS-DTAC as a function of χSDS 178
Table 4.4 Rotational correlation times, order parameter, and isotropic hyperfine coupling constant obtained from the MOMD fits of 5-DSA
in solutions of 50 mM SDS-DTAC as a function of χSDS 182
Table 4.5 Rotational correlation times, order parameter, and isotropic
hyperfine coupling constant obtained from the MOMD fits of 5-DSA in solutions of 50 mM SDS-DTAC as a function of χSDS taken 1 month
x
LIST OF FIGURES
Figure 1.1 Energy level diagram of the free electron in a magnetic field 4
Figure 1.2 Energy level diagram for a single hyperfine interaction 6
Figure 1.3 Block diagram of the SSEPR experiment 9
Figure 1.4 Effect of field modulation on line shape in SSEPR 11
Figure 1.5 The relationship between rotational correlation time (τc) and SSEPR line shape 13
Figure 1.6 Block diagram of the TREPR experiment 15
Figure 1.7 Timing sequence for the TREPR experiment 16
Figure 1.8 The Triplet Mechanism 21
Figure 1.9 Energy levels of the radical pair states as a function of inter-radical separation 26
Figure 1.10 Origin of the spectral shape of the RPM 29
Figure 1.11 Origin of the APS of SCRPs 32
Figure 2.1 Asymmetry of the APS 41
Figure 2.2 Stick plot and assignment of EPR transitions for the major surfactant radical product from the photochemical reduction of a triplet sensitizer 48
Figure 2.3 Filling out of the micelle in the supercage model for radical pair diffusion 51
Figure 2.4 Energy level diagram for the spin-correlated radical pair in an applied magnetic field 56
Figure 2.5 Time dependence of the TREPR of the SDS-BP radical pair at 32°C 64
Figure 2.6 Temperature dependence of the TREPR of the SDS-BP radical pair at a delay time of 500 ns 66
xi
Figure 2.8 Temperature Dependence of the TREPR of the SDS-BP radical
pair at a delay time of 150 ns 69
Figure 2.9 Temperature Dependence of the TREPR of the SDS-BP radical
pair at a delay time of 1 μs 72
Figure 2.10 Best fits of the TREPR spectra of the SDS-BP radical pair at 500 ns from the numerical solutions of the SLE using the
microreactor model 80
Figure 2.11 Best fits of the TREPR spectra of the SDS-BP radical pair at 150 ns from the numerical solutions of the SLE using the
microreactor model 82
Figure 2.12 Spectral decomposition of the APS line shape of the SDS-BP
radical pair at 16 °C 86
Figure 2.13 Spectral decomposition of the APS line shape of the SDS-BP
radical pair at 66 °C 88
Figure 3.1 TREPR spectra of DTAC, CTAC, and SDS with AQDS at a
delay time of 500 ns 104
Figure 3.2 Time dependence of the TREPR of DTAC-AQDS 108
Figure 3.3 Time dependence of the TREPR of CTAC-AQDS 110
Figure 3.4 Best fits obtained from the microreactor model for the TREPR
spectrum of SDS-AQDS at a delay time of 500 ns 112
Figure 3.5 TREPR spectra of DTAC, CTAC, and SDS with AQ at a delay
time of 500 ns 114
Figure 3.6 Best fits obtained from the microreactor model for the TREPR
spectrum of CTAC-AQ and SDS-AQ at a delay time of 500 ns 115
Figure 3.7 TREPR spectra of DTAC, CTAC, and SDS with AQS at a delay
time of 500 ns 117
Figure 3.8 Best fit obtained from the microreactor model for the TREPR
spectrum of CTAC-AQS and SDS-AQS at a delay time of 500 ns 118
Figure 3.9 TREPR spectra and microreactor model fits of the TREPR of
Zwittergent 3-12 with AQDS and AQS at a delay time of 500 ns 123
xii
Figure 3.11 TREPR spectra of solutions of SDS and DTAC in 50:50 H2O:CH3CN 128
Figure 4.1 Effect of critical packing parameter on the shape of aggregate
structures in mixed surfactant systems 144
Figure 4.2 Schematic representation of doxyl stearic acid spin probes embedded
in a bilayer illustrating the relevant reference frames for the MOMD model 160
Figure 4.3 Comparison of the published phase diagram of SDS-DTAC from visual observation of solutions and a phase diagram constructed based on steady-state and time-resolved EPR measurements of radical dynamics
in surfactant aggregate structures 169
Figure 4.4 Deviations from ideal behavior as measured by calculations of
the interaction parameter, βint , for 50 mM solutions of SDS-DTAC 173
Figure 4.5 SSEPR of 50 mM solutions of SDS-DTAC with 4-HTB, 16-DSA
and 5-DSA 176
Figure 4.6 SSEPR and MOMD fits for 0.2 mM 5-DSA in solutions of
50 mM SDS-DTAC 181
Figure 4.7 SSEPR of 50 mM solutions of SDS-DTAC at χSDS = 0.4 and 0.6
with spectral fits using the MOMD model 184
Figure 4.8 Concentration dependence of the SSEPR spectra of 5-DSA in
solutions of 50 mM SDS-DTAC at equimolar mixing 188
Figure 4.9 Time dependence of the line shape of the SSEPR spectrum of 50 mM
SDS-DTAC with 0.2 mM 5-DSA at various surfactant mixing ratios 190
Figure 4.10 Time dependence of the line shape of the SSEPR spectrum of 50 mM
SDS-DTAC with 1 mM 5-DSA at various surfactant mixing ratios 192
Figure 4.11 MOMD fits of the SSEPR spectra of 50 mM SDS-DTAC with 1 mM
5-DSA at 30 minutes and 1 month after surfactant mixing 193
Figure 4.12 TREPR of the surfactant-BPd10 radical pair in solutions of 50 mM SDS-DTAC as a function of χSDS collected at a delay time of 500 ns
after 308 nm photolysis 196
Figure 4.13 High field side of the TREPR of the surfactant-BPd10 radical pair in SDS-rich solutions of 50 mM SDS-DTAC as a function of χSDS
collected at a delay time of 500 ns after 308 nm photolysis 197
xiii
Figure 5.2 Simulations of alkyl radical adducts of DBNBS 221
Figure 5.3 Time dependence of the TREPR spectra of 0.05 M Brij 700 with
1 mM BPd10 234
Figure 5.4 Comparison of the TREPR spectra of 0.1 M Brij 35 with AQ,
AQS, and AQDS at a delay time of 500 ns 236
Figure 5.5 Comparison of the TREPR spectra of 0.1 M Brij 35 with neutral
triplet sensitizers AQ and BPd10 at 500 ns delay time 238
Figure 5.6 Comparison of the TREPR of PEO (Mw = 2000 g/mol) with AQDS
in 50:50 H2O:CH3CN to 0.1 M Brij 35 with AQDS or BP sensitizers in
50:50 H2O:CH3CN 240
Figure 5.7 Comparison of the low-field side of the TREPR spectra of micellar solutions of decaethylene glycol monododecyl ether, disrupted Brij 35 in
50:50 H2O:CH3CN, and a simulation of the dodecyl alkyl radical 241
Figure 5.8 SSEPR or the alkyl radical adducts of DBNBS formed during
photolysis of 50 mM solutions of SDS with AQDS or H2O2 244
Figure 5.9 SSEPR or the alkyl radical adducts of DBNBS formed during
photolysis of 50 mM solutions of Brij 35 with AQDS 246
Figure 5.10 SSEPR of the alkyl radical adducts of DBNBS formed during photolysis of 50 mM solutions of Brij 35 with BPd10 in micelle and
disrupted solutions 248
Figure 5.11 Temperature dependence of 10 wt. % solutions of Pluronic 17R4
with TEMPO and 5-DSA between 20 °C-80 °C 250
Figure 5.12 Temperature dependence of the SSEPR of 10 wt. % solutions of L64
and 30 wt. % F68 with 1 mM TEMPO between 20 °C-90 °C 254
Figure 5.13 TREPR solutions of 10 wt. % solutions of Pluronic 17R4 and F65 following photolysis and H-atom abstraction by AQDS at a delay
time of 500 ns 257
Figure 5.14 Comparison of TREPR solutions of 0.2 wt. % 17R4 at 60 °C and
a simulation of the PPO radical 257
Figure 5.15 Temperature dependence of the TREPR spectra of polarized TEMPO in solutions of 2 wt. % Pluronic 17R4 and L64 at a delay
xiv
Figure 5.16 Comparison of the TREPR spectra of polarized TEMPO and the integral of the SSEPR spectra of TEMPO in 2 wt. % solutions of L64
at 20 °C and 60 °C 263
Figure 5.17 Comparison of the TREPR spectrum of 2 wt. % 17R4 at 20 °C
xv
LIST OF SCHEMES
Scheme 2.1 Photochemical generation of a radical pair in a micelle and
resulting radical structures 46
Scheme 3.1 Photochemical generation of the micellized radical pair for a
series of charges surfactants and anthraquinone-based sensitizers 102
Scheme 4.1 Structure of some common spin probes 153
Scheme 5.1 Structures of nonionic surfactants 215
Scheme 5.2 Photochemical H-atom abstraction resulting in a formation of a radical pair in PEO based surfactants and stick plot of PEO radical
transitions 217
xvi
LIST OF ABBREVIATIONS AND SYMBOLS
Chemical Symbols
AQ 9,10-anthraquinone sodium salt
AQDS 9,10-anthraquinone-2,6-disulfonate disodium salt
AQS 9,10-anthraquinone-2-sulfonate sodium salt
AQSH· semi-anthraquinone radical of 9,10-anthraquinone-2-disulfonate sodium salt
BP benzophenone
BPd10 deuterated benzophenone
Brij 35 polyoxyethylene (23) lauryl ether
Brij 97 polyethylene glycol (10) oleyl ether
Brij 700 polyoxyethylene glycol (100) octadecyl ether
CnEm poly(oxyethylene) alkyl ether surfactant
-·CH- secondary radical
-·CH2 primary radical
CH2 methylene group
CH3CN acetonitrile
CH3-N+ methyl-ammonium bond in the DTAC head group
·CH3 methyl radical
Cl– chlorine ion
CTAB cetyltrimethyl ammonium bromide
xvii
DTAC dodecyltrimethylammonium chloride
DBNBS 3,5-dibromo-4-nitrosobenzene sulfonate
D2O deuterium oxide
DSA doxyl stearic acid
DSE doxyl stearic acid methyl esters
DTA+–DS– dodecyltrimethylammonium-dodecyl sulfate ion pair salt
EO ethylene oxide
EOnPOmEOn Pluronic triblock copolymer surfactant
F68 poly(ethylene glycol)-block-poly(propylene glycol)-block-poly(ethylene glycol), EO76PO29EO76
H hydrogen
Hα alpha hydrogens
Hβ beta hydrogens
Hγ gamma hydrogens
H2O water
H2O2 hydrogen peroxide
4-HTB 4-hydroxy-TEMPO-benzoate
KrF krypton fluorine gas mixture for excimer laser operation at 248 nm
L61 poly(ethylene glycol)-block-poly(propylene glycol)-block-poly(ethylene glycol), EO2PO32EO2
L64 poly(ethylene glycol)-block-poly(propylene glycol)-block-poly(ethylene glycol), EO13PO30EO13
Na+ sodium ion
xviii
PEO poly(ethylene oxide)
PEO-PPO-PEO Pluronic triblock copolymer surfactant
PO propylene oxide
PPO poly(propylene oxide)
PPO-PEO-PPO reverse Pluronic triblock copolymer surfactant
SCS sodium cetyl sulfate
SDS Sodium dodecyl sulfate
S–O sulfur oxygen bond in the SDS head group
TEMPO 2,2,6,6-tetramethylpiperidine 1-oxyl
Triton X-100 polyethylene glycol (10) p-(1,1,3,3-tetramethylbutyl)-phenyl ether
Triton X-405 polyethylene glycol (40) p-(1,1,3,3-tetramethylbutyl)-phenyl ether
XeCl xenon chloride gas mixture for excimer laser operation at 308 nm
17R4 poly(propylene glycol)-block-poly(ethylene glycol)-block- poly(propylene glycol), PO14EO24PO14
Greek symbols
α spin wavefunction representing electron spin state ms = ½
α degree of counterion binding
αD Euler angle relating the magnetic frame of a nitroxide to the rotational
frame of reference
β spin wavefunction representing electron spin state ms = -1/2
βD Euler angle relating the magnetic frame of a nitroxide to the rotational
frame of reference
xix
βint interaction parameter in the regular solution theory
γ1 activity coefficient for surfactants 1 in a binary mixture
γ2 activity coefficient for surfactant 2 in a binary mixture
γD Euler angle relating the magnetic frame of a nitroxide to the rotational
frame of reference
ε0 vacuum permittivity
ϵμ eigenvalues of the eigenfunctions of the SCRP, μ is the index for the state
εr dielectric constant of the medium
η viscosity
η 3/2 of the TM polarization
κ Debye screening length
λ exponential decay constant for the exchange interaction as a function of r
Λs reactivity of the singlet state of the SCRP
μ index for identifying members of a radical pair
μel free energy per charge
μex excess free energy per aggregated molecule
μs microsecond
ν frequency
π pi
ρ density of states
σ boundary condition for the micelle in the microreactor model
τagg rotational correlation time for the rotational motion of a surfactant
aggregate structure
xx
τcontact time the radical pair spends in the contact state
τdoxyl rotational correlation time of the doxyl stearic acid spin probe
τfree time the radical pair spends in the free state
τR rotational correlation time of a triplet sensitizer in a micelle
τsp response time of the EPR spectrometer
τ∥ rotational correlation time parallel to the main axis of a molecule with axial symmetry
τ⊥ rotational correlation time perpendicular to the main axis of a molecule with axial symmetry
χ nuclear spin configuration
χSDS mole fraction of SDS
ψ director tilt angle
Ψ set of angles relating the director frame to the laboratory frame in the MOMD model
ψμ eigenfunction of the Hamiltonian of an SCRP, μ is the index for the state
ω0 operating frequency of the EPR spectrometer
ω1 amplitude of the microwave field in frequency units
ωμ Larmor procession frequency of radical, μ is the index for the radical
ΩD set of Euler angles rotating the axes of the magnetic tensor into the
rotational diffusion tensor
Roman Symbols
a area per surfactant head groups
A0 hyperfine coupling constant
xxi
AN isotropic hyperfine coupling constant of a nitroxide
AXX, AYY, AZZ components of the hyperfine tensor along the canonical axes of molecular
symmetry
Å angstrom
A+ splitting between the low field and center field line in a nitroxide SSEPR spectrum
B0 applied static magnetic field
B1 magnetic component of the applied microwave radiation
C concentration
Cagg concentration of surfactant in aggregates
Cs concentration of added salt
Ctotal total concentration of all surfactants in a binary mixture
C1free concentration of monomer surfactant in solution for surfactant 1 in a
binary mixture
C2free concentration of monomer surfactant in solution for surfactant 2 in a
binary mixture
°C degrees centigrade
cal calories
CPP critical packing parameters
CMC1 CMC of surfactant 1 in a binary mixture of surfactants
CMC2 CMC of surfactant 2 in a binary mixture of surfactants
CMCmix the CMC of a binary mixture of surfactants
CW continuous wave irradiation
D mutual diffusion coefficient of the radical pair
xxii
DZFS zero field splitting parameter
E energy of a state
E1 electric field component of the applied microwave radiation
ΔE energy difference between spin states
eel charge of an electro
ESP Electron Spin Polarization
Eq. equation
EZFS zero field splitting parameter
f(t) window function for the microreactor model
g g-factor
G Gauss
ge g-factor of a free electron
GE excess free energy of mixing
GHz gigahertz
h Planck’s constant
H mean curvature at a surface of charge
ℋ Hamiltonian operator
ΔH(+1) peak to peak width of the mI = +1 transition of a nitroxide
h0 zero order expansion term in the expression for μel
h1 first order expansion term for the expression of μel
HE excess free enthalpy of mixing
ℋμ spin Hamiltonian for individual members of a RP, where μ indexes the
radical identity
xxiii
I total nuclear spin quantum number
I(+1) arbitrary intensity of the mI = +1 transition of a nitroxide
I(-1) arbitrary intensity of the mI = +1 transition of a nitroxide
IT, IS intensity of the T or S type components of the APS
Îz spin operator for the nuclear spin angular momentum along the z axis
j dimensionless curvature of surfactant aggregate surface
J exchange interaction
J0 the value of the exchange interaction at the contact distance between two
radicals
Jeff effective exchange interaction in the CFN model
k Boltzmann constant
K Kelvin
kesc rate of radical escape from the micelle
kg rate constant for generation of the SCRP
kμ decay rate of radical, μ is the index for the radical identity
krel rate constant for the relaxation of the electron spin state populations of an
excited triplet state
L radius of the region inside the micelle accessible to radical a in the microreactor model
ℒ̂ Liouville operator
lB Bjerrum length
Lm radius of the micelle in the microreactor model
Lt length of the surfactant tail
m meter
xxiv 3M* triplet excited state of a molecule
mL milliliters
mg milligram
MHz megahertz
mI nuclear magnetic spin quantum number
min minute
mm millimeter
mM millimolar
mol mole
ms spin quantum number of an electron
mT millitesla
M(t) transverse magnetization of the RP
mW milliwatts
Mw molecular weight
N anisotropy of molecular diffusion, N=R∥\R⊥
NA Avogadro’s number
Nagg aggregation number
nm nanometer
ns nanosecond
p population
rμ van der Waals radius of radical, where μ is the index for the radical
R distance of closest approach of the radicals
xxv
R̅ isotropic rotational diffusion tensor
Rμ Bloch relaxation matrix for free radical, where μ is the index for the
radical
Rh hydrodynamic radius
RST regular solution theory
R∥ rotational diffusion tensor element parallel to the molecular axis of symmetry
R⊥ rotational diffusion tensor element perpendicular to the molecular axis of symmetry
s seconds
s dimensionless reduced surface charge density
S total spin quantum number
S0 singlet ground state
S1 first singlet excited state
SE excess entropy of mixing for surfactants
Seff order parameter
ST0 mixing of the S and T0 states
ST– mixing of the S and T– states
Ŝz spin operator for the electron spin angular momentum along the z axis
T temperature
T triplet state
T1 spin lattice relaxation
T2 longitudinal relaxation of the radical
xxvi
T+, T0, and T- the triplet states of a molecule in the laboratory frame using a high field
basis set
q local magnetic field difference, frequency of ST0 mixing between
members of the RP
Q quartet state
Q-band 35 GHz operating microwave frequency for an EPR spectrometer
Vm volume of the micelle
Vt volume of the surfactant tail
wt. % weight percent
x mole fraction of surfactant 1 in solution
X, Y, Z canonical axes of the molecule
X-band 9.5 GHz microwave frequency
xD, yD, zD axes for the director frame in the MOMD model
xL, yL, zL axes for the laboratory reference frame
xM, yM, zM axes for the magnetic tensor of a molecule
xR, yR, zR axes for the rotational diffusion tensor of a molecule
Z frequency of forced radical reencounters
Abbreviations
A absorption
APS antiphase splitting
CAC critical aggregation concentration
CFN Closs, Forbes, Norris model for the spin-correlated radical pair
xxvii
CMC critical micelle concentration
CMT critical micelle temperature
cryo-TEM cryogenic transmission electron microscopic
DC direct current
DLS dynamic light scattering
DVT digital variable temperature controller
E emission
EPR electron paramagnetic resonance
ESEEM electron spin echo envelope modulation
ESPT electron spin polarization transfer
FDA Federal Food and Drug Administration
FT-EPR Fourier transform electron paramagnetic resonance
GaAs fet gallium arsenide field effect transistor
HFC isotropic hyperfine coupling
ID inner diameter
ISC intersystem crossing
MFE magnetic field effect
MO molecular orbital
MOMD microscopic order macroscopic disorder
NMR nuclear magnetic resonance
RP radical pair
RPM Radical Pair Mechanism
xxviii
SANS small angle neutron scattering
SAXS small angle x-ray scattering
SCRP spin-correlated radical pair
SCRPM spin-correlated radical pair mechanism
SLE stochastic Liouville equation
S/N signal to noise ratio
SOC spin orbit coupling
SSEPR steady-state electron paramagnetic resonance
TE transverse electric
TM triplet mechanism
TREPR time-resolved electron paramagnetic resonance
UV ultraviolet
UV-vis ultraviolet/visible spectrometry
1
CHAPTER 1: Introduction to Electron Paramagnetic Resonance Spectroscopy
1.1 General Introduction
Molecular motion and diffusion are of fundamental importance for many chemical
reactions; restricted motion can alter reactions rates or result in different chemical products.
Nanoscale confinement of small organic molecules can be achieved using a wide range of
supramolecular structures, including host-guest complexes,1 nanocrystalline materials,2 and self-aggregating surfactant systems like micelles and vesicles.3 Surfactants aggregates have been particularly promising and heavily employed to study the effects of restricted diffusion on
chemical reactions and molecular interactions because of the diversity of surfactant functions and
physical properties of the resulting aggregates. Surfactants can act as detergents, wetting agents,
emulsifies, foaming agents, or dispersants. The function of a surfactant is explicitly tied to the
structure of both the hydrophobic and hydrophilic portions of the molecule. The shape and size of
supramolecular surfactant aggregates can vary greatly, from disordered micelles to single lamellar
layers or multi-lamellar vesicles. This diversity has led to their use in a wide variety of industrial,
biological, and chemical applications, including household cleaning formulations,4 petroleum clean up,5 gel electrophoresis,6 protein unfolding7 or solubilization,8 “nanoreactors” for control of
chemical reactions or charge separation, 3c, 9 templates for nanostructured materials,10 drug solubilization,11 and targeted drug delivery systems.12
Experimentally, electron paramagnetic resonance (EPR) techniques are particularly
sensitive to the molecular motions of radicals and radical pairs. Because of this sensitivity,
2
spectrum. Radicals created in supramolecular systems such as micelles show anomalies in both
their magnetic resonance spectra and in the observation of magnetic field effects on their transient
optical absorption spectra.13 The links between magnetic resonance spectroscopy, photochemistry and supramolecular chemistry have provided a rich breeding ground for inter-disciplinary research
and for the discovery of many interesting fundamental properties of both free radicals and
surfactant-based supramolecular aggregates, including micelles,14 reverse micelles,15 and vesicles.16
Both steady-state and time-resolved electron paramagnetic resonance (EPR) techniques
have been used extensively to explore the physical properties of surfactant aggregates and the
effects of micellar confinement on the dynamic motion of radicals. Steady-state electron
paramagnetic resonance (SSEPR) spectroscopy has been used to provide valuable information on
microviscocity in micelles,17 ordering of small organic radicals in lamellar phases,18 phase
transitions induced by pH19 or temperature,20 and hydration of the micelle interior.17b, 21 Additional information on radical structure,22 reaction dynamics, 3c, 9, 23 kinetics, 24 and the effects of confinement and intermolecular diffusion in radical reactions25 can be obtained from time-resolved electron paramagnetic resonance (TREPR) spectroscopy, which combines the EPR technique with
laser flash photolysis in order to observe radicals on the sub-microsecond timescale.
This dissertation describes the utilization of direct-detection SSEPR and TREPR in the
study of radicals in supramolecular, surfactant-based structures. The goals of the present chapter
is to provide a description of the SSEPR and TREPR experiment and to briefly outline the origin
3
dynamics in a wide range of surfactant systems that vary by chemical structure, charge, aggregate
structure, and response to environmental stimuli.
1.2 Experimental Overview
1.2.2 Electron Paramagnetic Resonance (EPR)
Since its discovery in 1945 by Zavoisky,27 EPR has been used as the primary technique for identifying and characterizing radical structures. As a magnetic resonance technique, EPR is
directly analogous to nuclear magnetic resonance (NMR) of protons, but the spectral transitions
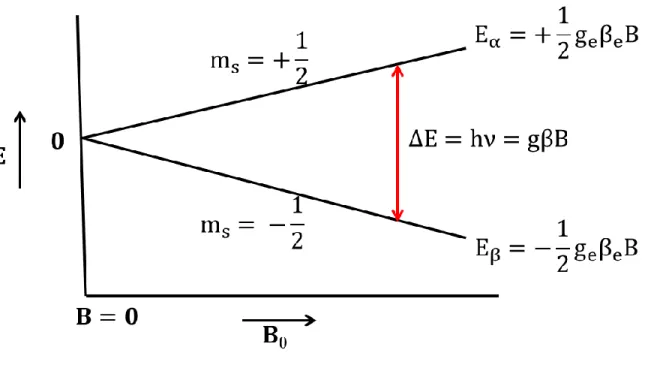
observed in the EPR experiment are between electron spin states.28 The electron has a total spin quantum number of S = 1/2, with two possible spin states that are referred to as α (ms = 1/2) or β
(ms = -1/2). Typically, the energies of the α and β states of an unpaired electron are degenerate.
When there is a strong applied magnetic field, this degeneracy is lifted. The splitting between the
two states is referred to as the electron Zeeman interaction and the energy difference between the
two is:
∆𝐸 = 𝑔𝛽𝑒𝐵0
where g is the g-factor of the electron and can be considered analogous to chemical shift in NMR
experiments, βe is the Bohr magneton, and B0 is the static magnetic field.
In order to observe transitions between these two energy levels, the sample is exposed to
continuous wave (CW) microwave irradiation. In the absence of any additional interactions, the
resonance condition to observe an EPR transition for the unpaired electron occurs when the energy
of the applied microwave radiation matches the splitting due to the Zeeman interaction.
ℎ𝜈 = 𝑔𝛽𝑒𝐵0
Because the frequency of the microwave irradiation is constant (9.5GHz at X-band), the magnetic
(1)
4
Figure 1.1: An energy level diagram showing the separation of the ms= +1/2 and ms= -1/2 spin states of a free electron as a function of the strength of the applied static magnetic field, B
0, due to the Zeeman interaction. An allowed EPR transition is observed when the difference in the energy between the two spin states matches the energy of the CW microwave radiation from the EPR bridge.
5
field strength is swept, and an EPR transition will be observed when the strength of the applied
field causes this resonance condition to be met (Figure 1.1).
Additional splitting of EPR transitions are observed due to interactions between the
electron’s magnetic moment and the magnetic moment of neighboring nuclei. This additional
splitting is referred to as an isotropic hyperfine interaction. The magnitude of the splitting is
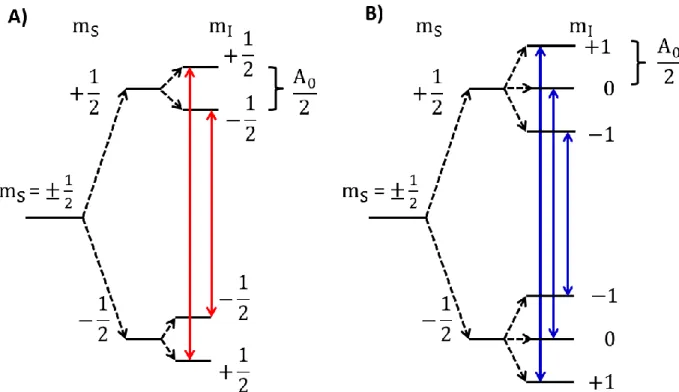
described with a hyperfine coupling constant (A0). In the case of a neighboring hydrogen nucleus,
each electron energy level is split into two – corresponding to the interaction of the unpaired
electron with either mI = 1/2 or mI =-1/2 nucleus. In the case of a neighboring nitrogen nucleus,
the nuclear spin, I, is equal to 1, and the energy levels of the electron are split into three (mI = +1,
0, or -1). The selection rules for the EPR experiment dictate that ΔmS = ±1, ΔmI = 0. The allowed
transitions for these hyperfine interactions are shown in Figure 1.2.
The simplest form of the spin Hamiltonian under consideration for the SSEPR experiments
described here can then be written as:28
ℋ̂ = 𝑔𝛽𝑒𝐵𝑆̂𝑧+ ∑ 𝐴0𝑖Ŝ𝑧Î𝑧𝑖 𝑖
where Ŝ𝑧 and Î𝑧 are the spin operators for the electron and nuclear spin angular momentum along the z axis of the magnetic field. The magnitude of the hyperfine interaction, A0, and the spin of
neighboring nuclei both vary. The summation in the second term allows for the inclusion of
hyperfine interactions from multiple neighboring magnetic nuclei. From this basic Hamiltonian,
structural information about neighboring nuclei that is analogous to the NMR experiment can be
obtained. This spin Hamiltonian can also be modified for systems that have more than one unpaired
electron, and additional interactions, including dipole-dipole interactions and Heisenberg spin
exchange can be included as necessary.
6
Figure 1.2: An energy level diagram showing the effect of a single hyperfine interaction, with a hyperfine coupling constant of A
0, with a hydrogen nucleus (mI = ±1/2; A) or a nitrogen nucleus (mI=0,±1; B) on the splitting of the energy levels and the observed transitions in the EPR experiment. Allowed transitions must obey the selection rules for the experiment, with Δms= ±1 and Δm
7
It is important to note that the equations above treat both g and A0 as constants. This
treatment is only applicable in radicals experiencing very fast rotational motion such that they
behave as if the molecule were magnetically isotropic. In most molecules, the g-factor is
anisotropic and its value depends on the orientation of the radical with respect to the magnetic
field. Both the g-factor and the hyperfine interaction may be accurately represented by 3rd rank
tensors. For the radical to behave as if it is isotropic, the rate of rotation must be greater that the
differences between the largest and smallest components of thee tensors. When the rate of rotation
of the molecules is slow, the anisotropy of the g-factor and hyperfine interaction will affect the
line shape of the EPR spectrum and must be accounted for using these tensors.
The EPR experiment is conducted by exposing a sample containing a paramagnetic species
to continuous wave (CW) microwave irradiation. The sample is placed inside a microwave
resonator that is designed in accordance with solutions to Maxwell’s equations for the operating
frequency of the spectrometer.29 The conventional operating frequency, ω0, for the EPR
experiment is 9.5 GHz (X-band). The microwave irradiation propagates from a source in a
microwave bridge, down a piece of waveguide, and into the resonator cavity. The use of a resonant
cavity allows the microwaves to make multiple passes through the sample, increasing the
probability for absorption. The resonator is placed in between the poles of an electromagnet, which
provides the external magnetic field, B0, typically in the range from 0-6 kG for an X-band
spectrometer. To collect the EPR spectrum, the external magnetic field is swept through each EPR
transition at a constant microwave frequency.30 The instrument detects the reflected microwave power from the resonator cavity at each point in the magnetic field sweep and compares it to a
reference sample diverted directly from the microwave source. After a sample is placed in an EPR
8
changing the microwave source frequency to minimize reflected microwave power at the detector,
2) changing the coupling of the microwaves into the cavity from the waveguide, and 3) matching
the phase of the microwaves from the working arm (cavity) and reference arms. The difference
signal between the microwaves reaching the detector from the working arm and the reference arm
is converted to a DC voltage. When the resonance condition (Eq. 2) is met, changes in the
absorption of microwaves by the sample are detected as changes in the measured DC voltage and
this makes up the EPR signal.
Although the fundamental principles are the same, differences in experimental design make
the SSEPR and TREPR experiments sensitive to different timescales and different types of
dynamic motion.29 SSEPR is employed to study longer lived radical species, with lifetimes greater than 40 µs. It is also particularly sensitive to rotational motion of radicals – which can be affected
by the local environment of the radical species, including temperature, viscosity, or polarity. On
the other hand TREPR experiments involve photochemically generating radicals in situ, and these
radicals are often short lived. At X-band, TREPR experiments are used to detect radical species
between 50 ns to 10 µs after their creation. The TREPR spectrum is also very sensitive to changes
in the radical spin states caused by translational diffusion. The source of these differences and
important principles in their application to surfactant aggregates are discussed in greater detail
below.
1.2.2 Steady-State Electron Paramagnetic Resonance (SSEPR)
A schematic representation of the standard, commercial X-band SSEPR is shown in Figure
1.3. All spectra presented here were recorded on a JEOL FA-100 spectrometer operating at X-
9
Microwave bridge
CPU
sample
magnet
resonator
CW microwave
irradiation
EPR
signal
Microwavesource
100 kHz field
modulation
Modulation
coils
100 kHzsignal detection
10
but a relatively slow instrument response time that limits its use to the detection of long-lived
radical species or systems in which constant generation of short lived radicals allows for the build-
up of a detectable “steady-state” concentration.31 In order to obtain high sensitivity, SSEPR
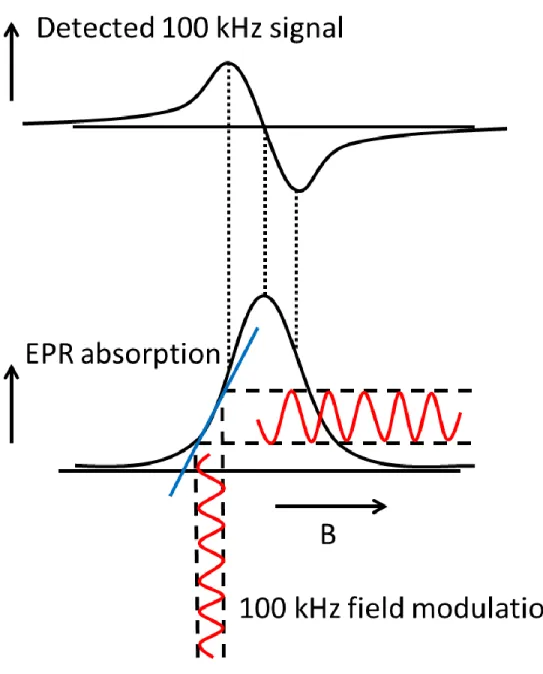
employs phase sensitive detection (Figure 1.4).29 The external magnetic field is modulated as it is swept, usually at a frequency of 100 kHz. A narrow-band amplifier only passes signal with the
same frequency as the modulation frequency of the EPR. Field modulation dramatically increases
the signal to noise (S/N) ratio, but it also gives the resulting spectra a first derivative line shape.
The amplitude of the field modulation must be kept smaller than the line widths of the EPR signals
to avoid line shape distortions, but this limits the time response of the spectrometer, at best, to the
inverse of the modulation frequency. Practically, for good S/N, three or four cycles of modulation
are necessary within the line width of the EPR transition, which means that the SSEPR experiment
is capable of detecting only those radical species that have lifetimes of 40 µs or more.29 Most
organic radicals have lifetimes in solution on the order of 10–100 µs, making their detection by
SSEPR at room temperature problematic.
Another important feature of the SSEPR experiment relevant to the study of surfactant
aggregates is the microwave resonator. Resonators for EPR spectroscopy fall into several
categories depending on sample geometry, size, and dielectric properties,32 but in general the
sample geometry should match the cavity. The JEOL FA-100 uses a cylindrical TE011 resonator
cavity, and the recommended sample geometry is a 4-5 mm quartz EPR tube. The resonator
functions to provide a greater cross-section and, therefore, a greater probability of interaction
between the sample and the CW microwave radiation. The sample is specifically situated inside
the resonator cavity at the maximum of the magnetic component (B1) of the microwave radiation
11
12
are met: 1) the sample has a strong interaction with B1 in order to effect magnetic resonance
transitions, and 2) samples with high dielectric constants, such as aqueous solutions, can be tuned.
The latter is a particularly important point in the study of surfactant solutions, which are often
aqueous. In general, any sample with a dielectric constant higher than 4 at X-band requires the use
of a smaller sample volume in order to reduce any strong, unwanted interaction between the E
field and the sample. Even with good positioning in the center of the EPR cavity, an aqueous
solution in a 4 mm EPR tube will still interact too strongly with the E field of the microwave
radiation, causing the resonator cavity to detune. For all SSEPR measurements described here,
quartz capillaries with an ID of 0.5 mm instead of the standard 4-5 mm quartz EPR tube in order
to reduce this unwanted interaction.
To study radical motion in surfactant aggregates by SSEPR, a stable radical referred to as
a spin probe is often added to a surfactant solution. Information about the spin probe’s g-factor,
isotropic hyperfine coupling constant, and rotational dynamic motion are extracted from the line
shape of the SSEPR spectrum.33 Changes in the spectrum of the spin probe as a function of its environment, including conditions like solvent, temperature, and solubilization in a surfactant
aggregate, are monitored to extract information on the properties of the environment. The line
shape of the SSEPR spectrum is, in fact, very sensitive to changes in the rotational correlation
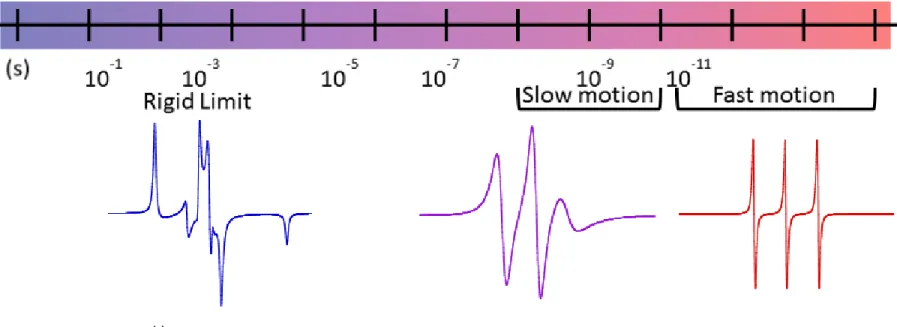
time, τc, of the spin probe. Figure 1.5 demonstrates the significant changes that occur to the spectra
of a nitroxide molecule over several different ranges of dynamic motion. In frozen or highly
viscous solutions, the magnetic properties of the radical, including anisotropy in the g-factor or
hyperfine coupling, can be extracted directly from the position of spectral transitions.28 In the slow motion regime, magnetic parameters are convoluted with dynamic, anisotropic motion to create a
1
13
14
in the magnetic parameters or diffusion is averaged out and appears isotropic.28
1.2.2 Time-Resolved Electron Paramagnetic Resonance (TREPR)
The TREPR experiment is also called "direct detection EPR" or time-resolved (CW) EPR
to distinguish it from pulsed and SSEPR methods. The apparatus and methodology couples laser
flash photolysis to EPR, which was first developed by Trifunac and coworkers,34 and has been widely used. 35 A schematic representation of the TREPR experiment, with all the necessary
components, is shown in Figure 1.6. In addition to an operational EPR spectrometer, the TREPR
experiment requires the following instrumentation: a pulsed laser to initiate radical reactions along
with any required optics to guide the beam into the resonator, a microwave resonator designed for
optical transmission,36 a boxcar signal average or transient digitizer for trapping the EPR signal on the sub-µs time scale, a fast photodiode for observation of the laser pulse, an oscilloscope to
monitor the timing of the experiment, and a pulse delay generator to control the timing of the laser
pulses and fast signal detection.
Radicals are photochemically generated by a laser flash inside the EPR cavity29, 37 and are detected by the voltage difference between two boxcar gates. The timing sequence for the
generation of the radicals and the TREPR signal is depicted in Figure 1.7. The timing sequence is
triggered and controlled by the pulse generator, and the sampling gates from the boxcar are
positioned such that one is in front of the laser flash and one is after the laser flash. Subtraction of
the two gate voltages gives only the light-induced TREPR signal. The gate width is typically
between 100-300 ns, and the position of the gate after the laser flash can be varied from
100ns-10µs in order to investigate any time dependent behavior of the EPR signal, which can be of great
15
16
17
paramagnetic systems. Because the spin wavefunction evolution of radicals and radical pairs can
be drastically altered by restrictions in translational diffusion, collection of TREPR spectra as a
function of delay time has proven important in understanding systems involving confined radical
pairs, including radicals in micelles or on surfaces and flexible biradicals in free solution.38 The TREPR instrument used for the experiments described here is a modified JEOL
spectrometer. The timing sequence is triggered by a Stanford digital delay box outputting TTL
pulses, which triggers both the boxcar average and the laser. A Lambda Physik LPX-100 excimer
laser operating at 308 nm (XeCl) or Compex excimer laser operating at 248 nm (KrF) can be used
at a repetition rate of 60 Hz for laser excitation. The high repetition rate can lead to substantial
heating, sample degradation, and the buildup of secondary photoproducts.39 To avoid these problems, samples are flowed through a quartz flat cell positioned at the center of the rectangular
Varian TE103 microwave cavity using a micropump and Teflon tubing. The geometry of the quartz
cell is chosen to match the geometry of the cavity, but it also maximizes the sample volume
exposed to the laser pulse and simultaneously minimizes the total sample volume in the cavity so
that the instrument can tune samples containing high dielectric solvents.
In addition to the differences from SSEPR mentioned above, the microwave bridge for the
TREPR spectrometer has been altered to give it a faster time response, which is necessary for the
detection of short lived radical species.40 In TREPR, the 100 kHz field modulation is bypassed and the instrument uses a wide bandwidth amplifier with a range of 100 MHz to 0.1 Hz. The EPR
signal from the spectrometer's microwave bridge preamplifier circuit is sampled directly after the
photochemical generation of the radical if interest. The primary advantage to this direct detection
is a vast improvement in the time response of the instrument, which is about 50 ns at X-band and
18
substantially from the SSEPR experiment; in the TREPR spectra, transitions below the baseline
are in emission (E), while those above the baseline are in enhanced absorption (A). This is
different than conventional SSEPR spectra, which, as noted in Figure 1.4, are displayed as first
derivative curves representing the change in detected intensity with the change in the external
magnetic field.
The shorter time response of the instrument and the observation of chemically induced
dynamic electron polarization (CIDEP) make the TREPR experiment sensitive to different radical
motions than SSEPR.29 CIDEP phenomena are observed on the same time scale of typical free radical electron spin relaxation (0.1 to 10 µs) and can result in substantial, non-Boltzmann spin
populations of select energy levels of the radicals. Such overpopulations can also improve the
signal intensity. These gains in signal intensity are typically large enough to make up for any loss
in S/N that was a consequence of performing a direct detection experiment and bypassing the field
modulation of SSEPR.
It’s important to note that CIDEP polarization can be observed in the TREPR spectra
because of quantum coherences as well as selective population of spin states leading to
non-Boltzmann distributions. Observations of both single and double quantum coherences have been
reported in pulsed, FT-EPR experiments.41 As a general rule, CIDEP caused by coherences are not
observed in the X-band TREPR experiment because they are short lived. Hyperfine interactions
will rapidly average out the coherence. An instrument dead time of less than 10 ns is generally
considered necessary to observe coherent oscillations in a direct detection experiment.41a Given that the detection limit of our apparatus is greater than 100ns, the CIDEP observed in the TREPR
of radicals in surfactant aggregates reported here is most likely caused by non-Boltzmann spin
19
CIDEP processes provide insight into the mechanism of the reaction that generated the
radicals, their motional dynamics (both intra– and intermolecular), and other characteristics
regarding the photochemical precursors, such as their spin multiplicity. The nature of these
polarization processes, and the four mechanisms responsible for generating them, are discussed in
greater detail below. In regard to TREPR studies of supramolecular systems, it is important to note
that several polarization mechanisms are sensitive to the translational diffusion of radicals.
Because supramolecular structures can alter translational diffusion, the TREPR experiment can be
sensitive to supramolecular confinement. Like SSEPR, information about this motion can be
extracted from the TREPR line shape. By photochemical generating radical species in surfactant
aggregates and analyzing the resulting CIDEP polarization, it is possible to obtain additional
information about molecular diffusion in these structures that is not available from SSEPR.
1.3 Chemically Induced Electron Spin Polarization (CIDEP) Mechanisms
Allowed transitions in spectroscopy are most often observed as absorptive lines due to the
existence of a Boltzmann distribution that results in greater population in lower energy levels over
higher energy states. CIDEP phenomena are the product of non-equilibrium spin populations,
and can result in both enhanced absorption (greater absorptive signal intensity than predicted by
the Boltzmann factors) and emission. What makes the non–Boltzmann populations observed in
TREPR experiments so unusual is that, in some cases, electron or nuclear spin dependentchemical
reactions are responsible for the polarization process. The observation and description of the
nuclear spin polarization phenomenon (CIDNP) in NMR spectroscopy came first.42 The general idea put forward for CIDNP was that that the nuclear spin state energy level differences, which
20
these early descriptions, four primary CIDEP phenomena were discovered and explained. The
earliest experimental observations43 were of unusual phases of EPR and NMR transitions in
thermal, photolytic, and radiolytic reactions involving free radical intermediates. This lead to a
theoretical description of some of the results that is now known as the Radical Pair Mechanism
(RPM).42e, 44 With time, three additional polarization mechanisms have been added to explain other anomalous experimental results: the Triplet Mechanism (TM), the Radical Triplet Pair Mechanism
(RTPM), and the Spin-Correlated Racial Pair Mechanism (SCRPM). In the following sections, an
outline the basic phenomenon three of the four known CIDEP mechanisms that are relevant to the
investigation of radical pair dynamics in surfactant aggregates are presented and explained in
further detail.
1.3.1 The Triplet Mechanism (TM)
The triplet mechanism (TM) is often considered the simplest CIDEP mechanism.45 A general theory for the TM was developed in detail by Wong et al.,46 Pedersen and Freed,47 and Atkins and Evans.48 A qualitative picture of the mechanism is presented in Figure 1.8. Due to dipolar interactions, the three energy levels of the molecular triplet excited state are not degenerate.
The labels TX, TY and TZ represent the triplet state energy levels in the molecular coordinate
system. A molecule is excited into its first excited singlet state, S1, and intersystem crosses (ISC)
to the triplet state, T. Differences in the spin orbit coupling between the singlet and triplet sublevels
leads to spin selectivity in populating the excited molecular triplet. The excess population of one
molecular triplet state over the others is represented in Figure 1.8 by a thicker line, and this excess
population persists in the laboratory frame where the molecule feels the effects of an external
21
Figure 1.8: The TM of CIDEP. Photoexcitation of an organic molecule from the ground state (S
0) to the first excited singlet state (S
22
the electron spins in the triplet state precursor can ultimately be observed in the free radicals. It is
the polarization of the free radical spin states, and not the molecular triplet state, that is observed
in the TREPR experiment. Experimentally, all of the observed transitions in the TREPR spectrum
are polarized equally and either positively (enhanced absorption, A) or negatively (emission, E)
by the TM. The physical origin of TM polarization is described in greater detail below.
The electron spin triplet states of the most organic molecules have two electrons (spins)
located on different molecular orbitals (MO) because of the Pauli principle. The triplet state is
expected to be three-fold degenerate at zero magnetic field; however, the crystal field, spin-orbit
coupling, electron spin-spin dipolar interaction remove this degeneracy. The difference in energy
between the molecular triplet states is determined by the dipolar spin-spin interaction ("zero field
splitting" or ZFS). The dipole-dipole interaction is particularly sensitive to molecular geometry,
and anisotropic distributions of spins in the molecule are described using the ZFS parameters DZFS
and EZFS. DZFS is the difference in energy between the mS = 0 and the average of the mS = ±1 states,
and EZFS is the difference between the mS = 1 and mS = -1 states.49 The spin Hamiltonian for the
ZFS caused by the spin-spin dipolar interaction between two electrons is written as follows:
𝐻̂𝑍𝐹𝑆= −𝑺̂ ∙ 𝐷̃ ∙ 𝑺̂
Where Ŝ is the total spin Ŝ = Ŝ1+ Ŝ2 and 𝐷̃ is a traceless interaction tensor with the principal values
DXX, DYY, and DZZ. The coordinate axes X, Y, and Z represent the canonical axes to which the tensor
is 𝐷̃ is diagonal (the so–called "canonical" axes):
𝐻̂𝐷 = 𝐷𝑋𝑋∙ 𝑆̂𝑋2+ 𝐷𝑌𝑌∙ 𝑆̂𝑌2 + 𝐷𝑍𝑍∙ 𝑆̂𝑍2 = 𝐷𝑍𝐹𝑆(𝑆̂𝑍2 − 1 3𝑺̂
2) + 𝐸
𝑍𝐹𝑆(𝑆̂𝑋2 − 𝑆̂𝑌2) with
𝐷𝑍𝐹𝑆 =1
2(𝐷𝑋𝑋+ 𝐷𝑌𝑌) − 𝐷𝑧𝑧
(3)
(4)
23
𝐸𝑍𝐹𝑆 = −1
2(𝐷𝑋𝑋− 𝐷𝑌𝑌)
here the dimensionality of the parameters D and E is energy, typically MHz, and the electron spin
operators are considered to be dimensionless.
When the Z-axis is defined as the axis of quantization, the eigenfunctions of this
spin-Hamiltonian are:
|𝑇𝑋⟩ = 1
√2(−|𝛼𝛼⟩ + |𝛽𝛽⟩)
|𝑇𝑌⟩ = 𝑖
√2(|𝛼𝛼⟩ + |𝛽𝛽⟩)
|𝑇𝑍⟩ = 1
√2(|𝛼𝛽⟩ + |𝛽𝛼⟩)
This basis set is referred to as the molecular frame. Just after the intersystem crossing the initial
density matrix of the triplet state is:
𝜌̂(𝑡 = 0) = 𝑝𝑥|𝑇𝑋⟩⟨𝑇𝑋|+𝑝𝑦|𝑇𝑌⟩⟨𝑇𝑌| + 𝑝𝑧|𝑇𝑍⟩⟨𝑇𝑍|
The matrix does not contain any off-diagonal elements, which means the process populating each
triplet state is independent of all the others, and the initial populations after ISC can possess strong
deviations from the Boltzmann distribution. In the presence of an external magnetic field B0, the
spin Hamiltonian of the triplet state can be written as:
𝐻̂ = 𝛽𝑒𝑩0∙ 𝑔̃ ∙ 𝑺̂ + 𝐷𝑍𝐹𝑆(𝑆̂𝑍2− 1 3𝑺̂
2) + 𝐸
𝑍𝐹𝑆(𝑆̂𝑋2− 𝑆̂𝑌2)
Where the Z axis is that directed along the applied magnetic field. The “high-field” basis set is
used to describe the triplet energy levels in the presence of an applied magnetic field, and the basis
functions in Eqs, 7-9 become:
|𝑇+⟩ = |1,1, ⟩ = |𝛼′𝛼′⟩
24
|𝑇0⟩ = |1,0⟩ = 1 √2(|𝛼
′𝛽′⟩ + |𝛽′𝛼′⟩)
|𝑇−⟩ = |1, −1⟩ = |𝛽′𝛽′⟩
where |𝛼′⟩ and |𝛽′⟩ are the ordinary ½ spin wave functions, quantized along B0.
The relationship between the molecular frame and the laboratory frame basis sets is as
follows:
𝑇+ = 1 √2(𝑇𝑋
′− 𝑇 𝑌′) 𝑇0 = 𝑇𝑍′
𝑇−= − 1 √2(𝑇𝑋
′ + 𝑖𝑇 𝑌′) where 𝑇𝑋′, 𝑇
𝑌′, and 𝑇𝑍′ are the molecular frame basis set in Eqs 7-9 when the |𝛼′⟩ and |𝛽′⟩ spin wave functions are used instead of |𝛼⟩ and |𝛽⟩. The transformation between the two basis sets and the
independent populations of the triplet sub-levels suggested in Eq. 10 help to explain the appearance
of the TM in free radicals. For a triplet with its Z–axis directed along the applied magnetic field,
the populations for the laboratory frame can be expressed in terms of the laboratory and molecular
basis functions:
𝑝𝑇+𝑇+ = |⟨𝑇𝑋|𝑇+⟩|2𝑝
𝑥+ |⟨𝑇𝑌|𝑇+⟩|2𝑝𝑦+ |⟨𝑇𝑍|𝑇+⟩|2𝑝𝑧 𝑝𝑇0𝑇0 = |⟨𝑇𝑋|𝑇0⟩|
2𝑝
𝑥+ |⟨𝑇𝑌|𝑇0⟩|2𝑝𝑦+ |⟨𝑇𝑍|𝑇0⟩|2𝑝𝑧 𝑝𝑇−𝑇−= |⟨𝑇𝑋|𝑇−⟩|
2𝑝
𝑥+ |⟨𝑇𝑌|𝑇−⟩|2𝑝𝑦+ |⟨𝑇𝑍|𝑇−⟩|2𝑝𝑧
Because of the transformation between the basis sets, the mixing coefficients are all different.
Therefore, if the initial populations px, py, pz are different, the populations 𝑝𝑇+𝑇+, 𝑝𝑇0𝑇0, and 𝑝𝑇−𝑇− will also be different. The initial spin selectivity of populating the triplet state during ISC is carried
25
all the way through the process and is still conserved when the triplet molecule reacts, dissociates,
or undergoes electron transfer to form radicals. Because of the relationship between the
populations of the T+, T0, and T– and the electron spin states in Eqs. 15-17, the ensuing free radicals
can exhibit an overpopulation in either the α and β state. The sign of the radicals' net polarization
(net E or net A) is dictated by which spin state of the free radicals is polarized and is determined
by the sign of the sum 𝐷𝑍𝐹𝑆∙ 𝐾 + 3𝐸𝑍𝐹𝑆∙ 𝐼 , where 𝐾 = (𝑝𝑥+ 𝑝𝑦− 2𝑝𝑧)/2 and 𝐼 = (𝑝𝑥− 𝑝𝑦)/2. 48
1.3.2 The Radical Pair Mechanism (RPM)
The Radical Pair Mechanism (RPM) was the first theoretical explanation for both CIDEP
and CIDNP phenomena.42e, 44 The generation of RPM polarization depends fundamentally on the interplay between diffusion and spin state mixing in a radical pair (RP).50 Figure 1.9 provides a
physical picture of the origin of this polarization: the energy levels of the T0 triplet state and S
singlet state of the mobile RP in free solution are shown as a function of inter-radical distance.
The energy difference between the two states is proportional to the exchange interaction, J, which
is a complex function of several quantum mechanical terms such as the exchange integral, the
Coulomb integral, and the orbital overlap integral. The exact form of J depends on which
methodology is used for its derivation, but is often expressed as:51 𝐽(𝑟) = 𝐽0𝑒−(𝑟−𝑅)/𝜆
where r is the distance between the radicals, R is the distance of closest approach and is typically
the sum of the van der Waals radii, and λ is an exponential decay constant for the exchange
interaction as a function of r.
The spin Hamiltonian for the isotropic exchange interaction is given by:
26
En
e
rg
y
Inter-radical separation
T
0S
2J
Radical pair separation
Radical pair reencounter
Figure 1.9: The energy levels of the radical pair triplet state (T
0) and singlet state (S) as a function of inter-radical separation. Motion to the right on the energy level diagram represents radical pair separation and increasing inter-radical distance, while motion to the left represents decreasing inter-inter-radical distance ultimately leading to reencounter of the radical pair. The difference in energy between the T