EMERGENCY MEDICAL SERVICES CAPACITY FOR PREHOSPITAL CARE
OF STROKE PATIENTS IN NORTH CAROLINA
Mehul D. Patel
A dissertation submitted to the faculty of the University of North Carolina at Chapel Hill in partial fulfillment of the requirements for the degree of Doctor of Philosophy in the
Department of Epidemiology.
Chapel Hill 2013
Approved by:
Wayne D. Rosamond Jane H. Brice
Kelly R. Evenson Kathryn M. Rose
© 2013 Mehul D. Patel ALL RIGHTS RESERVED
ABSTRACT
MEHUL D. PATEL: Emergency Medical Services Capacity for Prehospital Care of Stroke Patients in North Carolina
(Under the direction of Wayne D. Rosamond)
An acute stroke requires immediate medical attention. Emergency medical services (EMS) can positively impact acute stroke patients through early identification and expedited transport to specialized acute care facilities. However, EMS systems are not equally qualified and prepared to respond to, evaluate, and manage stroke patients in a timely manner.
The aims of this dissertation were twofold. First, the capacity of EMS systems in North Carolina (NC) for prehospital stroke care was assessed. Education of EMS personnel on stroke should continue to be an area of focus, particularly the frequency and content of trainings. Significant progress has been made in prehospital stroke care in NC, specifically with the use of standardized patient care protocols, validated scales and screening tools, destination plans, and advance notification policies. However, improvements in the use of stroke destination plans and communication of stroke screen results remain to be realized. Overall deficiencies in EMS stroke care capacity were observed regardless of system patient volume and population density.
Secondly, prehospital time intervals for EMS responses to patients suspected of having a stroke were evaluated. While national consensus guidelines recommend EMS responds to a stroke patient in 9 minutes and spends no more than 15 minutes at the scene before transport, almost half of suspected stroke events took longer than
iv
recommended in NC in 2009-2010. EMS units that responded with lights and sirens were associated with shorter time intervals, suggesting that a greater sense of urgency leads to expedited responses. Furthermore, EMS systems that included specific
instructions in their stroke protocols to limit scene time were associated with significantly shorter time units spent at the scene with a suspected stroke patient.
ACKNOWLEDGMENTS
I would like to thank my committee members for their generosity with their time and expertise, Dr. Jane Brice, Dr. Kelly Evenson, Dr. Kathy Rose, and Dr. Chirayath Suchindran. I would also like to thank my advisor and mentor Dr. Wayne Rosamond for his guidance and support in my academic pursuits. My training was financially supported by the National Heart, Lung and Blood Institutes cardiovascular disease epidemiology pre-doctoral training grant (T32-HL007055).
I am thankful for the EMS professionals who took the time to participate in the survey. I am grateful to the North Carolina Office of EMS and EMS Performance Improvement Center for supporting my research and allowing me to use their data.
Finally, I would like to extend a special thanks to my friends and family, given and chosen, for their unwavering support and for always providing a reason to set aside work for a minute to enjoy life.
TABLE OF CONTENTS
LIST OF TABLES ... ix
LIST OF FIGURES ... x
LIST OF ABBREVIATIONS ... xi
Chapters I. INTRODUCTION ... 1
II. BACKGROUND AND SIGNIFICANCE ... 3
A. Burden of Stroke ... 3
B. Acute Stroke Care ... 5
C. Role of Emergency Medical Service ... 7
D. Public Health Significance ... 21
III. REVIEW OF THE LITERATURE ... 23
A. Specific Aim 1 – EMS stroke care capacity ... 23
B. Specific Aim 2 – EMS time intervals among stroke patients ... 29
C. Synopsis ... 32
IV. STATEMENT OF SPECIFIC AIMS ... 34
V. METHODS ... 37
B. Study Region and Context ... 38
C. Data Sources and Collection ... 40
D. Data Management and Processing ... 43
E. Statistical Analysis ... 48
VI. RESULTS ... 51
A. Specific Aim 1 – EMS stroke care capacity ... 51
B. Specific Aim 2 – EMS time intervals among stroke patients ... 69
VII.DISCUSSION ... 92
A. Summary of Findings ... 92
B. Dissemination Plan ... 95
C. Public Health Implications ... 95
D. Strengths & Limitations ... 97
E. Future Directions ... 98
F. Conclusions ... 98
APPENDIX A. NC EMS Suspected Stroke Protocol ... 100
APPENDIX B. Summary of Prehospital Stroke Assessment Tools ... 101
APPENDIX C. NC EMS Stroke Destination Plan Template ... 102
APPENDIX D. 2012 NC EMS Stroke Survey Instrument ... 103
APPENDIX E. NC PreMIS Data Elements ... 109
APPENDIX F. Supplementary Tables of Regression Result ... 115
APPENDIX G. NC EMS Stroke Survey Fact Sheet (Draft) ... 124
viii
LIST OF TABLES
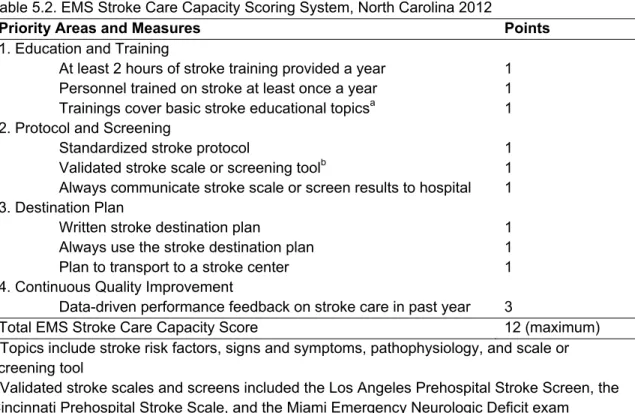
Table 3.1. Previous US reports of EMS time intervals among stroke patients ... 30 Table 5.1. Domains and measures of EMS system capacity for prehospital
stroke management ... 43 Table 5.2. EMS Stroke Care Capacity Scoring System, North Carolina 2012 ... 45 Table 5.3. Comparison of EMS system stroke capacity between current
2012 survey and previous 2001 survey ... 46 Table 6.1. Characteristics of Emergency Medical Services (EMS) Systems
in North Carolina 2012 (N=98) ... 53 Table 6.2. Characteristics of Emergency Medical Services (EMS) Stroke
Care Capacity, North Carolina 2012 (N=98 EMS Systems) ... 54 Table 6.3. Changes in EMS Stroke Care Capacity between 2001 and
2012, North Carolina (N=70 EMS Systems) ... 57 Table 6.4. Individual and Ecological Characteristics of Stroke Events,
2009-2010 (N=19,958) ... 73 Table 6.5. Regression Results for Response Time Intervals (in Minutes)
among Stroke Events, 2009-2010 (N=17,510) ... 74 Table 6.6. Regression Results for Scene Time Intervals (in Minutes)
among Stroke Events, 2009-2010 (N=17,510) ... 76 Table 6.7. Distributions of EMS time intervals by Case Definitions for
Stroke Events in the Prehospital Medical Information System,
North Carolina, 2009-2010 ... 79 Table 6.8. Distribution of Scene Times among Stroke Events by Stroke
Protocol Instructions and Other Covariates, Prehospital Medical
Information System, North Carolina, 2009 (N=9,723) ... 84 Table 6.9. Adjusted Differences in 90th Percentile Scene Time by Case
Definitions of Suspected Stroke Events in the Prehospital
Medical Information System, North Carolina, 2009 ... 87
LIST OF FIGURES
Figure 2.1. Age-adjusted Stroke Death Rates, Adults Ages 35 and Older,
by County, 2000-2004 ... 4 Figure 2.2. Stroke Chain of Survival ... 7 Figure 2.3. Two commonly used prehospital stroke screening tools ... 14 Figure 2.4. Card 28 in the Medical Priority Dispatch Systems (MPDS)
protocol to evaluate stroke ... 18 Figure 5.1. Organizational Structure of EMS in North Carolina, Orange
and Wake Counties ... 38 Figure 6.1. EMS stroke care capacity scores, North Carolina 2012 (N=98) ... 55 Figure 6.2. EMS stroke care capacity scores in categories, overall and by
patient volume and population density, North Carolina 2012
(N=98) ... 56 Figure 6.3. System-specific changes between 2001 and 2012 in select
EMS stroke care capacity measures, North Carolina (N=70) ... 58 Figure 6.4. Frequency histograms of (a) response time and (b) scene time
among stroke events, North Carolina 2009-2010 ... 71 Figure 6.5. Boxplots of (a) response time and (b) scene time by calendar
period among stroke events, North Carolina 2009-2010 ... 72 Figure 6.6. Diagram of Suspected Stroke Events in the Prehospital Medical
Information System, North Carolina, 2009 ... 84 Figure 6.7. Adjusted Differences in Scene Time for Suspected Stroke by
Type of Protocol, Prehospital Medical Information System,
North Carolina, 2009 ... 86
LIST OF ABBREVIATIONS
AHA/ASA American Hearth Association/American Sroke Association ALS Advanced Life Support
APCO Association of Public-Safety Communications Officials BLS Basic Life Support
CDC Centers for Disease Control and Prevention CI confidence interval
CIS Credentialing Information System
Co. county
CPSS Cincinnati Prehospital Stroke Scale CQI Continuous Quality Improvement
CT Computed Tomography
ED Emergency Department
EMD Emergency Medical Dispatch EMS Emergency Medical Services EMT Emergency Medical Technician EMSPIC EMS Performance Improvement Center IQR Interquartile Range
IV Intravenous
LAPSS Los Angeles Prehospital Stroke Screen
min minute
MPDS Medical Priority Dispatch System MRI Magnetic Resonance Imaging
NC North Carolina
xii
NCCEP NC College of Emergency Physicians
NEMSIS National Emergency Medical Information System NHTSA National Highway Traffic Safety Administration OEMS Office of EMS
OMB Office of Management and Budget PreMIS Prehospital Medical Information System PSC Primary Stroke Center
I.
INTRODUCTION
An acute stroke requires immediate medical attention. For every minute an ischemic stroke goes untreated, the typical patient loses an estimated 1.9 million brain cells (Saver 2006). Emergency medical services (EMS) can positively impact acute stroke patients through early identification and expedited transport, thus leading to more timely delivery of treatments, notably thrombolytic therapy (Schwamm et al. 2005). With proper education and resources, EMS personnel are capable of performing screening tests for stroke in the field, initiating patient evaluation, and directly transporting appropriate patients to a specialized stroke center (Kothari et al. 1999b; Kidwell et al. 2000; Gladstone et al. 2009). However, current levels of EMS education and prehospital care practices for stroke patients are not well characterized and vary by region (Brice et al. 2008; Tsai 2008; Greer et al. 2012). Within a state like North Carolina (NC), EMS capacity may further vary by population size and density.
In this dissertation, EMS capacity for the prehospital care of stroke patients in NC was assessed with respect to education and training of EMS personnel, the use of prehospital screening tools, and policies on the management and transport of patients. Given the time urgency of current stroke treatment, American Heart
Association/American Stroke Association (AHA/ASA) guidelines emphasize the completion of prehospital stroke care in the shortest amount of time possible (Acker et al. 2007; Jauch et al. 2013), so prehospital time intervals for EMS responses to patients with stroke were also investigated.
2
1. Assessed current EMS capacity in NC to respond to, evaluate, and manage
stroke patients
a. Evaluated variations in EMS stroke care capacity
b. Estimated changes in EMS stroke care capacity since 2001
2. Identified individual and ecological predictors of EMS time intervals among
stroke patients
a. Evaluated distributions and correlates of EMS time intervals among stroke patients
b. Estimated the association of EMS systems having detailed stroke protocols with minimization of time spent at scene with stroke patients
Stroke is a leading cause of death and disability in the United States (US), and EMS can play an important role in the care and treatment of stroke patients. This work identified areas of EMS stroke care capacity for improvement in NC. Also, the
II.
BACKGROUND AND SIGNIFICANCE
A.
Burden of Stroke
Stroke is the 4th leading cause of death in the US, behind heart disease, cancer, and chronic lower respiratory disease (Miniño et al. 2011). National annual stroke mortality rates declined 34% from 1996 to 2006. The reasons for this decline are still not thoroughly understood but may be linked to a combination of reduced risk factors, particularly from better hypertension management, and improved case fatality, due to better treatment strategies (Luepker et al. 2006; Sturgeon and Folsom 2007).
Nonetheless, stroke remains an important cause of mortality in the US accounting for 134,148 deaths in 2008 (Miniño et al. 2011). Studies of stroke incidence observed higher rates in the elderly, males, and blacks (Roger et al. 2011). While age-adjusted rates of first-ever stroke have been found to be stable over the 1990’s, rates among blacks remained higher than among whites (Kleindorfer et al. 2006b), and although incidence has declined in the most recent decade, this was mostly observed in whites (Kleindorfer et al. 2010).
The state of NC has the 4th highest stroke death rate in the country from 2005-2007 (Roger et al. 2011); in 2006, the overall state rate was 52.4 per 100,000 compared to 43.6 per 100,000 for the entire nation (Huston 2010). NC is in the region of the
most recent “Burden of Cardiovascular Disease in North Carolina” report, stroke led to 4,477 deaths among North Carolinians in 2008 (Huston 2010). Although there were more female stroke deaths, males were more likely to die of stroke at a younger age. Similar to the rest of the US, blacks have higher stroke mortality rates compared to whites, and among blacks, males have higher rates than females. In 2007, there were 28,149 hospital discharges for stroke in NC, and even though age-adjusted
hospitalization rates have declined since 1997, substantial numbers of North Carolinians
Figure 2.1. Age-adjusted Stroke Death Rates, Adults Ages 35 and Older, by County, 2000-2004
continue to be hospitalized for stroke. Similar to stroke mortality, rates of stroke hospitalization are higher among males and in the coastal plain regions of NC.
Long-term disability is also a serious concern in the aftermath of a stroke. A significant proportion of stroke survivors require outpatient rehabilitation, and depending on the severity of the stroke, around 15% to 30% can become permanently disabled and many more experience functional limitations (Asplund et al. 1998). Females have greater post-stroke disability than males. In the Framingham Heart Study, about one-third of female stroke survivors were limited in daily activities (e.g. eating, walking, dressing) 3 to
6 months after stroke, which was almost twice the proportion of men (Petrea et al. 2009). Independent of age and sex, black stroke survivors are more likely to report activity limitations than whites (McGruder et al. 2005). In terms of economic burden, Brown et al. (2006) projected the direct and indirect cost of ischemic stroke in the US to exceed $2 trillion for the period 2005-2050.
In conclusion, stroke-related disability can pose a large burden to individuals, their families, and the healthcare system. Better primary and secondary prevention can significantly reduce the public health and economic burden of stroke. The prevention and control of stroke risk factors and public knowledge of stroke signs and symptoms are critical areas for improvement. Stroke awareness programs inform the general public of the warning signs of stroke and the importance of calling 9-1-1 as soon as symptoms are experienced or witnessed. Acute care of stroke patients is also an important prevention strategy and can significantly impact survival and recovery.
B.
Acute Stroke Care
Considerable advancements in acute care of stroke patients have been made in the last 20 years, notably the approval of thrombolytic therapy (i.e. recombitant tissue plasminogen activator, tPA) for ischemic stroke (National Institute of Neurological Disorders and Stroke: rt-PA Stroke Study Group 1995), which significantly improves patient outcomes when administered in a qualified acute care facility within 3 hours of symptom onset (Marler et al. 2000; Adams et al. 2007; del Zoppo et al. 2009). Therefore, it is imperative acute stroke victims seek medical care as soon as possible and receive diagnostic assessment and medical evaluation in a timely manner. Despite the
availability of an effective evidence-based treatment, very few ischemic stroke patients actually receive thrombolytics (Deng et al. 2006; Kleindorfer et al. 2009), in part due to prehospital delays (del Zoppo et al. 2009). In fact, it has been reported that only 40% of
stroke patients in the US arrive to the hospital or emergency department (ED) within the optimal 2 hours since onset (Lichtman et al. 2009) while a comprehensive review found reports of the percent arriving within 3 hours ranging from 6% to 92% (Evenson et al. 2009).
Medical treatment options for intracerebral and subarachnoid hemorrhages, such as antihypertensive agents and surgical interventions, are not as effective as
thrombolytics are for ischemic strokes (Broderick et al. 2007; Morgenstern et al. 2010); however, hemorrhagic strokes are also serious medical emergencies and require immediate attention. Several acute conditions, such as seizures, migraines, and hypoglycemia, are referred to as “stroke mimics” because they cause neurological symptoms similar to a stroke (Suyama and Crocco 2002). Although these conditions may not be as serious to the patient, it is necessary to rule out a stroke as soon as possible. Regardless of the type of stroke, brain imaging, such as head computed tomography (CT) or magnetic resonance imaging (MRI), is needed to diagnose and to select the best treatment strategy. Furthermore, recent definitions of transient ischemic attack require neuroimaging to determine the risk of further ischemia (Saver and Kidwell 2004). The “Stroke Chain of Survival” (Figure 2.2) summarizes the actions (8 D’s) across the stroke continuum of care that typically need to occur to assure patient survival and recovery (Jauch et al. 2010). Emergency medical services are generally involved with the first 3 D’s: “Detection,” “Dispatch,” and “Delivery.” Treatment strategies will vary based on patient’s condition, care provider’s decision, and facility resources.
Nonetheless, essential emergency stroke care is prompt neurologic examination and brain imaging followed by immediate medical therapy
Figure 2.2. Stroke Chain of Survival
C.
Role of Emergency Medical Service
1. Background on EMS
EMS refers to the provision of out-of-hospital emergency medical care to patients with injuries and acute illnesses. Throughout the world, models of EMS care generally fall under one of the two categories: physician-led and those led by out-of-hospital care professionals such as emergency medical technicians (EMT) and paramedics. The Franco-German model is physician-led, where the doctor is brought to the patient, while the Anglo-American model utilizes specialists like EMTs as the first medical contact (Dick 2003). Traditionally, the latter model’s main purpose is to stabilize and transport the patient as expeditiously as possible to an acute care facility, sometimes referred to as the “scoop and run” approach. On the other hand, the “stay and play” approach of the Franco-German model emphasizes care for the patient by qualified emergency
physicians at the scene or in the home, when appropriate. These different models have led to significant differences in the organization of EMS across countries, and their relative effectiveness has been the subject of much study and debate, especially in the
trauma literature (Spaite et al. 1995). This dissertation focused on the prehospital specialist-based model rather than the physician-led model since the former is the routine in the US.
The development of modern EMS and its systems in the US reached a pivotal point with the passage of the Emergency Medical Services Systems Act of 1973, which increased federal EMS funding and promoted the development of comprehensive regional systems of EMS care. The US Public Health Service Act (Section 1201 (1)) states that an EMS system “provides for the arrangement of personnel, facilities, and equipment for the effective and coordinated delivery in an appropriate geographic area of health care services under emergency conditions (occurring either as a result of the patient's condition or of natural disasters or similar conditions) and which is administered by a public or nonprofit private entity which has the authority and the resources to
provide effective administration of the system." However, the federal funding generally failed to produce lasting EMS systems due to the lack of local interest and provisions (Suburban Emergency Management Project 2005a).
In the 1990’s, the health care system faced changes as hospitals became financially overburdened with an unanticipated increase in trauma patients, many of whom were poor and uninsured (Suburban Emergency Management Project 2005b). In response, Congress appropriated federal funds to reimburse hospitals for
uncompensated costs of trauma care. The Trauma Care Systems Planning and
Development Act of 1990 (Public Law 101-590) required states demonstrate, in order to receive funds, that their trauma care was coordinated between EMS and hospitals as inclusive trauma systems of care. Although many hospitals resisted this designation due to fear of additional burden of uninsured patients, many states encouraged the planning and development of trauma systems and significant progress was made over the decade. Riding this momentum, in 1996, the National Highway Traffic Safety
Administration and the Health Resources and Service Administration jointly developed and produced the “EMS Agenda for the Future” – a milestone document outlining the new vision for EMS in the US. It stated, “This new entity [EMS] will be developed from redistribution of existing health care resources and will be integrated with other health care providers and public health and public safety agencies. It will improve community health and result in more appropriate use of acute health care resources. EMS will serve as the public emergency medical safety net” (NHTSA 1996). To realize this vision, the document proposes ongoing development of 14 essential attributes of EMS, including integration of health services, EMS research, medical direction, communication systems, and evaluation. National, state, and local EMS organizations have taken different steps to achieve this singular vision.
2. EMS in North Carolina
The mission of the NC Office of EMS (OEMS) is to “foster emergency medical systems, trauma systems and credentialed EMS personnel to improve in providing responses to emergencies and disasters which will result in higher quality emergency medical care being delivered to the residents and visitors of North Carolina”. Established in 1973, this agency is funded to oversee and coordinate EMS training standards, credentialing of EMS providers and 9-1-1 dispatchers, and in general developing the components of an EMS system (Pratt 2007). Then in 1999, after the national “EMS Agenda for the Future” was published, new areas, such as EMS research, systems finance, and information systems, were beginning to be addressed. This led to the passing of two landmark EMS bills in 2001: the EMS Act of 1973 Update (House Bill (HB) 452) and the Regulation of EMS Act (HB 453). Becoming law on January 1, 2002, the new legislation required additional structure for EMS in the state. The definition of the “Statewide EMS System” called for the full integration of EMS with other health care
providers and the public health system (HB 452 § 143-507). A key piece in the
legislation placed the responsibility of providing EMS to the public with the county board of commissioners, which established local county-based EMS systems. Each system was required to submit a comprehensive plan for local EMS to the NC OEMS, and all EMS providers and dispatchers within a county must be licensed to operate as part of the county’s EMS system. This resulted in further coordination of the 850 EMS agencies and thousands of personnel providing services and care in NC (Pratt 2007). In 2010, the entire state adopted standard EMS protocols, developed by the NC OEMS and the NC College of Emergency Physicians (NCCEP). The 2009 NCCEP Patient Care Treatment Protocols (see Appendix A for the suspected stroke protocol) were to be implemented starting January 1, 2010. In order to have modified or added to the statewide protocol, the local EMS system must have received approval from the state EMS medical director.
EMS personnel in the US are generally credentialed at one of four levels (from lowest level to highest): first responder, EMT-Basic (EMT-B), EMT-Intermediate (EMT-I), and EMT-Paramedic (EMT-P or “paramedic”). First responders usually arrive first to the scene before other EMS personnel. According to nationally developed curricula
(Margolis 2007), they need to know cardiopulmonary resuscitation, airway management, circulation evaluation, bleeding control, and other basic patient evaluation and
management skills. Basic-level EMTs have more advanced knowledge of medical emergencies and additional skills like the use of automated external defibrillator devices. Intermediate-level EMTs have additional clinical education and can administer certain medications by intravenous (IV) and perform and interpret electrocardiograms (ECG). Paramedics are the highest level of EMS personnel and tend to have more advanced knowledge and experience and are more skilled at procedures, such as endotracheal intubation and IV access. Systems with only first responders or EMT-Bs are considered
to provide basic life support (BLS) services while systems with either EMT-Is or -Ps provide advanced life support (ALS) services.
Local EMS systems in NC are authorized to set education and training requirements for each of these certification levels, though the NC OEMS provides minimum requirements and curricula for initial certification and continuing education. For initial certification, first responders are required at least 69 hours of didactic teaching and skills practice while EMT-Bs, EMT-Is, and paramedics are required more hours of
education (169, 256, and 1,096 hours, respectively). In addition, each certification level requires at least 96 hours of continuing education every 4 years. In regards to 9-1-1 dispatchers, the NC OEMS requires at least 24 hours of education for the emergency medical dispatch (EMD) certification level. A high school or general educational development (GED) education is required for all EMS professions while EMT-Is are required to have post-secondary level reading and writing skills and basic math skills. Moreover, paramedics in NC are required to have taken an anatomy and physiology course. In December 2011, there were 2,038 first responders, 23,877 EMT-Bs, 2,621 EMT-Is, 7,246 paramedics, and 2,160 EMDs for a total of 37,942 certified EMS personnel in NC (EMS Performance Improvement Center 2012a).
3. Prehospital Care of Stroke
EMS has the potential to benefit many acute stroke patients, but numerous studies have reported only about a half (ranging from 39-66%) of acute stroke patients in the US utilized and were transported to the hospital by EMS (Menon et al. 1998;
Rosamond et al. 1998; Kothari et al. 1999a; Porteous et al. 1999; Morris et al. 2000; Schroeder et al. 2000; Wein et al. 2000; Williams et al. 2000; Lacy et al. 2001; Adeoye et al. 2009; George et al. 2009; Rose et al. 2008; Patel et al. 2011), with similar estimates from other parts of the world (Harraf et al. 2002; Koutlas et al. 2004; Li et al. 2005;
Maestroni et al. 2008). EMS transport, compared to private modes (e.g. neighbor’s personal car, taxi), has been shown to have the greatest impact on reducing delays from onset to hospital arrival and delays in hospital evaluation and treatment administration. Not only do patients who initiate contact with EMS arrive faster to the ED or hospital, but they are also evaluated faster while in the hospital (e.g. seen by a physician, received CT scan) (Menon et al. 1998; Rosamond et al. 1998; Kothari et al. 1999a; Wester et al. 1999; Morris et al. 2000; Lacy et al. 2001; Harraf et al. 2002; Bohannon et al. 2003; Katzan et al. 2003; Chang et al. 2004; Rossnagel et al. 2004; John et al. 2005; Centers for Disease Control and Prevention (CDC) 2007; Maestroni et al. 2008; Rose et al. 2008). These studies were conducted in various geographic locations (US, Europe, Asia) and among different stroke patient populations, such as final hospital diagnosis, ED diagnosis, and initial clinical impression. Furthermore, studies accounted for potential confounding by stroke severity in various ways. Nonetheless, these studies found
consistent associations and arrived at similar conclusions.
The destination ED or acute care facility may also receive prenotification of a suspected stroke and mobilize resources (e.g. clear the CT scanner) while the patient is en route (Abdullah et al. 2008; McKinney et al. 2013; Patel et al. 2011). Reduced delays are expected to result in timelier and more frequent administration of tPA. Additional research suggests EMS utilization and prehospital notification increases tPA rates in ischemic stroke patients and reduces the time to treatment (Abdullah et al. 2008; Kim et al. 2009), though most studies have been conducted in populous urban settings.
Moreover, some EMS systems are beginning to implement destination plans that allow EMS responders to bypass local hospitals and directly transport patients to a
comprehensive stroke center where specialized stroke care like the administration of thrombolytic therapy can be provided (Quain et al. 2008; Perez de la Ossa et al. 2009; Gladstone et al. 2009). Further research is needed to demonstrate how these benefits in
delays and access to treatment translate into improvements in patient health, such as survival and functional status.
Besides an emergency 9-1-1 response and ambulance transport to an acute care facility, the prehospital care of stroke patients by EMS personnel (i.e. EMTs,
paramedics) varies between providers and EMS systems (Garrison and Brice 2007). Research has shown that EMS personnel are capable of accurately identifying strokes in the field using validated prehospital stroke assessment tools. There are numerous stroke screening tools that have been developed and field-tested in the US (Smith et al. 1999; Kothari et al. 1999b; Kidwell et al. 2000; LaCombe et al. 2000; Tirschwell et al. 2002; Gordon et al. 2005; Nazliel et al. 2008) and abroad (Harbison et al. 2003; Bray et al. 2005a; Chenkin et al. 2009) (see Appendix B for a summary). All vary in terms of
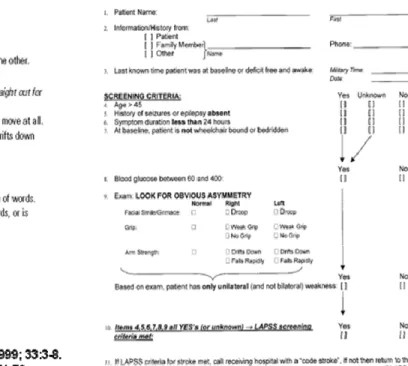
comprehensiveness and diagnostic accuracy, and while some underperformed in certain settings, the use of these scales is generally considered to improve stroke identification by EMS professionals in the field. The Cincinnati Prehospital Stroke Scale (CPSS) and the Los Angeles Prehospital Stroke Screen (LAPSS) are currently recommended for use by EMS providers in the US (Acker et al. 2007) (Figure 2.3).
Figure 2.3. Two commonly used prehospital stroke screening tools
The CPSS was first piloted in 1995 by Kothari and colleagues at the University of Cincinnati as an out-of-hospital stroke diagnosis tool to be used by both physicians and EMS personnel (Kothari et al. 1997). It consists of three physical examination items from the NIH stroke scale found to be most useful in the rapid and accurate identification of stroke patients - facial droop, arm drift, and abnormal speech. A validation study by CPSS creators showed high agreement between EMS and ED physician on all three scale items (Kothari et al. 1999b). Also, they reported high inter-rater reliability between multiple paramedics and EMTs for total score (r=0.89) and each item (r’s=0.78-0.91). Also for prehospital providers, a single abnormality in the CPSS had moderate sensitivity (59%) and high specificity (88%) in the identification of hospital diagnosed strokes. However, recent reports of CPSS sensitivity and specificity vary widely (Bray et al.
2005b; Ramanujam et al. 2008; Frendl et al. 2009; Bergs et al. 2010; Bray et al. 2010), which may be due to differences in the certification levels of EMS personnel, educational interventions, and the populations under study.
The LAPSS was designed and developed in 1997 by researchers at UCLA Medical Center (Kidwell et al. 1998). Based on a physical examination of facial paresis, arm drift, and hand grip strength, a LAPSS positive patient is 45 years or older, has no history of seizures, has symptoms lasting fewer than 24 hours, is not wheelchair bound or bedridden, has a normal blood glucose level (60-240 mg/dL), and a unilateral deficit in at least one of the physical exam items. In a validation of their screening tool, Kidwell et al. (2000) found paramedics identified strokes among patients with relevant neurologic symptoms with a sensitivity of 91% and specificity of 97%, compared to an independent reviewer’s diagnosis using ED charts. In the Houston Paramedic and Emergency Stroke Outcomes (HoPSTO) study, paramedics trained in a modified LAPSS (excluding the age criterion) had similarly high sensitivity and specificity (95% and 98%, respectively)
(Wojner-Alexandrov et al. 2005).
Given that the LAPSS is more comprehensive (e.g. history, blood glucose levels), it is not surprising that it has been found to be less sensitive but more specific than the 3-item CPSS in direct comparisons (Bray et al. 2005a; Bergs et al. 2010). Also, in a relatively small Belgium study, the LAPSS was more accurate than the CPSS (77% vs. 71%) although it was slightly less accurate in a study in Melbourne (80% vs. 84%). This discrepancy could be explained by differences in study population and paramedic training. Nonetheless, the LAPSS generally outperforms the CPSS in diagnostic
accuracy while the CPSS is more favorable in other regards: proven reliability (Kothari et al. 1999b) and ease of use (Kothari et al. 1997; Liferidge et al. 2004; Hurwitz et al. 2005).
Stroke patient care protocols are useful tools and are used by many EMS agencies (Brice et al. 2008; Tsai 2008) (see Appendix A for the NC standardized version). Written instructions state the specific screening tools and additional steps for documenting onset time, measuring blood glucose level, recording cardiac rhythm, determining thrombolytic eligibility, and minimizing on-scene time (Sayre 2002). Since timeliness is critical for these therapies, it is recommended to minimize the time spent at the scene, preferably to less than 10 (Sayre 2002; Millin et al. 2007) or 15 minutes (Acker et al. 2007; Jauch et al. 2013). Further, EMS personnel may be expected to follow a written plan to identify the best hospital destination and to notify the hospital prior to arrival. More advanced prehospital stroke care practices, such as treating
hypoxia or administering neuroprotective agents, have been proposed, but these are not currently supported by evidence (Sayre et al. 1997; Sayre 2002; Crocco et al. 2003; Saver and Kidwell 2004; Millin et al. 2007). Stroke care best practices for EMS providers are often locally determined, but national consensus reports recommend a set of
measures to be used to evaluate EMS performance and quality of care (Adams et al. 2007; Millin et al. 2007), which have been adopted in NC (Williams et al. 2009). These performance measures include: 1) stroke screen performed using a validated tool (i.e. CPSS, LAPSS), 2) time of symptom onset (or last known well) noted, 3) assessed for thrombolytic therapy eligibility, 4) blood glucose checked for hypoglycemia or
hyperglycemia, 5) cardiac rhythm checked for arrhythmias, and 6) minimized total time spent on-scene. However, the provision of these measures in the field is not well-known.
To initiate an EMS response, patients experiencing stroke-like symptoms call 9-1-1 themselves, but most commonly it is called by a family member or bystander (Rosamond et al. 2005). Their first emergency medical contact is with the
telecommunicator who receives the call and dispatches EMS to the patient’s location. These dispatchers, especially in EMD-certified call centers, may use pre-approved,
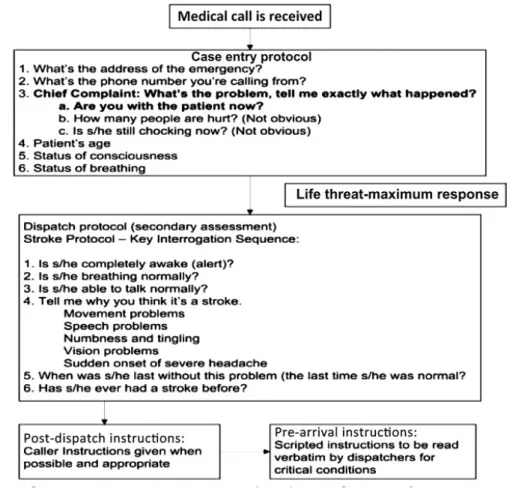
standardized triage algorithms to guide EMS dispatch, such as the Medical Priority Dispatch System (MPDS) or the Association of Public-safety Communications Officials (APCO) system. For example, the MPDS dispatch protocol, “Card 28,” (Figure 2.4) directs the line of questioning the dispatcher proceeds through as the caller provides information suggesting a stroke. However, not all call centers use these standardized protocols (Evenson et al. 2007). Although reports of dispatchers predicting a stroke are as low as 40% (Porteous et al. 1999; Ramanujam et al. 2008; Buck et al. 2009),
telecommunicators can save time with the early recognition of stroke and the appropriate EMS dispatch. To improve dispatcher recognition, a study is underway to assess the effectiveness of adding a dispatcher-administered CPSS to the MPDS protocol
(Govindarajan et al. 2011; Govindarajan et al. 2012). In fact, others have already found success in directing laypersons via telephone to administer the CPSS (Liferidge et al. 2004; Hurwitz et al. 2005), though these studies were not conducted in a field setting. Nevertheless, 9-1-1 dispatchers are an untapped resource for the prehospital
recognition and management of suspected stroke.
Figure 2.4. Card 28 in the Medical Priority Dispatch Systems (MPDS) protocol to evaluate stroke
4. Stroke Systems of Care
The delivery of acute stroke therapies can be expedited and enhanced through the integration of healthcare facilities, agencies, and providers into a stroke system of care (Schwamm et al. 2005; Acker et al. 2007; Alberts et al. 2011). According to the AHA/ASA Task Force on the Development of Stroke Systems, a stroke system of care “should coordinate and promote patient access to the full range of activities and services associated with stroke prevention, treatment, and rehabilitation” (Schwamm et al. 2005). Since emergency treatment for acute stroke primarily occurs in the hospital, some hospitals are becoming certified as Primary Stroke Centers (PSC), or facilities with specialized resources and personnel to provide advanced stroke care, particularly the administration of tPA (Alberts et al. 2011). On the other hand, other hospitals are unable
or not willing to administer tPA in stroke patients around the clock. A recent study found almost 45% of Georgia, South Carolina, and NC residents do not live within 30 minutes of a Joint Commission-certified PSC, and furthermore, a large percent of stroke deaths occur in regions not serviced by these recognized stroke care centers (Khan et al. 2011). Another recent study suggests admission to a specialized stroke center is associated with increased thrombolytic use and modestly lower mortality (Xian et al. 2011), although this warrants further research. Nonetheless, stroke systems of care are needed to coordinate the timely delivery of treatments within regions with varying emergency care capabilities and resources.
Multiple national groups, including AHA/ASA and the Brain Attack Coalition, are now emphasizing the importance of incorporating EMS into regional stroke systems of care for the primary role of prehospital management (Morgenstern et al. 2003;
Schwamm et al. 2005; Acker et al. 2007). Emphasis is placed on EMS systems to ensure that personnel involved in 9-1-1 telecommunication, emergency medical dispatch, and EMS response and transport receive training, tools, and protocols that meet current prehospital stroke care guidelines. Many EMS prehospital protocols incorporate triage and destination plans to aid in the decision to where to transport a patient suspected of experiencing an acute stroke. Furthermore, the dispatch centers that answer 9-1-1 calls play an important role in who responds in these situations and with what priority. A number of studies have shown some reduction in delay times and increase in treatment through the coordination of stroke responses between dispatch centers, EMS agencies, and EDs (Morgenstern et al. 2002; Perez de la Ossa et al. 2008; Puolakka et al. 2010). Finally, an effective system of stroke care requires continuous quality improvement and the development and ongoing monitoring of performance measures for its components (Acker et al. 2007). Evaluation of both process and outcome measures and feedback to providers are essential to assure
optimal care and service delivery. Process performance measures for EMS can include stroke screen performed or on-scene time minimized while patient outcome measures like mortality and functional status also need to be evaluated as a part of quality
improvement. Lastly, as new treatment modalities for stroke emerge, EMS systems must continue to collaborate with other components of the entire stroke system of care.
5. EMS System Capacity
An EMS system is the organization and coordination of EMS care providers and 9-1-1 dispatchers for a specific geographic service area. The care and services provided by these professionals partially depends on their education and training, resources (e.g. written patient care protocols) available to them, and the implementation of policies and plans encouraging best practices – all of which are encompassed under the term “capacity” (see later sections for more detailed description). This term is often used in this dissertation to refer to an EMS system’s actual and potential ability to optimally respond to and manage patients in the prehospital setting, where examples of capacity would be the number of certified paramedics in a system, training of EMS providers to perform a certain medical procedure, and instituting a policy that encourages a
recommended patient care practice.
There is believed to be significant variation between EMS systems and the care they provide (Garrison and Brice 2007). Research has shown significant regional variability in out-of-hospital trauma care in the US, and while the authors posit potential reasons like system organization, medical direction, and paramedic training, they were not further investigated (Bulger et al. 2007). Prehospital management of acute stroke also varies by EMS system and region and can depend on personnel certification level and system capacity. Studies have shown the accuracy of stroke identification by
prehospital care provider increases after given appropriate education and training (Smith
et al. 1999; Harbison et al. 2003; Wojner et al. 2003; Wojner-Alexandrov et al. 2005); however, not all EMS personnel receive stroke-specific education and training on a regular basis (Crocco et al. 1999). Hospitals, in their capacity to optimally treat and manage stroke patients, are commonly assessed and monitored(Goldstein et al. 2000; Ruland et al. 2002; Okon et al. 2006; Albright et al. 2009; Goldstein 2010; Okon et al. 2010; Shultis et al. 2010). In fact, researchers have found improvements in NC hospitals from 1998-2008 (Goldstein 2010). Similarly, EMS systems need to be regularly
assessed and monitored for their capacity to manage stroke patients in the prehospital setting.
D.
Public Health Significance
Over the last decade in NC, roughly 28,000 patients per year were hospitalized for stroke (Huston 2010). Given about half of stroke patients in NC arrive to the hospital by EMS (Rose et al. 2008; Patel et al. 2011), an estimated 14,000 stroke patients came in contact with an EMS care provider, and this figure does not include out-of-hospital stroke deaths and stroke mimics that could potentially initiate an EMS response as well. Although some have shown only 3% of ambulance transports had a final stroke
diagnosis, 34% of runs were non-traumatic, neurological complaints (Kidwell et al. 2000). Therefore, prehospital care practices for stroke may be relevant to a substantial number of EMS encounters, not just the ones for “real” strokes. In conclusion, EMS already impacts a large number of stroke patients in NC annually and could be even greater if more people (or witnesses) called 9-1-1 when experiencing (or observing) stroke-like symptoms.
Studies on EMS and acute stroke patients up to this point have demonstrated a benefit of EMS transport over private means, but there has been only limited research in the differences between EMS systems and their impact on patient care. EMS systems
22
cover the entire scope of prehospital patient care from licensing and employing 9-1-1 dispatchers and EMS care providers to setting standards for education and training and patient care protocols and policies. A systems-approach is one way to initiate change in order to improve patient, as shown in the trauma literature (Ornato et al. 1985).
III.
REVIEW OF THE LITERATURE
This dissertation explored the topic of EMS and prehospital stroke care. This chapter presents the current state of knowledge and a critical review of the literature for these specific aims:
Specific Aim 1. Assessed current EMS capacity in NC to respond to, evaluate, and
manage stroke patients
a. Evaluated variations in EMS stroke care capacity
b. Estimated changes in EMS stroke care capacity since 2001
Specific Aim 2. Identified individual and ecological predictors of EMS time
intervals among stroke patients
a. Evaluated distributions and correlates of EMS time intervals among stroke patients
b. Estimated the association of EMS systems having detailed stroke protocols with minimization of time spent at scene with stroke patients
A.
Specific Aim 1 – EMS stroke care capacity
1. EMS systems
county-based EMS systems to coordinate the credentialing of EMS agencies for each county under the broader oversight of the NC OEMS EMS (Mears et al. 2010). Whereas in many states, EMS personnel are employed and overseen by agencies, NC has a unique organization with an additional level within the personnel-agency-system-state structure. Each EMS system has a medical director, a licensed physician who provides medical oversight and, with guidance from the NC Office of EMS, can set educational requirements or modify patient care protocols, for example. However, the involvement of medical directors in local EMS tends to vary (Greer et al. 2012).
2. EMS capacity for prehospital stroke care
a) EMS Education and Training
The current level of stroke education and training provided to EMS personnel is not well-known. Further complicating the matter is that educational curricula and requirements are not set to national standards; they are regulated at the local level, which leads to considerable variation between regions (Alberts et al. 2011). A nationwide mailed survey of EMTs in 1999 found 87% were required at least 1 hour of stroke
education as part of initial training, although only half had subsequent sessions for continuing education (Crocco et al. 1999). Education was largely in reference to knowledge of stroke signs and symptoms, risk factors, types and mimics, and management and treatment. The authors state that almost all respondents could correctly define a stroke and list the major stroke signs and risk factors. However, two-thirds were unaware of the 3-hour tPA window, and a substantial proportion (25%) felt stroke could be treated on a nonemergent basis. Only the higher levels of EMT
(intermediate and paramedic) were sampled, so excluding EMT-Bs would expect to overestimate the overall frequencies of stroke education and knowledge. Also, of the 983 EMTs randomly sampled from a national database and mailed a survey, only 36%
responded, and although responders and non-responders were equivalent on
demographic factors, there is some concern for selection bias. The low response rate may be due to a lack of interest in the survey content and the burden of completing then mailing back the questionnaire.
Recently, two cross-sectional telephone surveys (adapted from Crocco et al. (1999)) of Montana EMTs in 2006 and 2009, as part of the Montana Stroke Initiative, investigated stroke knowledge among licensed EMTs (McNamara et al. 2008; Oser et al. 2010). EMT knowledge was relatively low for awareness of stroke signs and symptoms (60%), risk factors (45%), and the 3-hour tPA window (57%) (McNamara et al. 2008), and furthermore, the Montana Stroke Initiative EMS continuing education program included these focus areas, and no significant improvements were seen (Oser et al. 2010). On the other hand, a significantly higher percentage of EMTs reported training on stroke screens in 2009 (62%) compared to in 2006 (42%) (Oser et al. 2010). Although the generalizeability of EMS in Montana to other regions, like populous urban areas, may not be valid, they surveyed a representative sample of all EMT levels and first responders, unlike Crocco et al. Although the response rates for both surveys (55% and 46%, respectively) were higher than Crocco et al.'s national survey, participation was still low (Oser et al. 2010). In general, participation has been much better for surveys of EMS agency directors and chiefs while responses from EMTs tend to be more difficult to obtain. Nonetheless, these findings support the need for more stroke education among EMS personnel.
Generally, the stroke-specific education and training requirements of EMS
personnel are locally determined. In 2001, EMS researchers in NC mailed surveys to the 83 largest EMS agencies (Brice et al. 2008). Of the 72 responding, 89% reported
providing their EMS personnel some stroke education in the past 2 years, and of those, 55% provided at least 5 hours of training. Stroke risk factors, signs and symptoms, and
pathophysiology were topics often covered (>90%) while education on stroke scales and thrombolytic therapy were less common (69% and 62%, respectively). Even though the survey had a high response rate (86%), these estimates may be upwardly biased since only the largest agencies, presumably with the most resources, were selected for the survey. Also, these results are from over 10 years ago and may not reflect current EMS stroke care capacity. A more recent survey of Minnesota EMS agencies was conducted in 2006 (Tsai 2008). EMS directors were queried on the frequency and format of stroke trainings provided to their EMS personnel. They reported 60% are trained in stroke at least once a year and another 30% every 2 to 3 years. A large majority of trainings were offered in classrooms (70%) compared to DVD or video (10%) and online (3%) formats. The specific topics covered in stroke trainings were not investigated. While all Minnesota agencies were surveyed, the response rate was 77% (Tsai 2008), somewhat lower than the comparable NC survey (Brice et al. 2008).
b) EMS Protocols, Practices, and Policies
Like education and training requirements for EMS professionals, there are no national standards of patient care protocols and policies for stroke. These are left to the discretion of the local medical director and state regulatory office. Crocco et al.'s (1999) national survey of EMTs found only 60% reported their department had a stroke protocol (i.e. a specific set of instructions on the management of a stroke patient). Meanwhile, the 2006 survey of Montana EMTs also found nearly the same proportion (61%) reported a stroke protocol, albeit within a smaller region (McNamara et al. 2008) . Oser et al. (2010) observed a significant increase to 69% after a repeat survey three years later. In fact, improving stroke protocol use was a goal of the Montana Stroke Initiative. In other regions of the US, 83% of EMS agencies in NC reported a protocol for the prehospital management of stroke patients (Brice et al. 2008) while a lower percent (76%) in
Minnesota reported stroke protocols (Tsai 2008). While most NC EMS agencies reported the use of a stroke protocol in 2001, a significant proportion (17%) reported no stroke protocol, and many of the protocols provided were missing specific instructions on stroke patient evaluation and hospital prenotification and transport (Brice et al. 2008). However, since January 1, 2010, all NC EMS systems are required to implement a standard stroke protocol.
EMS care of stroke patients may be insufficient given the lack of knowledge among EMTs. In 1999, Crocco et al. (1999) found about one-third of EMT-Is and 20% of paramedics did not know stroke patient management strategies (i.e. IV insertion, oxygen administration, blood glucose measurement, cardiac montoring). However, more recent EMT surveys in Montana found 90-100% were able to identify these strategies in both 2006 and 2009 (McNamara et al. 2008; Oser et al. 2010), so this may not be currently as much of a concern. They observed only 62% reported the use of stroke screening tools in 2009, although usage increased from 40% in 2006 (Oser et al. 2010). While the recent increase of stroke scale use in Montana may be due to efforts of the Montana Stroke Initiative, the 2006 survey findings are fairly consistent with 44% of NC agencies in 2001 and 47% of Minnesota agencies in 2006 reporting the use of stroke scales by their EMS personnel (Brice et al. 2008; Tsai 2008).
Policies to provide advance notification to the hospital of a potential stroke patient were fairly prevalent in NC and Minnesota (72% and 78%, respectively) (Brice et al. 2008; Tsai 2008). Moreover, 87% of EMTs in Montana reported prenotifying the hospital of a stroke (Oser et al. 2010). In addition, Tsai (2008) found that 37% of agencies reported the existence of a written transportation and destination plan for stroke patients. Recently introduced NC legislation states: “Emergency medical services systems shall adopt written policies and procedures to facilitate the identification and transport of suspected stroke victims to an appropriate health care facility” (HB 1396 §
131E-321). While Brice et al. (2008) did not investigate this in 2001, the NC OEMS has since developed a standard stroke destination plan template and mandated its
implementation by January 1, 2010 (see Appendix C for NC stroke destination plan template). However, current usage of the plan in NC is not known. Moreover, it is not known whether these plans provide written guidance on patient transport to a
specialized stroke center. Other EMS stroke plans and programs, such as prehospital identification and rapid transport, have been documented in other regions of the US (i.e. Pacific Northwest, Iowa, Illinois) (Ruland et al. 2002; Albright et al. 2009; Shultis et al. 2010). However, researchers used hospital-based surveys relying on hospital personnel to report on EMS, so results are likely inaccurate and unreliable given that some have observed hospitals are largely unsure of EMS policies and practices (Shultis et al. 2010).
3. Regional variations in EMS stroke capacity
Several deficiencies in EMS capacity have been noted in rural areas. In their review of articles on emergency care of acute stroke, Leira et al. (2008) found no articles suggesting rural prehospital stroke care was superior to urban care. Rural EMS
personnel tend to be volunteers, less educated, and less experienced compared to their urban counterparts (Leira et al. 2008). Furthermore, in general, they receive less
technical support and medical direction (Knott 2003). The same disparities are expected to be present for capacity specific to the prehospital care of stroke patients. Although McNamara et al. (2008) found similar stroke knowledge between EMTs in rural and urban counties, they observed significantly less stroke screen training and use of stroke screening tools and stroke protocols in rural counties. Moreover, while these parameters improved over time, urban-rural disparities persisted (Oser et al. 2010). However, these findings may not be applicable to other regions outside of Montana, so it is important to replicate these results in other areas.
In general, there is insufficient knowledge on regional disparities in EMS stroke capacity in the US. On the other hand, several studies have addressed differences in access to hospital stroke services and care for Americans, mostly between urban and rural areas (Ruland et al. 2002; Okon et al. 2006; Gropen et al. 2009; Miley et al. 2009; Okon et al. 2010; Pedigo 2010; Shultis et al. 2010; Khan et al. 2011). Regardless of the region, these studies consistently found better hospital-based stroke capacity in urban settings. However, differences in EMS stroke care capacity by population density are not known. The EMS agency surveys in Minnesota (Tsai 2008) and NC (Brice et al. 2008) did not investigate demographic or socioeconomic disparities in EMS stroke care capacity in their respective states.
B.
Specific Aim 2 – EMS time intervals among stroke
patients
Given the time urgency of acute stroke treatment, it is critical for patients experiencing an acute stroke to present to the ED or hospital as soon as possible and preferably within 2 hours of symptom onset (National Institute of Neurological Disorders and Stroke: rt-PA Stroke Study Group 1995). Although patient delay to seek medical attention is the largest contributor to prehospital delay, EMS times also play a role, and transport of the patient should begin as soon as possible (Sayre 2002). Nationally accepted standards define EMS "response time" as the interval from the time a 9-1-1 call is received to the time a responding EMS unit arrives at the scene and EMS "scene time" as the amount of time spent with the patient at the scene before commencing transport (Acker et al. 2007). AHA/ASA guidelines state EMS response and scene times for suspected stroke patients to be less than 9 min and 15 min, respectively, at least 90% of the time, though acceptable limits can be locally determined based on resources, population density, and geography (Acker et al. 2007; Jauch et al. 2013). Nonetheless, previous reports of prehospital time intervals for stroke have, on average, exceeded the
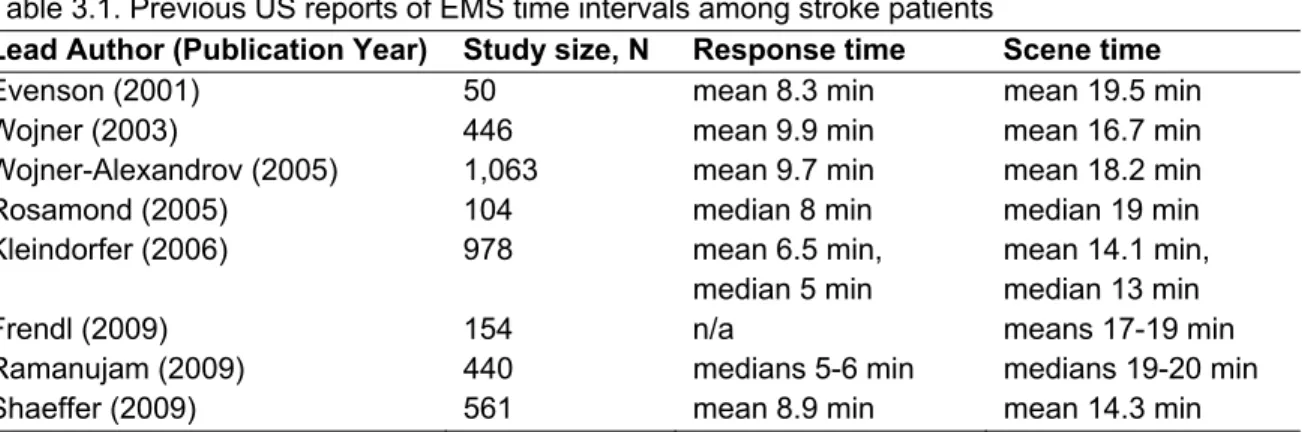
recommended benchmarks (Table 3.1). Although most of these estimates are from single, mostly urban regions, current evidence suggests there remain ample opportunity to improve EMS response and scene times.
Table 3.1. Previous US reports of EMS time intervals among stroke patients
Lead Author (Publication Year) Study size, N Response time Scene time
Evenson (2001) 50 mean 8.3 min mean 19.5 min
Wojner (2003) 446 mean 9.9 min mean 16.7 min
Wojner-Alexandrov (2005) 1,063 mean 9.7 min mean 18.2 min
Rosamond (2005) 104 median 8 min median 19 min
Kleindorfer (2006) 978 mean 6.5 min,
median 5 min
mean 14.1 min, median 13 min
Frendl (2009) 154 n/a means 17-19 min
Ramanujam (2009) 440 medians 5-6 min medians 19-20 min
Shaeffer (2009) 561 mean 8.9 min mean 14.3 min
1. Individual and Ecological Predictors
A study of stroke patients transported by EMS found the use of lights and sirens to the scene was associated with significantly shorter response time (-4.4 min) and scene time (-9.3 min) intervals, whereas age, gender, and race were not found to be associated (Evenson et al. 2001). The authors suggested the role of lights and sirens was due to heightened urgency brought on by emergency dispatch. However,
Ramanujam et al. (2009) observed only 1-min shorter median response and scene times with stroke recognition by EMD. Another investigation into neighborhood socioeconomic status and EMS responses for stroke found poorer communities were associated with longer response time (1.3 min) but shorter scene time (-3.4 min), though these
differences were considered relatively small and not clinically significant (Kleindorfer et al. 2006a). In addition, stroke patients of black race had marginally longer scene times.
These are the primary studies to have examined individual or ecological
predictors of EMS times among stroke patients. Evenson et al. (2001) and Kleindorfer et al. (2006a) were limited in the identification of stroke patients from hospital records and, thus, potentially missing patients with a clinical impression of stroke in the prehospital
setting. On the other hand, Ramanujam et al. (2009) enrolled patients with an EMD, EMS, or hospital diagnosis of stroke. Finally, these studies were also limited to relatively advanced EMS systems and more densely populated areas, and their findings may not be generalizable to other regions.
2. Evaluation of EMS Stroke Protocols
Since 2010, the NC EMS stroke protocol (Appendix A) has provided specific instructions for EMS responders to limit scene time to 10 minutes. However, in 2001, 83% of NC EMS agencies surveyed reported the use of a stroke protocol, of which only 50% gave specific instructions to minimize scene time (Brice et al. 2008). A more recent survey in nine states found 81% of EMS agencies had a specific on-scene time
benchmark for responding to stroke (Greer et al. 2012). To our knowledge, no studies have evaluated the impact of protocols on minimizing EMS scene times among stroke patients. There have been limited studies on the impact of interventions to minimize EMS scene times for patients with stroke. The Houston Paramedic and Emergency Stroke Outcomes (HoPSTO) study, an educational intervention to improve EMS and hospital stroke care, found mean scene times for suspected stroke patients
unexpectedly increased from 16.7 to 18.2 min after training in prehospital stroke identification (Wojner-Alexandrov et al. 2005). Frendl et al. (2009) trained EMS
personnel on prehospital stroke screening and observed a moderate decrease in mean scene time (19 versus 17 min). These studies simply compared mean scene times and, thus, may have missed important differences that are detectable using other statistical methods (Austin and Schull 2003; Do et al. 2013).
C.
Synopsis
1. Specific Aim 1
Deficiencies in EMS personnel training in prehospital stroke care have been documented nationally and in various regions since 1999 (Crocco et al. 1999;
McNamara et al. 2008; Oser et al. 2010). Areas of greatest need include education on stroke screening tools and eligibility for thrombolytic therapy. Additional assessments are needed on current levels of stroke education and training and on whether deficits are lessening over time, if at all. With a greater emphasis on use of stroke protocols and screening tools and policies on hospital prenotification and destination plans, recent improvements in these aspects of EMS stroke management are expected. In fact, the Montana Stroke Initiative observed significantly higher usage of stroke protocols and screenings tools among EMTs from 2006 to 2009 (Oser et al. 2010). Regarding the role of agencies, the 2001 NC survey found 83% reported stroke protocols while only 44% reported stroke screens, and the 2006 Minnesota survey found 76% and 47%,
respectively (Brice et al. 2008; Tsai 2008), though there are concerns on the accuracy of these estimates. Furthermore, policies on advance notification to the hospital and direct transport to a specialized stroke care facility for potential stroke patients are known to exist, but the current prevalence of such policies and plans for the prehospital
management of stroke is not known. In conclusion, updated assessments of EMS stroke care capacity are needed to better understand current variation and evaluate changes over time.
2. Specific Aim 2
Reports of EMS response and scene time intervals among stroke patients suggest at least 50% are not meeting recommended benchmarks, so improvements in EMS times remain to be realized. Previous studies have identified response with lights
33
IV. STATEMENT OF SPECIFIC AIMS
Specific Aim 1. Assessed current EMS capacity in NC to respond to, evaluate, and
manage stroke patients
a. Evaluated variations in EMS stroke care capacity
b. Estimated changes in EMS stroke care capacity since 2001
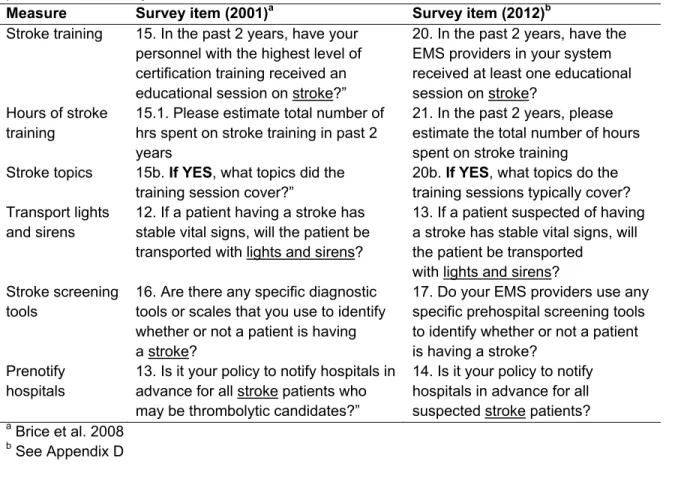
For the first aim, a statewide internet-based survey of EMS system capacity for prehospital stroke care in NC was conducted in 2012. Administrative directors of all 100 local EMS sytems were invited to participate. Respondents were queried on stroke training provided to EMS personnel and system practices and policies regarding care of stroke patients. Detailed analyses of system destination plans and patient care protocols for stroke were also conducted. Variation in overall EMS stroke care capacity was evaluated according to system patient volume and population density. Using data from a similar survey of NC EMS agencies in 2001 (Brice et al. 2008), I estimated statewide changes in EMS stroke care capacity over the past decade.
Rationale: A prior assessment of EMS in NC found deficiencies in stroke capacity, including personnel education and training, use of stroke protocols and screening tools, and hospital prenotification (Brice et al. 2008). However, in the last 10 years, major national and statewide changes have occurred in the prehospital
management and care of stroke patients, including the use of standardized protocols and validated stroke screening tools and the development and use of destination plans (Acker et al. 2007; Alberts et al. 2011; Williams et al. 2009). An updated assessment would provide insight into the current state of EMS stroke care capacity in NC and improvements, if any, as a result of statewide standardization of prehospital stroke care.
Specific Aim 2. Identified individual and ecological predictors of EMS time
intervals among stroke patients
a. Evaluated distributions and correlates of EMS time intervals among stroke patients
b. Estimated the association of EMS systems having detailed stroke protocols with minimization of time spent at scene with stroke patients
In the second aim, distributions of EMS time intervals for suspected stroke events occurring in NC in 2009-2010 were evaluated. Data on EMS responses for stroke patients were obtained from the NC Prehospital Medical Information System (PreMIS), a statewide electronic healthcare record for the evaluation of EMS patient care and system performance (Mears et al. 2010). EMS response (i.e. dispatch to at scene) and scene (i.e. at scene to left scene with patient) time intervals for suspected stroke events were calculated and compared to nationally recognized benchmarks (Acker et al. 2007). EMS times were also compared according to system patient volume and population density and various individual-level factors. I further investigated the role of system capacity in
36
an evaluation of scene times by whether NC EMS systems used protocols with instructions on minimizing time spent at the scene.
Hypotheses: Previous studies of EMS responses for stroke have found longer than desired average prehospital time intervals. I hypothesized EMS time intervals in this study would be the same or marginally shorter. Regarding individual factors, response mode to scene (i.e. lights and sirens) was expected to predict shorter response times whereas older patient age would be associated with longer scene times. Rural regions were expected to have greater response times due to sparse populations, though there was no reason to expect scene times would significantly differ from more densely populated areas. Since EMS personnel are instructed to follow the appropriate protocol for a particular patient condition, I expected to observe shorter scene times among systems with protocols having specific instructions on minimizing scene times compared to no instructions at all.
Rationale: According to AHA/ASA guidelines, EMS response and scene times for suspected stroke patients should be less than 9 min and 15 min, respectively, at least 90% of the time (Acker et al. 2007; Jauch et al. 2013). Previous reports of EMS time intervals for stroke have exceeded the recommended benchmarks. A better
V.
METHODS
A.
Overview
The first aim of this dissertation was to study the current EMS system capacity for prehospital stroke care in NC. An internet-based survey was conducted in 2012 to collect information on prehospital stroke care capacity from all 100 local EMS systems. To estimate changes in EMS stroke care capacity in NC since 2001, data from this survey were compared to responses from a previous survey (Brice et al. 2008).
Abstraction of EMS stroke protocols and destination plans was also conducted to assess system capacity. Priority measures of EMS stroke care capacity were combined into a summary score.
The second aim was to describe the distributions of EMS time intervals for suspected stroke events and to evaluate individual and ecologic correlates. Using 2009-2010 data from the NC PreMIS, EMS response and scene time intervals among stroke patients were calculated and regressed on patient, incident, and system characteristics in multi-level modeling. Furthermore, data from stroke protocol abstraction in the first aim were incorporated to estimate the differences in scene times by whether systems had protocols with instructions on limiting scene time.
The methods for data collection, management, and analysis are described in this chapter. Study design and procedures were approved by the University of North
B.
Study Region and Context
1. Organization of EMS in NC
The mission of the NC OEMS is to oversee and guide EMS credentialing and service delivery within and across counties. Starting in 2002, all 100 NC counties were required by state law to form an EMS system that consolidates the credentialing of EMS agencies and professionals within that county. Ultimately, 100 EMS systems were created, with Pasquotank and Camden counties combining into a single system and the Cherokee Tribal Nation forming its own system in Swain county. Figure 5.1 illustrates the hierarchical organization of EMS in NC; where from the bottom up, EMTs are employed by EMS agencies, one or more agencies operate within an EMS system, and all 100 systems are under the oversight of the state regulatory office. For example, the Orange County EMS system is serviced solely by Orange County EMS while four EMS agencies service the Wake County EMS system, the largest agency being Wake County EMS (see Figure 5.1).
AGENCY SYSTEM
STATE NC Office of EMS
Wake Co. EMS System
Wake
Co. EMS Apex EMS
Cary Area EMS Eastern Wake EMS Orange Co. EMS System Orange Co. EMS
Figure 5.1. Organizational Structure of EMS in North Carolina, Orange and Wake Counties
Each system is appointed a medical director to provide guidance on patient care and overall medical oversight. A head EMS administrator, or EMS Director, is also appointed and supervises EMS providers and manages the daily operations of the EMS