Reverse-Engineering the Brain:
The parts are as complex as the whole.
Jens Pohl, PhD
Professor of Architecture (Emeritus) California Polytechnic State University (Cal Poly)
Vice President, Engineering & Technology Tapestry Solutions (a Boeing Company)
San Luis Obispo, California, USA
Abstract
The purpose of this paper is to review the current state of neuroscience research with a focus on what has been achieved to date in unraveling the mysteries of brain operations, major research initiatives, fundamental challenges, and potentially realizable objectives. General research approaches aimed at constructing a wiring diagram of the brain (i.e., connectome), determining how the brain encodes and computes information, and whole brain simulation attempts are reviewed in terms of strategies employed and difficulties encountered. While promising advances have been made during the past 50 years due to electron microscopy, the development of new experimental methods, and the availability of computer-enabled high throughput imaging systems, brain research is still greatly encumbered by inadequate monitoring and recording capabilities. Four hypotheses relating to comprehension through the assembly of parts, formation of memories, influence of genes, and synapse formation are described as plausible explanations even though they cannot be validated at this time. By assessing the feasibility of overcoming the principal problems that beleaguer brain research in comparison with the potential benefits that can be derived from even partial achievement of the goals the author concludes that the significant investment of government funding is justified.
Keywords
chromosomes, comprehension, connectome, digital atlas, DNA, genes, genome, ion channel, measurable brain parameters, memory, microscopy, neuroinformatics, neuron, neuroscience, phrenology, plasticity, protein, RNA, synapse, twins
Neuroscience Research in Perspective1
Although a great deal of progress has been made in the scientific study of the human nervous system over the past 50 years, even today (2016) neuroscience is essentially still a collection of experimental findings and hypothesis rather than an integrating set of theories and validated principles. We know that the brain is a network of networks in which billions of neurons communicate with each other, but we know very little about what they communicate or the role of individual neurons in achieving the end result of the communication. Similarly, although we
1
have some understanding of the molecular elements and their functions within a neuron and its synaptic connections to other neurons, we can only hypothesize how these functions may contribute to our ability to comprehend, memorize and reason (Marcus 2015).
There is general agreement that the brain is an information processor of some kind that takes inputs from the outside, encodes these inputs into some format that allows it to compute a virtual model of the outside, and formulates instructions to the various components that control our physical (e.g., movement) and behavioral (e.g., thinking) functions. However, the fundamental principles of brain computation have yet to be discovered and there is no overarching theory of how networks of neurons contribute to something as complex as human cognition.
The difficulties that are continuing to confront neuroscience research are related to the enormous scope of the undertaking in terms of the number of neurons involved, the complexity of the individual parts and their interactions within the whole, and the relatively limited capabilities of the available research techniques and devices. Although there have been significant advances in microscopy with the development of the electron microscope that can achieve resolutions of objects smaller than 50 picometer2 , the maximum number of neurons that can be recorded simultaneously is around 100 with a recording speed that lags well behind the neuronal firing rate.
So far most of the recording of neural activity has been confined to the measurement of single neurons. While this provides some insight into the operation of a single node, it provides little reliable information about the behavior of the network of several million of nodes that this neuron is part of. Sporns (2015) draws attention to this problem by pointing to variables such as synaptic weightings and neuron shapes that are likely to have significant influence on the behavior of a network of neurons. It is now generally recognized that the behavior of a network as a whole may differ markedly from the behavior of its nodes under certain conditions. This gives rise to the notion of emergence in network theory, where the collective interactions among the nodes of a complex network can lead to new properties that do not exist at the node level. In the case of the human brain such emergent phenomena leading to the coordinated firing of large numbers of neurons is referred to as neural synchronization. This is a condition that represents the global outcome of many local events that are orchestrated by the network as a whole rather than any specific chain of causes at the node level (Sporns 2015, 93).
Measurable Brain Parameters
The complexity of the brain is not only due to the enormous number of neuron nodes (around 86 billion in the human brain) and the even much larger number of connections between nodes (around 1000 trillion in the human brain), but also due to the variables that govern the behavior of the nodes. First, there are probably hundreds of thousands of neuron types that appear to play different roles and are therefore likely to function in different ways. The roundworm C elegans3 , whose complete connectome was published in 1986 (White et al. 1986), has only 302 neurons but 100 types of neurons. Therefore, even though researchers have been able to record the behavior of single neurons the role and function of different types of neurons is likely to involve the tracing of synaptic chains (i.e., pathways) involving a large number of neurons. This requires the ability to record thousands if not millions of neurons simultaneously. While increasingly
2
In the metric system of units 1 picometer (pm) is equal to one trillionth of a meter (i.e., 10-12m)
3
more powerful technologies are becoming available for recording the behavior of groups of neurons, they are limited in both what they can measure and their ability to keep up with the speed at which the state of individual neurons can change.
Second, neurons produce (i.e., express) extremely complex sets of molecules that generate and sense the electrical signals that underlie all neuronal responses and synaptic transmissions. There is evidence that the reweighting of the synapses is influenced by multiple factors that include not only the shape (i.e., morphology) of the neuron but also the rate of excitatory or inhibitory signals and the strengths of those signals. In this way the synapses play a decisive role in how neurons interact to reinforce or diminish, compete or cooperate with each other. Even though the communication at a synapse is a point-to-point connection that is restricted to the two neurons involved, the influence of synapse variables on the complex behavior of large groups of connected neurons will likely continue to be a severe challenge to researchers for the foreseeable future.
Neurons and synapses: Neurons
consist of a cell body and branches called neurites. There are two kinds of neurites, namely: a relative long axon
along which the neuron passes an electric charge when it spikes or fires; and, many much shorter and more convoluted dendrites (Figure 1). The axon and dendrites of any one neuron connect to many other neurons forming a complex network of equally complex sub-networks. The connection or contact points between
neurons are referred to as synapses. Figure 1: Brain component – the neuron
However, the two sides of a synapse do not actually touch but are separated by a very narrow
vesicles, while the receiving side of the
cleft contains receptors referred to as
postsynaptic density. Triggered by an
electrical spike one or more vesicles (the senders) secrete a neurotransmitter into the cleft, which is sensed by the postsynaptic density receiver. While there are over 100 types of neurotransmitters consisting of atoms that are bonded to each other, a neuron typically secretes the same neurotransmitters (often only one) at
all of its synapses. Figure 2: Brain component – the synapse
of the binding site (i.e., the receptor lock). Some receptors are a combination of a lock and a door, with a small tunnel threading through the receptor molecule that connects the inside of the neuron with the outside. This tunnel is blocked by a door-like structure most of the time. However, when the neurotransmitter binds to the receptor the door is opened for an instant to allow the electrical current to momentarily flow through the tunnel. This type of protein that contains a tunnel is referred to as an ion channel, where ions are the electrically charged particles that conduct electricity in aqueous solutions. However, there are many types of ion channels that are not receptors. For example, some of them enable neurons to generate spikes.
How does a synapse deal with the relative slowness of chemical communication, the prevention of potential crosstalk, and timing? Certainly chemical signals are much slower than electrical signals. However, a synaptic gap is very narrow and therefore the neurotransmitter does not have to travel far. Also, since brain tissue is tightly packed with up to a million neurons and a billion synapses per cubic millimeter, the synapse has to ensure that the secretion of a neurotransmitter is not sensed by other nearby connections. To prevent a cascading sequence of nearby neuron activations, the synapse either sucks the neurotransmitter back up for reuse or degrades it into an inert form. Using the same mechanism of recycling and degrading that minimizes crosstalk the synapse is also able to control the timing of the chemical signal by ensuring that the signal does not linger on.
Synaptic chains: A synapse is activated when a spike triggers secretion on the sender side. On the receiver side receptors sense the neurotransmitter and then make electrical current flow. In other words, a synapse converts an electrical signal into a chemical signal and then back into an electrical signal. A pathway (i.e., synaptic chain) is created when the electrical signal passes from neuron A to neuron B to neuron C, and so on. These pathways are directional because synapses are one-way communication devices. At any synapse one neuron is always the sender and the other always the receiver. In the case of electrical signals the spike travels from the cell body along the axon away from the neuron and from other neurons through dendrites towards the neuron to the cell body.
In summary, in any neuron electrical signals flow from dendrites to the cell body and once an action potential threshold has been exceeded a new electrical signal flows from the cell body along the axon to the dendrites of connected neurons. Chemical signals jump from the axon of neuron A to the dendrite of neuron B. In neuron B electrical signals again flow from dendrites to the cell body and along the axon if the action potential is exceeded and a spike occurs. These pathways end when axons finally connect to nerves that connect to muscle fibers, which respond by contracting. This causes the muscle to shorten and produce a movement.
cause multiple responses and any one neuron can be activated to generate a spike by receiving weak signals from multiple connected neurons.
Weighting of synapses: In most neurons the electrical signals received by the dendrites of that neuron are weighted according to their strength. Strong synapses produce large currents and weak synapses produce small currents. In principle every neuron is different in its behavior due to the unique configuration of its ion channels. Therefore the weighting model, which is common in most neurons, must not imply a common behavior of neurons 4 . However, the classification of neurons into types suggests that neurons of the same type behave in similar ways. It is also possible for a neuron to receive multiple signals from the same external neuron through several synapses. These signals must be received within a brief time span from milliseconds to seconds for them to be combined by the cell body into one signal that is compared with the action potential of that neuron. It follows that there are two mechanisms that prevent neurons from spiking indiscriminately, namely: the threshold of the neuron’s action potential; and, the action of inhibitory synapses that will reduce the strength of the combined signal.
A neuron is either excitatory or inhibitory but not both. The existence of inhibitory synapses is crucial to the operation of the nervous system. An excitatory neuron makes only excitatory synapses onto other neurons and an inhibitory neuron makes only inhibitory synapses. However, this is not the case for the synapses received by a neuron from other neurons. Therefore an inhibitory neuron may also receive excitatory signals and vice versa. The analogy is to a conformist stance as opposed to a contrarian stance in society. There is also a type of excitatory synapse that has a direct electrical connection and does not use a neurotransmitter. These synapses communicate more quickly, but are far less in number than the chemical synapses.
The threshold action potential of the neuron spike mechanism has two functions, to either transmit a signal that may precipitate an action or to not send a signal because the combined strength of the signals it has received is insufficient to warrant an action. In this respect the brain is far more sophisticated than a telecommunication network or the wiring of a Cray supercomputer that are designed to essentially support only two states (i.e., on or off).
Life cycle of the human brain: The creation of neurons and synapses proceeds through four stages (Figure 3): neurons are created; neurons migrate to their assigned places in the brain; neurons extend branches (i.e., neurites) throughout the body; and, neurites make connections.
Neurons are created: Through the division of progenitor cells neurons are created in the
prenatal stage before birth. Similar to stem cells, progenitor cells replicate into a specific type of cell. However unlike stem cells that can replicate indefinitely, progenitor cells can divide only a limited number of times.
Neurons migrate to the brain: The migration of neurons to the brain during the prenatal
stage can be disrupted with the result of structural abnormalities in the brain, such as the
4
cortex lacking folds.
Both of these stages occur in the prenatal brain. By the time a baby is born the creation and migration of neurons are virtually complete and there are only a few areas of the brain in which neurons will continue to be created after birth.
Figure 3: Creation of neurons from conception to early childhood
Neurons grow neurites: After birth the neurons continue to grow branches in the form of
dendrites and axons. The axons have to grow the most since they are much longer than the dendrites. The growing tip of an axon is called a growth cone, which navigates its way through the body under the guidance of genes. The surfaces of neurons are coated with special guidance molecules and the spaces between neurons contain drifting guidance molecules. The axon’s growth cone is equipped with sensor molecules that can detect the guidance molecules much like dogs following a scent. Since both the guidance molecules and the sensor molecules are produced under genetic control we can say that the wiring of the brain is guided by genes. Axons grow fairly straight and do not branch until the growth cones reach their destinations. While the overall shape of an axon appears to be genetically determined, the branching pattern at the tip is likely to be largely random. The analogy is a tree where the need for branches is determined by the genetic plan but the actual location and size of branches is influenced by environmental conditions and a degree of randomness.
Neurites make connections: During the wiring of the brain neurons make connections
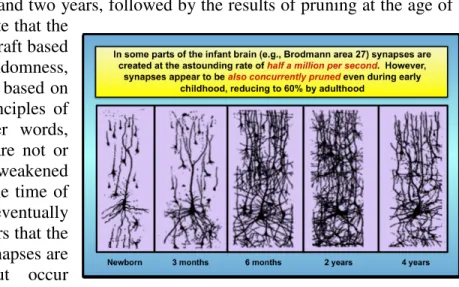
Synapses are created at an astonishing rate in the infant brain. For example, in Brodmann
area 17 alone half a million synapses per second are produced during the third and forth
month after birth (Huttenlocher 1990). Another argument in favor of the randomness hypothesis is that while such large numbers of synapses are formed during development many synapses are also eliminated. Pruning of both synapses and dendrites takes place to a significant extent after the age of two years, leaving persons that have just reached adulthood with only about 60% of the synapses that they had when they were two years of age (Huttenlocher and Dabholkar 1997).
Figure 4 (Seung 2013, 108) is an example of the increase in synapses and dendrites from birth to one month, 6 months and two years, followed by the results of pruning at the age of four years. One could speculate that the
early connectome is a rough draft based on gene guidance and randomness, which is subsequently refined based on the survival of the fittest principles of Neural Darwinism5 . In other words, dendrites and synapses that are not or very infrequently used are weakened (or remain very weak from the time of their creation) and eventually eliminated. However, it appears that the creation and destruction of synapses are not separate processes but occur
concurrently. Figure 4: Pruning of dendrites and synapses
In summary, while the creation of synapses is largely random, the elimination of synapses is based on lack of utilization of synapses. In other words, the dendrites and synapses that are eliminated were not needed in the representation, interpretation and comprehension of the stimuli that were processed by the brain.
General Research Approaches
Recent large-scale research efforts in neuroscience have focused on three related areas, namely:
(a) connectomics, to determine (map) which neuron is connected to which other neurons (Sporns
2015, Zador 2015, Hawrylycz et al. 2015, Seung 2013); (b) brain activity mapping, to observe the electrical discharges along the synaptic pathways (Shenoy 2015, Koch et al. 2015); and, (c)
large-scale brain simulation, the integration of data of all areas of neuroscience to construct a
biophysically realistic model that can be compared with experimental findings (Hill 2015). While each of these large-scale research efforts is certainly valuable none of them on their own is likely to lead to a holistic understanding of how the multi-level brain functions. In addition, it is often difficult to determine how to integrate the findings from each area since each area has missing pieces that the other two areas cannot compensate for. For example, an activity map without a connectome could tell us a great deal about the behavior of larger neural groups
5
(networks) but would not allow us to reconstruct the underlying circuitry. A connectome without an activity map would provide the static circuit architecture but not tell us anything about the dynamic reweighting of excitatory and inhibitory synapses.
Even though the brain of every human is different since both genes and experience shape the human connectome, mapping of experimental data into a common reference framework is a necessary requirement for coordinating research efforts. Not only will it allow the comparison of multiple brains, but it will also facilitate the recognition of unusual features in a particular brain and contribute to an understanding of how these apparent anomalies differ from the norm. Digital atlases can provide an effective framework for building a standard atlas that serves as a single-point-of-access clearing house for accessing multiple databases and related documents (Hawrylycz 2015). However, a standardized brain atlas will require a common three-dimensional coordinate system so that the findings of neuroimaging experiments can be readily analyzed, compared and integrated into the appropriate atlas database. This requires agreement on the specification of an origin (i.e., reference point) and a transformation function that relates each individual three-dimensional brain image from its native coordinates to the coordinates of the atlas6. A standard toolset that allows different neuroscience data to be combined is now under development by the International Neuroinformatics Coordinating Facility (INCF) for the mouse, which has remained to this day one of the most important subjects in experimental neuroscience.
Connected brain: There is much evidence to suggest that the overall interconnectedness of the brain rather than the simple expansion of specialized regions of the brain is responsible for human cognitive capabilities. For example, it is now recognized that neuropsychiatric disorders such as depression, anxiety, schizophrenia, and obsessive-compulsive behavior, are likely to be the result of complex genetic and environmental factors impacting neural circuitry. The independent proposals in 2005 for a unified approach to defining connectional atlases of the brain by Sporns of Indiana University and Hagmann of Lausanne suggested the term connectome to refer to a complete map of the neural connections within the brain (Sporns et al 2005, Hagmann 2005).
Since the study of the first complete neural circuit of any organism in the 1970s by Nobel laureate Sydney Brenner several neuroinformatics databases of connectivity have become available (e.g., CoCoMac www.cocomac.org and Brain Architecture Management System (BAMS) http://brancusi.usc.edu). Several projects to map the connectome of the laboratory mouse have been supported by public and private funding. Of these the Allen Mouse Brain Connectivity Atlas developed by the Allen Institute contains more than 1.5 petabytes of data mapped into a common three-dimensional reference space that allows the identification of neural circuits of the laboratory mouse.
Mapping the connectome of the human brain is one of the great scientific challenges of the 21st century. The Human Connectome Project (HCP) (www.humanconnectome.org) is tackling a key aspect by focusing on some of the main neural pathways that underlie brain functions and behavior. Due to the enormous complexity of the human brain HCP is targeting only large-scale circuitry in 1,200 adults using non-invasive neuroimaging techniques (e.g., MRI, fMRI, EEG). However, the current non-invasive imaging techniques cannot capture brain activity at a neural level and mapping the connectome at a cellular level
6
Many of these standardization advantages grew out of the National Institutes of Health’s Decade of the Brain
currently requires microscopic postmortem analysis of brain tissues. The required data collection would take years given the current technology when we consider that the human cerebral cortex alone contains 1010 neurons and 1014 synapses. The inadequacy of existing annotation tools to fully delineate and extract information at a neuronal scale and the incompleteness of the algorithms that are required to map relevant connections and construct connectivity pathways are current obstacles. The open source, crowd-sourcing initiative Open Connectome Project (www.openconnectomeproject.org) was launched in 2011 to meet this challenge.
Computational brain: Similar to a computer the brain operates over input and manipulates information systematically. However, both the memory capabilities of the brain and its encoding operations appear to be based on different principles. Marcus (2015) believes that it is very important for the neuroscience community to break away from the notion that the brain is not a computer. He believes that the computational capability of the brain is a fundamental component of the highly plausible and extremely useful notion that perception and comprehension in the brain are constructed progressively and hierarchically from low level feature detectors (e.g., differences in luminance and orientation) into meaningful objects such as cars, animals, persons, and faces. He argues that the unwillingness to consider the brain as a computer stems from the promises of neural networks. The pattern matching capabilities of neural networks (i.e., Parallel Distributed Processing (PDP)) were seen as the first serious alternative to the simplistic understanding of intelligence in terms of stored computer-like programs. However, eventually it became clear that the ability of PDP networks to explain higher level cognition is severely limited. Even though the brain is itself a network of neurons it is far more complex than a PDP network that consists of an array of input nodes that are connected to output nodes through one or more layers of hidden nodes. The attractiveness of PDP networks was that they did not resemble computer programs. They had no variables or syntax like loops and if-then comparisons. It was assumed at the time that the brain operates in a similar pattern matching manner based on an initial more or less random organization that is adapted and tuned by experience. While the parallel processing capability of PDP networks is mirrored by the brain there is now some evidence that suggests that even at the embryo stage the brain begins to develop intricate (rough drafts) of brain structures in the absence of experience. For example, Nobel laureate Thomas Südhof conducted an experiment with mice whose transsynaptic neurotransmitter secretion was genetically blocked, thereby shutting down most of the brain’s internal communication mechanism (Yang et al 2010). If the brain’s organization is initially random and then tuned by experience then this laboratory breed of mice would essentially have random brain structures at birth. In fact, these synaptically silent mouse embryos had developed brains that appeared to be normal in respect to folds, different neuron types and the organized structures that one would expect in typical mice. Subsequent studies by others in physiology and behavior further validated that the brain’s basic organization is structured in advance of experience.
visual scenes in parallel, such as extracting edges across a scene. He concludes that at least the brains of vertebrates are computational in the sense that they operate over inputs and manipulate information systematically.
This does not mean that a brain is a digital computer. The memory capabilities of a brain may be based on different principles and a brain may perform different kinds of operations on the information it encodes, but it does encode information. Specifically, brains transduce inputs into chemical and electrical information, operate over that encoded information, and use the resulting output to generate actions and update the internal representation accordingly. Similarly, computers take inputs, encode and manipulate information, and transform their inputs into outputs.
The question then arises how do brains store and encode information and what operations do they perform over the encoded information? If one were to reverse engineer a computer co processor one would find that its basic elements are transistors and that these transistors are organized so that they perform a primitive set of instructions. More complex operations would be combinations of these instructions interacting with other components of the environment in which the co-processor functions. Transistors connected in circuits create basic logical operations. In a brain the neuron is the equivalent of the transistor and a circuit-level understanding of the equivalent neurocomputational logic is fundamental to understanding how a brain functions.
Simulating the brain: While a computer-based simulation of the brain would be very useful, building the necessary model will require in-depth knowledge of how the brain operates. Should we attempt to build such a model of the brain although we currently do not even have the most superficial understanding of how the brain works? The Human Brain Project (Hill 2015, 113) research group that is endeavoring to create a Whole Brain Simulation believes that even identifying the data that are required and systematically categorizing the information that is available is a step in the right direction and a worthwhile contribution to the body of knowledge in the field of neuroscience.
Unfortunately much information is lacking. There are no comprehensive atlases available that identify those parts of the brain that have been mapped and those that have not been mapped. Currently available tools are inadequate for determining whether any particular test data are significant or irrelevant to understanding the functions of the brain. Many fundamental questions are still unanswered. For example, how many classes or types of neurons are there? To date researchers have identified a few hundred but suspect that there are thousands or perhaps even millions. As mentioned previously, the worm C. elegans was found to have 100 neuron types out of 302 neurons (White et al 1986). Foremost the Human Brain Project group is relying on advances in information management technology to classify and characterize the enormous volume of data that is being collected in the emerging discipline of neuroinformatics. For example: there are around 100,000 publications per year; a single human brain scan generates 1 terabyte (1000 gigabytes) of data; and, the Allen Institute produced more than 1 petabyte (1,000,000 gigabytes) of data in one year in one study to characterize mouse brain connectivity. At least four formidable challenges confront the Human Brain Project:
Challenge 1: Since it is unlikely that the human brain will ever be fully mapped it will be
approaches and methodologies.
Challenge 2: For whole brain simulation it will be necessary to build individual models of
the components such as proteins, neurons, synapses, circuits, and brain regions. This is more difficult then it seems at face value because the behavior of these individual brain components may vary based on how they are connected. In other words, the behavior of the whole may not be able to be extrapolated from the behavior of the parts.
Challenge 3: During all stages of its construction the whole brain model will need to be
validated by comparison with thousands of experimental test results and findings. Following the Open Source approach that has proven itself in computer software, it will be necessary to periodically release new versions of the whole brain model after it has been modified to resolve inconsistencies with recent experimental results and clinical evidence.
Challenge 4: The primary input to the brain is from our senses (i.e., vision, hearing, smell,
taste, and touch) and the primary output is the control of muscles and movement. Thus it will be necessary to provide a simulated body to couple with a simulated brain. Neither the European Common Market Human Brain Project7 nor the United States DARPA sponsored SyNAPSE project8 are in their present state able to couple with a human body simulation. Therefore, since these models do not have memory, movement or learning capabilities it is not possible to evaluate them in terms of what is arguably the purpose (i.e., output) of the brain.
Monitoring and Recording Techniques and Devices
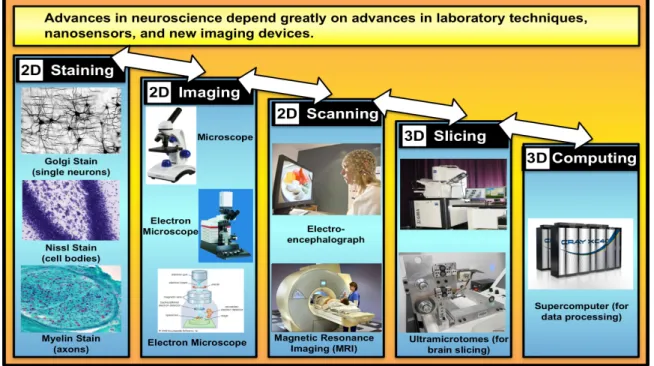
Advances in neuroscience have been largely made possible by developments in experimental laboratory techniques, innovative applications and extensions of existing devices, and the development of entirely new equipment, such as the electron microscope, with orders of magnitude greater capabilities. Existing techniques fall essentially into five categories (Figure 5): staining; imaging; scanning; slicing; and, computing.
Historically, the discovery of the Golgi Stain in 1873 by the Italian physician Camillo Golgi made neurons visible for the first time. It allowed the Spanish neuroanatomist Santiago Ramon y Cajal to identify and draw many types of neurons. Both Golgi and Cajal became Nobel laureates in 1906 in recognition of their contributions to neuroscience. The electron microscope invented by the German physicist Ernst Ruska in 1933 used electrons rather than light to produce orders of magnitude greater magnification and sharper images. In the 1950s the first two-dimensional images of synapses under the electron microscope showed that two neurons do not fuse at a synapse. At the same time dense staining methods showed the entangling of the branches of many neurons, confirming that brain tissue is packed full of neurons and their branches. However, these were still two-dimensional images.
Subsequent development of a sequence of innovative techniques, device extensions and the integration of computer processing allowed researchers to transition to three-dimensional imaging. The invention of the ultramicrotome in 1953 by Keith Porter and Joseph Blum (Porter and Blum 1953) allowed brain tissue to be cut into 50 nanometer thick slices that could be imaged and stacked into a three-dimensional model of bundles of neurons. Fifty years later the invention of the SBFSEM (Serial Block Face Scanning Electron Microscope) in 2003 by
7
https://www.humanbrainproject.eu/2016-overview 8
German physicist Winfried Denk (Denk and Horstmann 2004) overcame the problem of inevitable distortion during handling of the very thin slices. The SBFSEM consists of an ultramicrotome mounted inside the vacuum chamber of an electron microscope that captures a succession of block face images after each slice is cut.
Figure 5: Experimental recording techniques and devices
In the early 2000s the availability of computers allowed the processing of the large volume of data provided by stacks of two-dimensional brain slices. The invention of the ATUM (Automated Tape-collecting Ultramicrotome) by Ken Hayworth (Hayworth et al 2014) automated the stacking of two-dimensional brain slices on a plastic tape like a film strip. In collaboration with Jeff Lichtman they were able to reduce the thickness of slices from an initial 10 microns to 30 nanometers. While the ATUM is certainly a promising step towards addressing the challenge of processing the enormous volume of data produced by three-dimensional bundles of neurons, it may not be sufficient when we consider that one cubic millimeter of brain tissue can yield a petabyte of image data. For example, the reconstruction of the complete connectome
of C elegans during the 1970s and 1980s required the manual tracing of each neuron pathway
because there was no automated alternative for interpreting the images of the enormous number of 50 nanometer thick slices of brain tissue. The C elegans connectome, which has only 302 neurons, was published in 1986 (White et al. 1986). Based on this experience we can extrapolate that the manual reconstruction of just one cubic millimeter of the cortex of the human brain would take more than a million person-years. Clearly the future of connectomics depends on the ability to automate image analysis. However, this is a difficult task because it essentially relies on the ability of computers to recognize boundaries (i.e., edges) that are only vaguely defined on the two-dimensional image of each slice and even the most advanced computer software has difficulties performing this task (Seung 2015, 160-163).
Devices that are currently available for monitoring the electrical activity of neurons and imaging brain tissue include:
are used for recording the electrical activity of the brain, mostly non-invasively with electrodes placed along the scalp. They measure voltage fluctuations resulting from the flow of ionic currents in the dendrites of neurons during synaptic transmissions (i.e., neuron spiking). However, since the magnetic fields generated by the brain are very weak approximately 50,000 neurons must be active for a detectable magnetic field. The brain’s magnetic field strength of around 10 femtotesla (fT)9 for cortical activity is far below the ambient magnetic noise of 108 fT (or 0.1µ T) in an urban environment.
Magnetic Resonance Imaging (MRI): MRI is capable of imaging two-dimensional slices of
the brain. A stack of such two-dimensional images provides a means for reconstructing the brain in three dimensions. While it is useful for determining the size of brain regions, it produces poor spatial resolution. Also, MRI’s millimeter-scale resolution it is not enough for the discrimination of single neurons and axons (Seung 2013, 209).
Diffusion Magnetic Resonance Imaging (dMRI): dMRI maps the diffusion process of
molecules (mainly water) in biological tissue both in vivo and non-invasively. The first diffusion MRI images of the normal and diseased brain were made public in 1985. The primary clinical applications are in the study and treatment of neurological disorders such as stroke. Since dMRI allows non-invasive visualization of anatomical connections between different parts of the brain it represents a major breakthrough for human connectome research. While it is useful for tracing neuronal pathways and even computes the direction of the axon, the inherently poor spatial resolution of MRI makes it difficult to follow thin axon tracts if they cross. Nevertheless, dMRI is currently used by the Human Connectome Project to track white-matter pathways (Seung 2013, 209).
While efforts are underway to improve MRI technology, it should be noted that the current resolution of dMRI is 1000 times worse than light microscopy, which is a 100 times worse than electron microscopy. Since microscopy already delivers the resolution required for connectomics research and needs only to be scaled up to handle larger volumes of data and MRI improvements call for a major breakthrough, MRI and microscopy are likely for at least the time being to remain complimentary methods.
Functional Magnetic Resonance Imaging (fMRI): Developed in the 1990s, fMRI provides
images that indicate brain activity (in color) typically superimposed on a black-and-white MRI image of the brain. While showing which cell networks are active when a person performs a particular physical movement or thought process, it has temporal limitations because brain activation changes from moment to moment. Again, fMRI suffers from the same spatial resolution limitations that govern all current MRI-based imaging techniques.
Positron Emission Tomography (PET): The PET scan method is an imaging test that uses a
radioactive drug (i.e., tracer) that may be swallowed, injected or inhaled. In clinical applications PET scans with flurodeoxyglucose (FDG) as the tracer are used to indicate tissue metabolic activity in the exploration of cancer metastasis (i.e., spreading of cancer to other sites). In neuroscience research PET neuroimaging is used on the assumption that areas of high radioactivity are associated with brain activity (i.e., actually the flow of blood to different parts of the brain).
Individual-Particle Electron Tomography (IPET): IPET is a technique that allows
9
Femto is a prefix in the metric system of units that denotes a factor of 10-15. It is derived from the Danish word
determination of a high-resolution structure for a single molecule. Each particle from a tilt series of micrographs is tracked and then reconstructed into a three-dimensional density map using an iterative reconstruction algorithm (Zhang and Ren 2012). A University of California (Berkeley) research team led by Gang (Gary) Ren published the first high-resolution three-dimensional image of a DNA segment reconstruction using IPET in April 2016 (Ren et al 2016).
In-Situ Hybridization (ISH): ISH is a technique for mapping gene expression that uses probes
that bind to RNA within sectioned but intact brain tissue, thereby preserving spatial context. ISH was automated by Gregor Eichele and colleagues at the Max Planck Institute.
Two-Photon Microscopy: Two-Photon excitation microscopy is a fluorescence imaging
technique that allows imaging of living tissues up to about 1 millimeter in depth. It is a special variant of the multi-photon fluorescence microscope that uses red-shifted excitation light to excite fluorescent dyes. The method was pioneered by Winfried Denk at Cornell University in 1990 by combining the idea of two-photon absorption with the use of a laser scanner.
Promising Research Programs
Neuroscience is no longer a niche field but a major scientific endeavor. The US-based Society for Neuroscience has more than 40,000 members. On-going world-wide research funding is now estimated to be over $3 billion. Despite the limitations of the available research methods and the daunting scope of the data processing requirements, headway is being made through the application of innovative combinations of MRI imaging, electron microscopy, staining, stacking of nanoscale slices of brain tissue to construct three-dimensional models of neural groupings, and automated (i.e., computer-based) high throughput image interpretation techniques. The major advances are in the molecular area with increased understanding of the structure and function of ionic channels and receptors10 .
Digital atlases: Digital brain atlases are used to represent the spatial organization of neuronal structures, for planning and guidance during neurosurgery, and as a reference for interpreting gene expression (i.e., the structure and functions of proteins). Existing atlases are extensive and include to the extent possible with existing research techniques and devices partial mappings of the mouse, rat, rhesus macaque11, and human brain. In addition to atlases based on anatomy, histology, MRI, and PET scans, modern digital atlases use gene expression, connectivity, probabilistic and multi-modal techniques, as well as visualization software (Hawrylycz 2015). The development of large-scale brain atlases is now a major undertaking in neuroscience and there have been recent advances in neuroimaging techniques that are providing maps of remarkable resolution:
Brainbow: A combinatorial color labeling technique using fluorescent proteins. Josh
Sanes and Jeff Lichtman at Harvard University have been classifying and visualizing microscopic neurons by marking individual neurons with over one hundred distinct colors to trace and reconstruct their cellular structure (Lichtman et al. 2008).
10
The ionic channels and receptors function as switches and modulators in the membrane to control the processing of information by neurons, resulting in spikes along the axon and the release of neurotransmitters in synapses.
11
Array Tomography: Developed by Stephen Smith at Stanford University to classify
diversity in the synaptic code (Micheva and Smith 2007). Can also achieve combinatorial labeling of synaptic connections using an electron microscope.
High Resolution 3-D Microscopy: Culmination of the work of Katrin Amunts and the
Karl Zilles laboratory at Jülich (Germany) and Evans in Montreal (Canada), BigBrain is a dataset 125,000 times larger than a typical MRI. However, still not at the resolution of the finest structures in the brain (Amunts et al. 2013).
CLARITY: A method that subjects the brain to a three-dimensional network of
hydrophilic polymers and then removes the lipids from the brain by electrophoresis12 . The brain remains fully intact but optically transparent and macromolecule permeable. CLARITY uses intact tissue in-situ hybridization and immunohistochemistry with multiple rounds of staining and de-staining to visualize gene expression or protein binding.
EyeWire: Crowdsourcing project launched by Sebastian Seung of MIT to map the retinal
connectome through an interactive game (Johnson 2012).
The transition from printed to digital atlases has been revolutionary, since digital atlases allow navigation, three-dimensional reconstruction and visualization from the smallest nuclei to macro-scale regions of the brain.
Integrated mapping of the brain: Ideally projects focused on creating an integrated mapping of the brain should aim to include a sufficiently comprehensive set of data to convey an understanding of the brain’s biological structure and functions that interlink to form an integrated system. This would include: cell types (the distinct features of the different neuron types); cell networks (the circuitry architecture within and between neural groups (i.e., networks)); connections (the strengths and types of synaptic excitatory and inhibitory transmissions); pathways (from lowest level feature detectors to highest level neuron functions); histories of electrical activity patterns over time; and, histories of molecular changes over time.
Church et al (2015, 52-56), in drawing an analogy to the Rosetta stone13, have proposed in conceptual terms that the construction of a Rosetta Brain could be reduced to the two operations of labeling and counting. Their argument proceeds along logical lines as follows:
• A connectome is at its core a large matrix that indicates whether neuron A is
connected to neuron B to neuron n, where n is however a very large number.
• If each neuron could be given a unique barcode so that the children of neuron A have
the barcode of their parent (neuron A) included then we could easily trace synaptic chains (i.e., pathways).
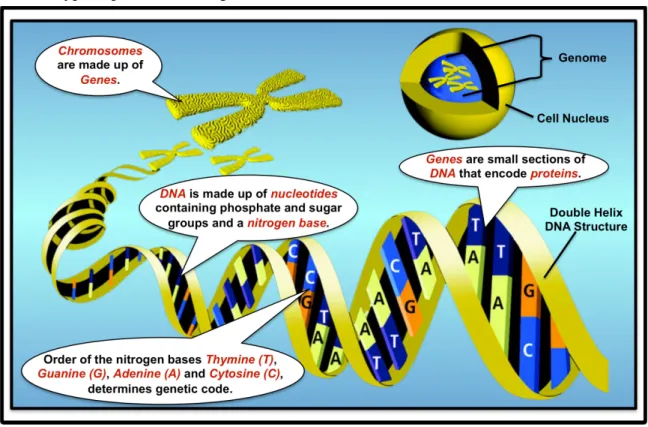
• Gene expression (i.e., DNA to messenger RNA (i.e., transcription) to protein (i.e.,
translation)) could be used to determine cell type by counting the numbers of each
12
In electrophoresis a sample is placed on one end of a gel consisting of a substance with a molecular matrix of evenly spaced opening. When an electric current is passed through the gel it moves the molecules in the sample through the gel. The rate at which the molecules move through the gel depends on both their size and their charge, with small molecules and charged molecules moving more quickly. The gel can be visualized under ultraviolet light to show DNA samples as bands.
13
messenger RNA in the neuron.
• Gene expression changes due to learning and memory in combination with time
stamps, could be used to track the history of molecular changes.
• On the assumption that the number of synapses influences the strength of a
connection, synaptic connection strengths and types could be inferred by counting the abundances of different proteins on either side of a synapse in combination with the number of distinct synapses between neuron A and neuron B.
Recognizing that DNA can be used to store any nitrogen bases string in addition to those used in the biological blueprint genome of an organism, they propose to generate and read barcodes by using the four nitrogen bases of nucleotide in the DNA (i.e., adenine (A), thymine (T), guanine (G), and cytosine (C)) to form barcode sequences (e.g., ATGC). There would be a sufficient number of unique barcodes because a DNA barcode of 25 nitrogen bases has 425 unique combinations and there are only about 423 synapses in the human brain (i.e., 1014 is approximately 423). They further argue that to make a test tube with all 425 unique combinations is not difficult and that to randomly insert one sequence into each of the 100 million neurons in the brain of a mouse is potentially feasible. To read these DNA sequences would then require the normal DNA sequencing process to be applied to brain slices using fluorescent dyes to distinguish between A,T,G and C.
Figure 6: Connectome – barcoding solution
modularity (six layers). The BOINC14 approach (Figure 6) utilizes the high-throughput DNA sequencing technology originally developed for sequencing the human genome. It proposes to overcome three challenges in very innovative ways:
Challenge 1: How to express a unique sequence of DNA (i.e., a DNA barcode) in each
neuron of the neuronal circuit? Approach: Breeding a laboratory mouse that is
engineered with: (a) a specific sequence of DNA inserted into a known location on a chromosome that is scrambled randomly in each neuron; and, (b) a transiently expressed special Recombinase protein.
Challenge 2: How to induce each neuron to share copies of its barcode with each
connected neuron? Approach: Using a virus such as the pseudorabies virus ((PRV) that
is essentially a core of DNA wrapped in a protein coat. PRV unlike most viruses propagates from neuron to neuron across the synaptic cleft, thereby carrying the DNA sequence with it. However, the DNA is inverted between any pair of Recombinase sites.
Challenge 3: How to join pre-synaptic and post-synaptic barcodes into a single molecule
for high-throughput DNA sequencing? Approach: Express a specialized protein called an
integrase, which irreversibly joins the DNA at the sites forming a single piece of DNA
out of two. By positioning the barcode sequence near the integrase sites it can be ensured that the single piece of DNA contains two barcodes in sequence. The joined barcodes are then sent to a high throughput sequencing machine for processing.
The advantages of the BOINC approach are that it is relatively inexpensive15 and that its error rate does not increase with the length of the synaptic chain (i.e., pathway) even if there are millions of neurons involved. However on the negative side, it does not include any spatial representation and provides no indication of whether a neuron is excitatory or inhibitory because it cannot differentiate between cell types.
Whole brain neuroimaging: A team comprised of Ahrens, Engert, Keller and others at the Howard Hughes Medical Institute (Ashburn, Virginia, USA) has developed an experimental microscopy technique for the holistic study of the sensorimotor system of the zebrafish, with the ability to simultaneously record about 80,000 of the total 100,000 neurons (Ahrens et al. 2012). They partially paralyzed the zebrafish so that only the connections between the neurons and the muscles are inactive. This allows the neural commands to the muscles to be recorded while the brain is stationary and the zebrafish is exposed to a virtual reality environment displayed underneath them using a video projector.
Using the fluorescent protein technique (i.e., staining) the researchers are able to track the activity of some 80,000 neurons at the rate of several times per second. Nevertheless, the question remains how to make sense of the enormous volume of data collected? For example, one neuron may simply reflect the activity level of another. They identified groups of neurons that appeared to be active together at some points in time and inactive at others, and found these groups to have a well defined anatomical structure (e.g., six tightly packed and symmetrically arranged clumps of neurons). However, why these neuron groups appeared to be tightly communicating remains unknown. In a broader sense, how do large groups of neurons coordinate to represent a feature of the visual environment, or how does
14
The BOINC acronym stands for Barcoding Of Individual Neuronal Connections.
15
the entire brain respond to a signal that suggests the presence of food and guide the zebrafish to food?
Recording many neurons simultaneously: Until now the recording of neuron activity has been restricted to either measuring the activity of one neuron at a time or measuring the aggregate activity of entire networks of thousands to millions of neurons. Recent reports in the literature suggest that researchers may be on the threshold of being able to concurrently measure the individual activities of several hundred neurons and that further significant increases in the number of concurrent recordings may be on the horizon (Shenoy 2015, 78). While the action potential and chemical activity (e.g., neurotransmitters and ion concentrations) of individual neurons has been measured with intracellular and extracellular electrodes, the aggregate activity of neural networks has been recorded with EEG, MEG and fMRI facilities. Some of these techniques have now scaled up and new techniques are being developed. For example genetically encoded calcium indicators (GCaMP) allow calcium concentration changes due to action potential to be optically imaged in thousands of neurons simultaneously (Ahrens 2015). Traditional electrode approaches for measuring the activity of single neurons have also scaled up to hundreds of neurons with electrode arrays (Shenoy 2015, 79-81). However, there remain at least two serious obstacles that need to be overcome before the simultaneous recording of much larger numbers of neurons can be realized.
First, there is the need to analyze the parallel data from thousands of neurons. As our knowledge of brain operations increases we must expect the discovery of additional variables (e.g., cell type, axon and dendrite projection patterns, synaptic connection strength) that will need to be recorded and a much greater increase in the combinations of these variables due to interdependencies. By comparison, it would be a far easier undertaking to try to gain an understanding of how a computer functions by measuring the electrical activity of its millions of transistors simultaneously. It is doubtful that such an undertaking would lead to more than a superficial understanding of computer operations even though there are no concurrent chemical processes involved in a computer and the number of connections between transistors is far fewer than there are synapses in the brain.
Second, there is the question of degree of importance of the individual variables and their relationships. A further complication could arise if it were to be found that the influence of specific combinations of variables becomes relevant only under certain circumstances that are related to the particular task undertaken by the brain. For example, whether the degree of synaptic strength is an important factor in the movement of a limb may depend on the cause of the movement rather than the accomplishment of the movement task.
Hypothetical Explanations
several neurons in other networks apart from activating the connected cells in its own assembly of cells.
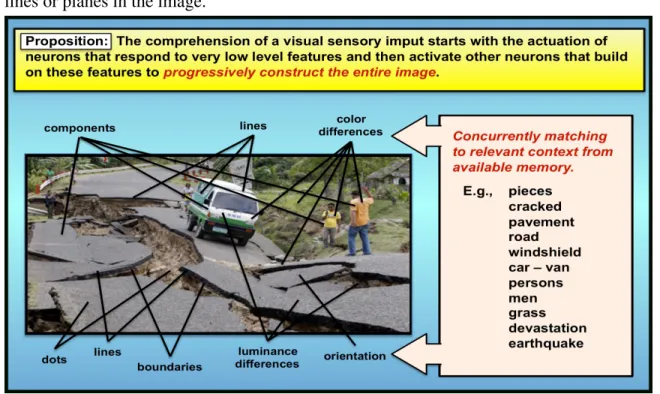
Hypothesis 1 - Comprehension through the assembly of parts: According to this
proposition the comprehension of, for example, a visual sensory input such as the scene shown in Figure 7 starts with the activation of neurons that respond to very low level properties of the image such as the luminance of one or more distinct areas or dots or lines or planes in the image.
Figure 7: Comprehension through hierarchical feature detection
The firing of these neurons will activate other connected neurons that respond to other features that may or may not build on the partial interpretations of the previous level neurons, and so on. With each successive level of response the comprehension of the whole image becomes more complete and the contribution of the next level builds more and more on the cumulative results of the previous levels. Throughout this process involving millions of neurons in thousands of subnets there will be not only excitatory but also inhibitory neuron responses. It is in this way that the evolving comprehension of the image is continuously challenged, rejected or validated, and fine tuned. At lower levels these challenges and validations are likely to involve factors that are based more on conditioned (subconsciously acquired) experience, while at higher levels conscious memory might be expected to play an increasing role.
Along the way individual neurons will receive and/or send both excitatory signals and inhibitory signals. While the excitatory signals indicate agreement with the current path to comprehension, the inhibitory signals indicate disagreement. This means that along the entire hierarchy from the lowest to the highest level there are many decision points that will influence the final comprehension of the whole. This process is based on the following hypothetical rules (Figure 8) for which there exists some experimental evidence but not enough for definitive validation (Seung 2013, 62-75):
1. A neuron that detects a ‘whole’ receives excitatory synapses from neurons
that detect its parts.
This rule applies to how higher level neurons in the hierarchy of a network receive signals from lower level neurons. In the opposite direction the following rule would govern how a neuron sends signals to one or more higher level neurons.
2. A neuron that detects a part (i.e., something that it has been conditioned to
recognize) sends excitatory synapses to higher level neurons thereby contributing to the comprehension of the ‘whole’.
For example, the comprehension of a person in the visual field could start with outlines of one or more limbs such as the head, arms, or legs. At higher levels the limbs are combined into a human body and particular details such as the face, clothing, color, and posture, are added depending on the distance of the person from the beholder and the nature of the interaction. At the
higher levels recognition of the person as a known acquaintance would be triggered by connections to other networks that respond to particular persons or other associated memories. If the person is located close to the beholder then the comprehension sequence may start immediately with primitive features of the face, lips or eyes (e.g., pupil, iris, white, and
blue leading to blue eyes). Figure 8: Hypothesis 1 – Potential Formal Rules
In this case the visual stimuli are likely to occur simultaneously with any auditory stimuli that would be processed concurrently by other networks of neurons from primitive sound elements to speech, to language, to meaning, to relevant knowledge. Seung (2013, 68) suggests that this leads to a third rule:
3. The function of a neuron is defined chiefly by its connections to other neurons.
Hypothesis 2 – Ability to retain information in memory: It has been generally agreed for
living during that year, what was my principal occupation, who were my closest friends, and so on? One or more of these related information items would likely eventually lead into a line of thought that would allow me to recall some of the particulars about that time period in my life.
It appears that the connectivity of cells in networks of networks is the basis of memory. If this is true then the focus of our
attention in determining how the brain forms memories must be on the plasticity of synapses, in respect to: how are cell assemblies formed; how is the strength of a synapse increased or decreased; how is the action potential of a neuron increased or decreased; what role (if any) does ordering in time play; to what extent is repetition a factor; and, can new
connections be formed? Figure 9: Hypothesis 2 - Memory
In respect to repetition it has been proposed (Figure 9) that we learn to associate ideas when one idea repeatedly accompanies or succeeds another. This has led to the following rule of plasticity:
1. If neuron A and neuron B are repeatedly simultaneously activated, then the
connections between them are strengthened in both directions.
A similar rule has been proposed for our ability to learn sequential ideas (Hebb 1949):
2. If neuron A and neuron B are repeatedly activated sequentially, then the
connection from neuron A to neuron B is strengthened.
Both of these rules have become known as the Hebbian rules of plasticity and are applicable only to synapses between excitatory neurons. In his 1949 book (The Organization of Behavior) Hebb
also proposed that neurons are connected in cell assemblies. Since the 1950s it has been possible to measure the spiking strength of a neuron by inserting a glass electrode with an extremely sharp tip into a single neuron. In the 1970s it became possible to measure changes in synaptic strength by repeatedly stimulating the spiking of two connected
neurons. Figure 10: Hypothesis 2 – Process of forgetting