THE REGULATION OF GENE EXPRESSION PROFILES IN CLEAR CELL RENAL CELL CARCINOMA BY TUMOR HETEROGENEITY AND
ENVIRONMENTAL EXPOSURE
Samira A. Brooks
A dissertation submitted to the faculty of the University of North Carolina at Chapel Hill in partial fulfillment of the requirements for the degree of Doctor of Philosophy in the Curriculum of
Toxicology in the School of Medicine.
Chapel Hill 2015
Approved by:
W. Kimryn Rathmell
Rebecca Fry
Charles Perou
Stephanie Padilla
ABSTRACT
Samira A. Brooks: The regulation of gene expression profiles in clear cell Renal Cell Carcinoma by tumor heterogeneity and environmental exposure
(Under the direction of W. Kimryn Rathmell)
Currently, the disease management and therapeutic strategies for renal cell carcinoma
(RCC) have arisen from cancer biology discoveries, but have evolved fairly independently of
individual tumor biology. Thus, a gap has emerged in our understanding of the fundamental
paradigms of what core molecular features are important for tissue based biomarker research
today. Although extensive effort has been placed on identifying molecular biomarkers for
RCC, remarkably, there are few validated biomarkers with substantive impact on managing
disease prognosis. The emergence of high-throughput molecular profiling technologies
provides the opportunity to explore the underlying molecular features of RCC that will
warrant the enhanced understanding of its biology and shed light on future therapeutic
methods to treat the disease.
Identifying molecular biomarkers that provide insight towards biological processes,
pathogenesis, and response to therapeutics has been at the forefront of current research. The
cancer biology field has focused especially on this area in hopes of further understanding the
molecular aberrations that contribute to disease development and progression. Prognostic
biomarkers are also needed for making personalized treatment decisions, particularly at a
time when adjuvant and neoadjuvant options are becoming the mainstay of therapy for many
biomarkers that are indicative of disease progression and aggressiveness can improve patient
treatment and survival.
In this dissertation, novel gene expression signatures for the predominant subtype of
RCC, clear cell Renal Cell Carcinoma (ccRCC), are validated as imperative prognostic
signatures, whose underlying biology is driven by distinct metabolic pathways. Furthermore,
environmental exposures to the heavy metal Cadmium, alters the kidney genome and
epigenome that may influence the kidney to develop into these ccRCC subtypes and thus
impact patient prognosis. These biomarkers of ccRCC have the potential to have an
impression on the clinical arena and can be used for assessing prognostic and predictive
ACKNOWLEDGEMENTS
The continuous support from family and friends has facilitated my progress and growth
through graduate school, as well as gave me the strength to successfully defend my doctoral
thesis. I love you all and thank you for making me believe I can achieve anything.
I would like to extend my gratitude towards my mentor Dr. W. Kimryn Rathmell who
allowed me to join her lab and had faith in me to lead a project in which I had little
background and expertise. You have made me a well-rounded scientist that will be equipped
to take on any career path I choose. Thank you for all your support and mentorship.
I would also like to thank my committee members Dr. Rebecca Fry, Dr. Charles Perou,
Dr. Stephanie Padilla, Dr. Joel Parker, and Dr. Mathew Nielsen for your advice and ideas that
have substantially improved my critical thinking skills. Thank you Dr. Joel Parker for being
an exceptional co-mentor and for having the patience to teach me bioinformatics and answer
my numerous questions. Dr. Rebecca Fry and Dr. Stephanie Padilla thank you for your
willingness to always offer assistance and expertise to my projects.
The Rathmell lab past and present members made research enjoyable, and offered
support and feedback for both personal and scientific issues. Thank you for being my second
family. Finally, I would like to thank the BBSP, IMSD, IME, and the curriculum in
Toxicology faculty and staff who offered professional and personal support throughout my
TABLE OF CONTENTS
LIST OF TABLES ... ix
LIST OF FIGURES ... x
LIST OF ABBREVIATIONS ... xii
CHAPTER 1: INTRODUCTION ... 1
Clear cell Renal Cell Carcinoma ... 1
ccRCC Prognostic Biomarkers ... 3
CHAPTER 2: Clearclode34: A prognosic risk predictor for localized clear cell Renal Cell Carcinoma ... 33
Introduction ... 33
Results ... 37
Discussion ... 46
Conclusions ... 47
Patients and Methods ... 47
Methods ... 52
CHAPTER 3: Alternate metabolic programs define regional variation of relevant biological features in Renal Cell Carcinoma progression ... 54
Introduction ... 54
Discussion ... 65
Methods ... 66
CHAPTER 4: Cadmium exposure influences ccRCC heterogeneity through epigenetic mechanism ... 72
Introduction ... 72
Results ... 74
Discussion ... 82
CHAPTER 5: Summary and discussion ... 89
Summary ... 89
Discussion ... 92
Appendix ... 96
Chapter 2 ... 96
Chapter 3 ... 114
LIST OF TABLES
Table 1.1: Prognostic and predictive markers in ccRCC ... 19
Table 2.1: Expression of ClearCode34 ... 35
Table 2.2: Patient Demographics and Clinical Characteristics of TCGA Cohort ... 38
Table 2.3: Patient Demographics and Clinical Characteristics of Clinical Cohort ... 41
Table 4.1: Patient demographics and clinical characteristics. ... 75
Table 4.2: Quantity of patient samples used for microarray, DNA methylation, and mass spectrometry analysis. ... 78
Table 2.1A: 121 gene list used to identify 34-gene ccRCC classifier. ... 97
Table 2.2A: Models of Recurrence-free Survival. ... 98
Table 2.3A: TCGA sample classification determined by PAM. ... 99
Table 2.4A: PAM classification of Clinical cohort. ... 109
Table 3.1A: Demographics of patients used in MRI/PET-FDG study. ... 116
LIST OF FIGURES
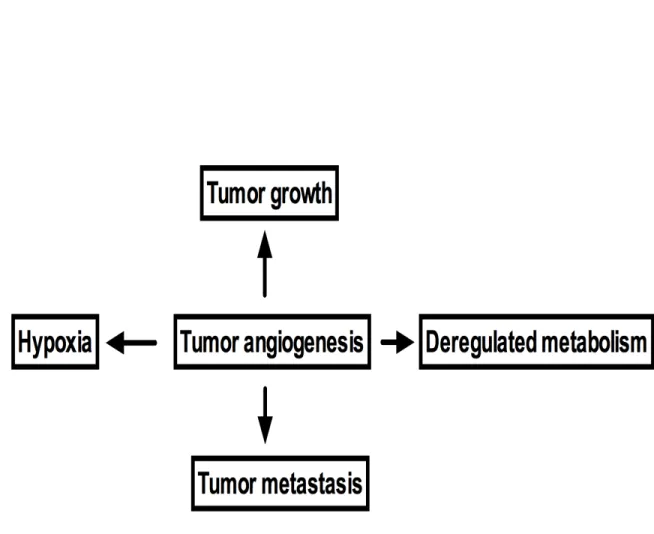
Figure 1.1: Examples of interaction of tumor angiogenesis with tumor
microenvironment. ... 6
Figure 1.2: VEGFR/VEGF and TF/fVII signaling pathways as
prioritized targets in tumor angiogenesis. ... 11
Figure 2.1. Workflow for biomarker discovery and order of analyses. ... 36
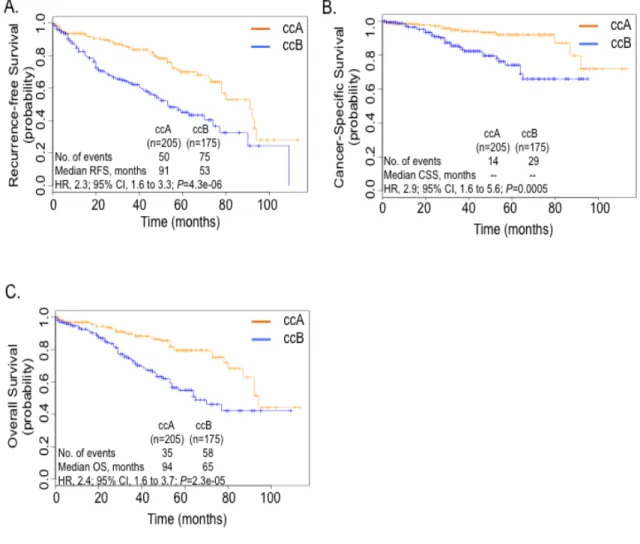
Figure 2.2: Tumor classification from TCGA shows distinct prognostic
outcomes. ... 39
Figure 2.3: ccRCC classifier recapitulates survival outcomes for
subtypes in clinical cohort. ... 42
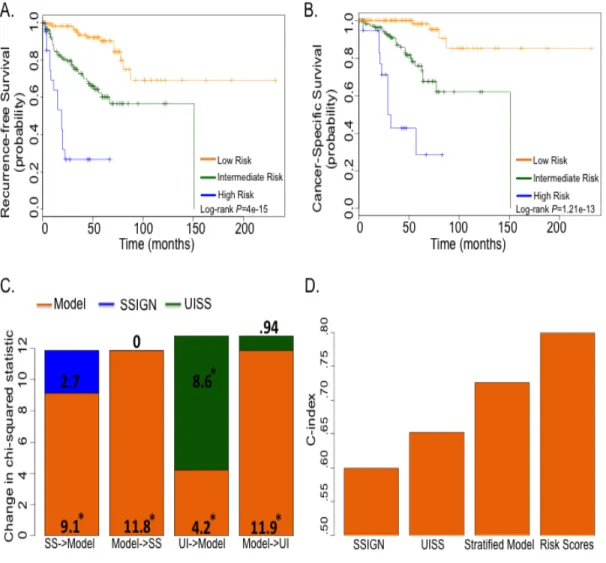
Figure 2.4: ClearCode34 prognostic model can evaluate patient risk. ... 45
Figure 3.1: PET/MR imaging characterizes heterogeneous regions
of ccRCC that correlate to tumor biology. ... 56
Figure 3.2: PET dichotomizes ccRCC subtypes by metabolic activity. ... 59
Figure 3.3: ccRCC subtypes are involved in distinct metabolic
pathways. ... 61
Figure 3.4: Distinct pathways support ccRCC metabolism. ... 64
Figure 4.1. ccRCC subtypes express distinct DNA methylation
profiles.A………. 76
Figure 4.2: Cadmium concentrations correlate with smoking status. ... 79
Figure 4.3: ccRCC poor prognostic marker associated with increased
cadmium. ... 81
Figure 4.4. Cadmium exposure alters epigenome of primary kidney
Figure 4.5: HKC cells half maximal inhibitory concentrations of
cadmium. ... 85
Figure 2.1A: Quality analysis of NanoString gene expression data. ... 96
Figure 3.1A: Clear cell A and B subtypes obtain energy through
distinct metabolic pathways. ... 118
Figure 3.2A: ccRCC subtypes have intra-tumor genomic similarities. ... 119
LIST OF ABBREVIATIONS
ACACA acetyl-CoA carboxylase alpha
ACO2 aconitase 2
AKI acute kidney injury
ALDOB fructose-bisphosphate aldolase B
AMPK AMP-activated protein kinase
ARNT aryl hydrocarbon receptor nuclear translocator
BAP1 BRCA1 associated protein-1
CAF cytokine and angiogenic factor
CAIX carbonic anhydrase 9
ccA clear cell A
ccB clear cell B
ccRCC clear cell Renal Cell Carcinoma
Cd Cadmium
Cdcl2 cadmium chloride
CI confidence interval
CO2 carbon dioxide
CS cigarette smoke
CSS cancer-specific survival
DLD dihydrolipoamide dehydrogenase
DNA deoxyribonucleic acid
ENO1 alpha-enolase
FAIRE formaldehyde-assisted isolation of regulatory elements
FASN fatty acid synthase
FBP1 fructose 1,6 biphosphase 1
FBS fetal bovine serum
FDA Food and Drug Administration
FDG fluoridated 2-deoxyglucose
FFPE formalin-fixed paraffin embedded
G6PC glucose-6-phosphatase
G6PD glucose-6-phosphate dehydrogenase
GLUT1 glucose transporter 1
GRB2 growth factor receptor-bound protein 2
HIF hypoxia-inducible factor
HIF1A hypoxia-inducible factor-1alpha
HIF2A hypoxia-inducible factor-2apha
HK3 hexokinase 3
HKC human kidney cell
HR hazard ratio
IAP inhibitors of apoptosis
IARC International Agency for Research on Cancer
IC50 half maximal inhibitory concentration
IMP3 U3 small nucleolar ribonucleoprotein
JMJD1A Jumonji domain-containing protein 1A
LAD logical analysis of data
LDH lactate dehydrogenase
MAPK mitogen-activated protein kinases
ME1 malic enzyme 1
miRNA micro ribonucleic acid
MRI magnetic resonance imaging
mRNA messenger ribonucleic acid
MT metallothinein
MTF1 metal regulatory transcription factor 1
mTOR mammalian target of rapamycin
NADPH nicotinamide adenine dinucleotide phosphate
OS overall survival
PAM prediction analysis for microarray
PBRM1 protein polybromo-1
PCK1 phosphoenolpyruvate carboxykinas 1
PCK2 phosphoenolpyruvate carboxykinase 2
PDGF platelet-derived growth factor
PDK2 pyruvate dehydrogenase lipoamide kinase isozyme 2
PDK4 pyruvate dehydrogenase kinase
PECAM platelet-endothelial cell adhesion molecule
PET positron emission tomography
PFKM phosphofructokinase muscle
PFS progressive-free survival
PGD phosphogluconate dehydrogenase
PGK1 phosphoglycerate kinase 1
PGLS 6-Phosphogluconolactonase
PI3K phosphatidylinositol 3-kinase
PKD Proteinase K digest
PKLR pyruvate kinase isozymes R/L
RCC Renal Cell Carcinoma
RFS recurrence-free survival
RHEB Ras homolog enriched in brain
RNA ribonucleic acid
ROS reactive oxygen species
SAM significance analysis of microarrays
SDHB succinate dehydrogenase complex subunit B
SDHC succinate dehydrogenase complex subunit C
SETD2 SET domain containing 2
SHC Src homology 2 domain-containing
shRNA small hairpin RNA
SSIGN ` Mayo Clinic Stage, Size, Grade, and Necrosis score
SUV standard uptake value
TCGA The Cancer Genome Atlas
TKT transketolase
TMA tissue microarray
UISS UCLA Integrated Staging System
uM micromolar
UTR untranslated regions
VEGFA vascular endothelial growth factor alpha
VEGFR vascular endothelial growth factor receptor
CHAPTER 11,2: INTRODUCTION
Clear cell Renal Cell Carcinoma
The incidence of adult Renal Cell Carcinoma (RCC), or kidney cancer, is on a steady
rise in the western world. In the U.S, kidney cancer is the sixth leading cause of cancer
among men and the eighth among women[3]. There are multiple subtypes of this disease,
however, over 70% of patients with renal tumors have the clear cell (ccRCC) subtype, a
tumor postulated to arise in the proximal tubules and is associated with chromosome 3p
deletions and inactivation of the Von Hippel-Lindau (VHL) tumor suppressor[4]. VHL
mutations lead to the stabilization of hypoxia-inducible factors (HIFs) and thus the activation
of the hypoxia pathway, a response that promotes cancer cell survival through increases in
angiogenic growth factor production and metabolic reprograming of cellular glucose and
energy metabolism [5]. Even with advances in elucidating the underlying molecular biology
of ccRCC, the metastatic setting of this disease remains with no curative therapy options;
leaving patients with a median survival range of 10-26 months, even using the best
therapies[6]. Exploring the underlying molecular features of ccRCC will warrant the
enhanced understanding of its biology. Thus, a novel clinically applicable classification and
prognostic tool to identify two subtypes of ccRCC, clear cell A (ccA) and clear cell B (ccB),
was elucidated and validated[7]. This 34-gene expression signature (ClearCode34) is
1 Adapted fromBrooks, S.A. & Rathmell, W.K. (2014) Uniting Molecular Biomarkers to Advance the Science and Care of Clear Cell Renal Cell Carcinoma. The Journal of OncoPathology 1, 45-54.
expounded on in Chapter 2 and can be used as a prognostic tool to assess progression risk for
this cancer that has no optimal treatment for metastatic disease.
The majority of ccRCC patients presents with localized Stage I-III disease, with partial
or complete nephrectomy being efficient for tumor removal[8]. However, around 17% of
ccRCC patients will have metastatic disease and one-third will recur within the first five
years following surgery. ccRCC metastases usually develop in the bone, brain, and lungs[9],
all having variable survival outcomes. Few therapeutic options are available for these
patients due to disease resistance to chemotherapy and radiation, so targeted treatment to the
vascular endothelial growth factor receptor (VEGFR) is the predominate treatment option[8].
Some metastatic patients can also be treated through metastasectomy, surveillance, and high
dosing of interleukin-2. Nonetheless, primary tumor features have little to no application
towards the prognostics of metastatic disease and accurate tools are increasingly needed that
predict response to therapy, progression-free and overall survival.
VEGFR inhibitors Sunitinib, Bevacizumab, and Sorafenib have been used
independently, as well as in combination with interferon-alpha to treat metastatic ccRCC, but
changes in tumor response and survival are not strong enough to make this the mainstay of
therapy[9]. Interestingly, these treatments are recommended as first-line therapy options in
international treatment guidelines for metastatic patients. Temsirolimus and Everolimus, two
mTOR kinase pathway inhibitors, are also recommended as first and second-line treatment
options to combat the deregulated metabolic activity of the disease[9]. Further research and
clinical trials are ongoing to determine which therapeutic options and timing of
facilitate the development of more efficient therapeutics and clinicians with determining the
optimal treatment for their patients to improve prognostics.
ccRCC Prognostic Biomarkers
Increasingly, genetic markers and signatures of cancer are being explored to define
changes to the transcriptome that expand the knowledge of tumor state, progression
characteristics, and response to therapy[10]. The oldest prognostic variables for ccRCC are
pathologic stage, lymph nodes status, and histologic grade. While the most established
biomarker is inactive VHL, which allows HIF stabilization, with tumors expressing HIF2A
associated with a poor prognosis compared to tumors expressing both HIF1A and 2A[11]
[12], however, this effect is modest, and has not found clinical traction. In addition to
individual markers, gene signatures have been revealed through whole genome expression
profiling to identify discrete and global changes in transcript expression. Recently, two
subtypes of ccRCC, ccA and ccB, were identified, and these biologically defined tumors
were associated with a striking difference in overall and cancer specific survival[13, 14]. In
my work, I adapted the signature to a core set of genes measurable in crude lysates prepared
from formalin-fixed paraffin embedded (FFPE) tissue, as well as high-throughput mRNA
transcriptomic data, verifying the two predominant gene expression patterns, and creating a
prognostic algorithm that can be applied widely to clinical specimens[7]. Although the new
recognition of intratumoral heterogeneity of ccRCC raises a challenge for identifying and
validating genetic biomarkers, my data shows stable core gene expression patterns across
tumors suggests expression profiles could be instrumental for personalized disease
VHL and HIFs
The gene mutation events most commonly associated with a cancer type often provide
the most clear-cut molecular tools for discriminating between heterogeneous disease subsets.
In ccRCC, this event is the loss of function of the von Hippel-Lindau (VHL) tumor
suppressor gene through deletion, mutation, or hypermethylation and is the oldest and most
frequent hallmark of clear cell RCC (ccRCC)[15] [16]. Evidence of VHL gene perturbation
can be identified in as many as 92% of renal tumors [17]. It has been postulated that VHL
loss is an initiating event for ccRCC, however, sufficient data is still lacking to associate
VHL status to prognostic outcomes. There are conflicting studies that show the clinical
implications of VHL mutation or loss, and this potential biomarker is challenged by the
diversity of mutant alleles, challenges in it’s analysis owing to a highly GC-rich region in
exon 1, as well as the high frequency of association with this event with ccRCC tumors.
However, downstream factors that are dysregulated as a result of VHL loss, such as the
hypoxia inducible factors (HIFs) and their targets have been shown promise as biomarkers.
The HIF family of transcription factors (notably, HIF1A and HIF2A) are stabilized
following the inactivation of VHL, which allows these proteins to engage a co-factor HIF1B
(also known as the aryl hydrocarbon nuclear transporter, ARNT) for translocation to the
nucleus. Here, these transcription factors avidly promote the expression of genes involved in
numerous cancer promoting activities, such as angiogenesis, invasion, and metastasis
[18-22]. It has been established that HIF1A and HIF2A both play a role in ccRCC pathogenesis
through these mechanisms, but by inducing the expression of distinct target genes [23]. In vitro studies using HCT116 and 786-0 cells that overexpress HIF1A and HIF2A,
further observed that ccRCC tumors expressing HIF2A alone had c-myc-dependent
proliferation, compared to tumors wild type for VHL or expressed both HIF1A and HIF2A
that exhibited enhanced MAPK and mTOR signaling, with decreased levels of
phosphorylated histone H2AX [25]. The strict observation that tumors could be categorized
into three groups based on features of HIF expression (wild type VHL tumors, which lack
HIF overexpression, H1H2 indicating expression of both HIF1A and HIF2A, and H2 for
tumors expressing only HIF2A) paved the way for these profiles to serve as molecular
biomarkers for classification of primary renal tumors.
How tumors harboring a VHL mutation come to express only one or both factors is still
under investigation. HIF1A is located on chromosome 14q, in a region that is frequently lost
in ccRCC. Recently, it has been observed through high-density single-nucleotide
polymorphism arrays that kidney cancer has a higher frequency of 14q deletions compared to
other cancers and includes focal deletions located within the HIF-1a locus [26]. This same
group further demonstrated that expressing HIF1A in HIF1A null renal cell carcinoma cell
lines inhibited cell proliferation, while suppression of HIF1A by shRNAs in lines known to
express HIF1A and HIF2A increased proliferation and xenograft growth. In all, these results
implicate the reverse roles of HIF1/2A: the novel characterization of HIF1A as a tumor
suppressor in ccRCC and HIF2A as the oncogenic tumor promoter. Additional studies are
needed to establish the prognostic value of HIF profiling and therapeutic potential of
CAIX
CAIX (cG250), a downstream marker of inactive VHL, is transcriptionally regulated
by HIF1A. CAIX is not expressed in normal kidney, but is highly expressed in the majority
of ccRCC tumors, where this marker has been associated with improved outcomes [27]. To
evaluate the prognostic value of CAIX expression in RCC, a tissue microarray of 228 RCC
patients was examined for protein levels of CAIX. Significantly higher expression of CAIX
(p<0.001) was measured in ccRCC compared to papillary and chromophobe RCC [27].
Stratified groups of patients with higher CAIX expression had more favorable prognosis
compared to patients with low CAIX expression. CAIX has also been examined in
correlation with VHL status [28]. Increased CAIX expression was found in tumors with
VHL mutations compared to those without VHL mutations (p=0.02). In addition, longer
progression-free (p=0.037) and disease specific (p=0.001) survival was associated with high
CAIX expression and mutated VHL. Furthermore, univariate analysis of Ki67 (high staining)
and carbonic anhydrase IX (CAIX) (low staining) revealed significant association with
overall survival [29]. Multivariate analysis revealed that high Ki67 (p=0.014) and low CAIX
(p=0.009) were significant predictors of disease specific survival and when combined into a
single parameter could stratify tumors into risk groups. Finally, this tumor feature has been
examined in a clinical trial testing the utility of a cG250 antibody adjuvant therapy. Only
patients with the highest level of CAIX staining showed benefits to treatment, indicating the
novel use of this marker to provide prognostic or predictive information is on the horizon
VEGF and PDGF
Tumor growth and metastasis require angiogenesis to increase blood supply and recruit
activating cells. Angiogenesis is tightly controlled by diverse subsets of ligands and
receptors. Enrichment of ligands including growth factors, chemokines, cytokines, and
endogenous angiogenesis inhibitors has been extensively observed in extracellular matrix
(ECM) during vascularization. As tumor enlarges, hypoxia and nutrient deprivation occur
and upregulate the expression of hypoxia inducible factor 1 alpha (HIF1A), VEGF-A,
VEGFR-1, angiopoeitin-2 (Ang2), fibroblast growth factor-3 (FGF-3), nitric oxide synthase
(NOS), and transforming growth factors (TGF-α, TGF-β1, TGF-β3) [31].
The vascular endothelial growth factor (VEGF) and its receptors, as well as
platelet-derived growth factor (PDGF) has been established as key promoters of vascular bed
expansion [32] and are aberrantly expressed in RCC. Sunitinib, a potent tyrosine kinase
inhibitor of VEGFR 1-3 and PDGF-a/b, has shown strong antitumor properties [33], which
have been validated in phase I, II, and III clinical studies [34]. A 2003 phase II study
involving sixty-three RCC patients that received prior cytokine therapy of either
interferon-alpha alone, interleukin-2 alone, or both interferon interferon-alpha and interleukin-2 revealed a partial
response and stable disease for three or more months in 40% (95% CI, 28-53%) and 27% of
patients following administration of sunitinib, respectively [35]. A complete or partial
response was observed in 6% of patients treated with cytokine therapy only. A subsequent
phase III study revealed the efficacy and safety of sunitinib as a first-line therapy for
metastatic RCC compared to interferon alfa [36]. 750 metastatic RCC patients without prior
systemic treatment received either repeated 6-week cycles of sunitinib or interferon alfa.
a higher objective response rate (31% vs. 6%, p<0.001) and better quality of life (p<0.001)
was associated with sunitinib compared to interferon alfa, validating that sunitinib is an
effective therapeutic strategy for the treatment of metastatic RCC. Studies are ongoing to
identify predictive markers to assess clinical outcomes for sunitinib treatment [37, 38].
Predictive biomarkers for sorafenib and pazopanib, two additional tyrosine kinase
inhibitors that target VEGFR and PDGF, have been effective in determining outcomes in
metastatic cancer. Univariate and multivariate analysis confirmed serum VEGF levels were
prognostic for overall survival (OS) and progression-free survival (PFS) in second-line
treatment of sorafenib in 903 patients from the Treatment Approaches in Renal Cancer
Global Evaluation Trial (TARGET) study [39]. However, no direct link was established
between sorafenib treatment and VEGF levels for OS since significant correlation between
VEGF and overall survival for patients that received sorafenib were only revealed after
censoring post-cross-over placebo patients. Recently, chromosome copy number variations
were significantly associated with clinical outcomes in metastatic ccRCC patients treated
with sorafenib, sunitinib, or bavacisumab [38]. In addition, a phase II and phase III trial was
used to evaluate cytokine and angiogenic factors (CAFs) as prognostic biomarkers for
pazopanib treatment [40]. Interleukin 6, interleukin 8, hepatocyte growth factor, tissue
inhibitor of metalloproteinases (TIMP)-1, and E-selectin were identified as candidate
markers in a screen of 129 pazopanib-treated patients from a phase II trial with the greatest or
least tumor shrinkage and confirmed to be associated with tumor response and PFS in 215
patients from the same trial. Furthermore, interleukin 6, interleukin 8, osteopontin,
patients from a randomized, placebo-controlled, pazopanib phase III study. These studies
provide potential predictive markers beyond established clinical parameters for assessing
Figure 1.2: VEGFR/VEGF and TF/fVII signaling pathways as prioritized targets in tumor angiogenesis.
The diagram shows VEGF produced by tumor cells binds to VEGFR on vascular endothelial cells to activate VEGF signaling pathways in tumor angiogenesis. In addition, VEGF binding to endothelial cells can induce TF expression, an angiogenic specific endothelial receptor in pathological
mTOR
The P13k/Akt pathway plays an essential role in regulating translation, protein
degradation, protein signaling, and angiogenesis [41]. This pathway is deregulated in several
cancers, including ccRCC [42]. mTOR, a serine/threonine protein kinase, is a downstream
component of the P13k/Akt pathway and has been targeted to treat this cancer. A phase II
clinical study revealed the mTOR inhibitor temsirolimus produced an objective response rate
and minor response rate in 7% and 26% of 111 advanced RCC patients, respectively [43].
Median time to progression was 5.8 months and median survival was 15 months.
Temsirolimus, in combination with interferon alfa, displayed antitumor activity in 71 patients
with advanced RCC from a phase I/II ascending dose study [44]. The recommended dose
resulted in 8% partial responses and 36% stable disease for at lease 24 weeks. A phase III
trial further examined the treatment of temsirolimus alone and in combination with interferon
alfa as first-line treatments for advanced RCC [41]. In this 626 patient study, a longer median
survival was observed in the group that received temsirolimus alone (10.9 months) compared
to interferon alfa alone (7.3 months) and temsirolimus with interferon alfa (8.4 months).
Furthermore, survival was enhanced in the temsirolimus group compared to the interferon
alfa group (HR, 0.73; p=0.0069). Serum levels of LDH have been evaluated as a possible
predictive biomarker for temsirolimus-treated patients with metastatic RCC [45]. However,
additional studies are needed to validate these findings, as well as determine if temsirolimus
is effective with other targeted treatments.
IMP3 and Survivin – Factors Implicated with Poor Prognosis
A variety of factors have been identified through studies specifically screening for
insulin-like growth factor (IGF-II) mRNA binding protein family that’s important for biological
processes during early stages of embryogenesis, such as RNA trafficking, cell growth, and
cell migration [46]. IMP3 was interrogated as a predictor for RCC metastasis and poor
prognosis after the association was discovered through a primary screen for factors
associated with metastasis [47]. Immunohistochemistry analysis of 501 primary and
metastatic RCC tumors revealed stronger expression of IMP3 in metastatic tumors and
primary tumors with enhanced metastatic potential. Not only was a shorter metastasis-free
survival and overall survival found among patients with primary tumors expressing IMP3
compared to those without IMP3 expression (p<0.0001), but patients with IMP3-positive
primary tumors had lower 5-year overall and metastasis-free survival than those negative for
IMP3. IMP3 was validated as a prognostic marker for ccRCC in an independent dataset of
716 patient samples, showing that IMP3 expression was significantly associated with a 42%
increase of disease specific death after multivariate adjustment for known clinical variables
(HR, 4.71; p=0.024) [48]. These results suggest that IMP3 could potentially be used as a
marker to identify patients at risk for metastatic disease.
Survivin or BIRC5 is apart of a gene family of inhibitors of apoptosis (IAP) and is
expressed in numerous malignancies, but not in normal adult tissues [49], and is important
for cell proliferation in RCC [50]. In a cohort of 49 ccRCC tumors, survivin expression,
analyzed by immunohistochemistry, was found to be significantly associated with poor
differentiation, advanced stages, and aggressive tumors (p<0.05) [49]. Patients with
moderate-fair and strong expression had poor survival rates compared to patients with weak
positivity (p=0.0157). After adjusting for tumor stage, patients with high expression of
transcript levels of survivin were also detected by RT-PCR analysis in 20 RCC tumors
compared to normal renal tissue (p<0.05) [51]. Significant correlations between survivin
expression and stage (p=0.028), grade (p=0.004), and lymph node metastasis (p=0.017) were
identified. Kaplan-Meier analysis revealed that patients with high survivin expression had
lower overall survival compared to patients with low expression (p<.001). Furthermore,
attenuation of survivin in the human RCC cell line ACHN by shRNA resulted in decreased
cell proliferation, increased apoptotic rate, and enhanced radiosensitivity, suggesting survivin
may be a prospective target for treating RCC.
Chromatin Modifiers
In recent years, three new putative tumor suppressor genes, PBRM1, BAP1, and
SETD2, have been identified in ccRCC as the next most frequently mutated genes in this
cancer after VHL [52, 53]. The implications of these mutations to tumor outcomes or
algorithms to stratify patients according to mutational status are ongoing. BAP1, a nuclear
deubiquitinase, was discovered through whole-genome and exome sequencing of seven
primary tumors to identify two-hit tumor suppressor genes in ccRCC [54]. An analysis of
176 ccRCC tumors revealed that BAP1 loss highly correlated with Fuhrman nuclear grade
(q=0.0005). Interestingly, BAP1 mutation was anticorrelated to PBRM1 expression
(p=7x10⁻⁴), suggesting that these two genes may participate in related functions or signaling
in cancer cells. The prognostic significance of both BAP1 and PBRM1 were investigated in
a retrospective cohort of 145 patients with primary ccRCC that underwent nephrectomy at
the University of Texas Southwestern Medical Center (UTSW) and an independent cohort of
327 ccRCC patients from The Cancer Genome Atlas (TCGA) [55]. Median overall survival
with PBRM1 mutations (10.6 years). Overall survival were reduced in the TCGA cohort,
with patients with BAP1-mutant tumors having a median of 1.9 years and PBRM1-mutant
patients having a median of 5.4 years. In addition, a TMA of more than 300 RCC tumor
samples found significant correlation of PBRM1 loss with advanced tumor stage (p<0.0001),
low differentiation grade (p=0.0002), and worse outcome (p=0.025) [56].
Another study utilized targeted sequencing in 185 ccRCC tumors and matched normal
to examine the relationships of these genes to clinical outcomes [57]. Tumors with BAP1,
PBRM1, or SETD2 (a H3K36 trimethyltransferase) mutations were found to be more likely
stage III or higher. BAP1 mutations were found to be associated with poor cancer specific
survival (p=0.01) and were present exclusively in Fuhrman grade III-IV tumors. The same
group strengthened these results in a subsequent study [58]. PBRM1, SETD2, and BAP1
were frequently mutated in a cohort of 188 ccRCC patients who underwent resection at the
Memorial Sloan-Kettering Cancer Center (MSKCC) and in 421 primary ccRCC patients
from TCGA. Again, BAP1 was associated with worse cancer specific survival (CSS), with a
hazard ratio of 7.71 in the MSKCC cohort (p=0.002) and 2.21 in TCGA (p=0.002). SETD2
was found to be significantly associated with CSS only in the TCGA cohort (p=0.036, HR
1.68). However, PBRM1 was not associated with cancer specific survival in either cohort.
These studies present the use of ccRCC subtypes, based on mutational status, as potential
markers that can be used to better understand RCC pathogenesis.
Moreover, a novel study elucidated that SETD2 mutations in a cohort of 42 ccRCC
primary tumor samples were found to be associated with open chromatin regions in gene
bodies by formaldehyde-assisted isolation of regulatory elements (FAIRE) sequencing[59].
processing defects that involved aberrant splicing, exon skipping, intron retention, and
alternative transcription start and termination sites. This study sheds light on the impact
chromatin modifier mutations have on the ccRCC genomic landscape.
Clear cell A and clear cell B gene signatures
In addition to individual markers, gene signatures have been revealed through genome
expression profiling to identify discrete and global changes in transcript expression.
Recently, two subtypes of clear cell RCC, clear cell A (ccA) and clear cell B (ccB), were
identified using gene expression consensus clustering to identify complex biological patterns
[14]. Using a data set of 177 ccRCC tumors, it was found that tumors displaying the ccA
signature were associated with an 8.6-year cancer specific survival as compared to only 2
years for ccB (p=0.0002). This relationship is not unexpected, as ccB tumors expression
includes panels of genes associated with cell differentiation, mitotic cell cycle, transforming
growth factor beta, and Wnt signaling. In contrast, ccA tumors expressed genes associated
with angiogenesis, beta-oxidation, and fatty acid and pyruvate metabolism [14]. Moreover,
the ccA/ccB signature was robust in a meta-analysis of 480 ccRCC tumors [13].
Unsupervised consensus clustering in this large group revealed an additional cluster that
comprised tumors phenotypically wild type for VHL that displayed histological features of a
rare supbtype of RCC defined as clear cell-papillary-typed tumors, demonstrating this profile
was stable across ccRCC and that expression profiling provided a potential clinical tool for
personalized disease management to elucidate rare subgroups.
Furthermore, a 34-gene subtype predictor was developed to classify clear cell tumors
according to ccA or ccB subtype[7]. The predictor was developed from a panel of genes
prognostic value of the algorithm was corroborated in RNA-sequencing data from 380
ccRCC samples from The Cancer Genome Atlas (TCGA) and further validated using the
NanoString platform with a cohort of 157 fixed archival samples collected at the University
of North Carolina. The intrinsic subtypes, ccA and ccB, were classified in the TCGA and
NanoString cohorts. Subtype classification showed significant prognostic outcomes for
overall survival, cancer-specific survival, and recurrence-free survival and remained
significant in multivariate analyses that included pathologic stage and histologic grade. A
prognostic model was built for recurrence-free survival for non-metastatic ccRCC patients
within the context of subtype and clinical characteristics, which outperformed established
algorithms. Moreover, the ccA/ccB signature was found to be the only independent
prognostic biomarker in multivariate analysis, establishing the molecular tool adds
prognostic value for clinical assessment[60].
Chromosomes 9q and 14q deletions
Cytogenetic abnormalities provide a high level indication of tumor genomics, and can
be very valuable in making tumor classifications. In addition to the characteristic
chromosome 3p deletion that is a hallmark of this cancer, deletions of chromosomes 9q and
14q have emerged as high frequency copy number changes and as potential prognostic
factors for RCC. Fluorescence in situ hybridization and cytogenetics were used with 703
ccRCC tumors to analyze whether chromosome 9p deletions could predict disease-specific
survival and recurrence-free survival, as well as associating deletion of 9q with an aggressive
tumor phenotype [61]. 13.8% of the tumors had chromosome 9p deletions, and these tumors
Since the HIF1A locus resides within 14q and loss of 14q had also previously been
associated with poor outcome, loss of chromosome 14 and corresponding decreased
expression of HIF1A were investigated for prognostic potential [62]. Utilizing 112 ccRCC
tumor specimens with 250K SNP microarrays, qPCR, and immunohistochemical methods,
significant associations were observed between loss of chromosome 14q and high stage
(p=0.001), recurrence risk (p=0.002), and reduced overall survival (p=0.030) in
non-metastatic patients. However, multivariate analysis revealed that 14q loss was not
independent of stage as a prognostic tool in patients with localized disease. In contrast with
previous studies, loss of 9p was not associated with overall survival in this cohort of patients
with localized or metastatic ccRCC, indicating the prognostic influence of this aberration
may be specific to smaller, less aggressive renal tumors. Further research is needed to better
understand the effects of these chromosomal aberrations on the molecular architecture of
RCC and to validate the prognostic potential of these markers.
ccRCC displays marked variability in risk for developing metastatic disease, and
although numerous clinical algorithms exist that can accurately assess risk for disease death
using clinical stage-based metrics [63], within the large group of intermediate staged tumors,
tissue-based prognostic biomarkers are urgently needed. Furthermore, molecular
stratification will most likely add the most value for predictive biomarker algorithms going
forward, which can also facilitate the understanding of imperative influences, such as the
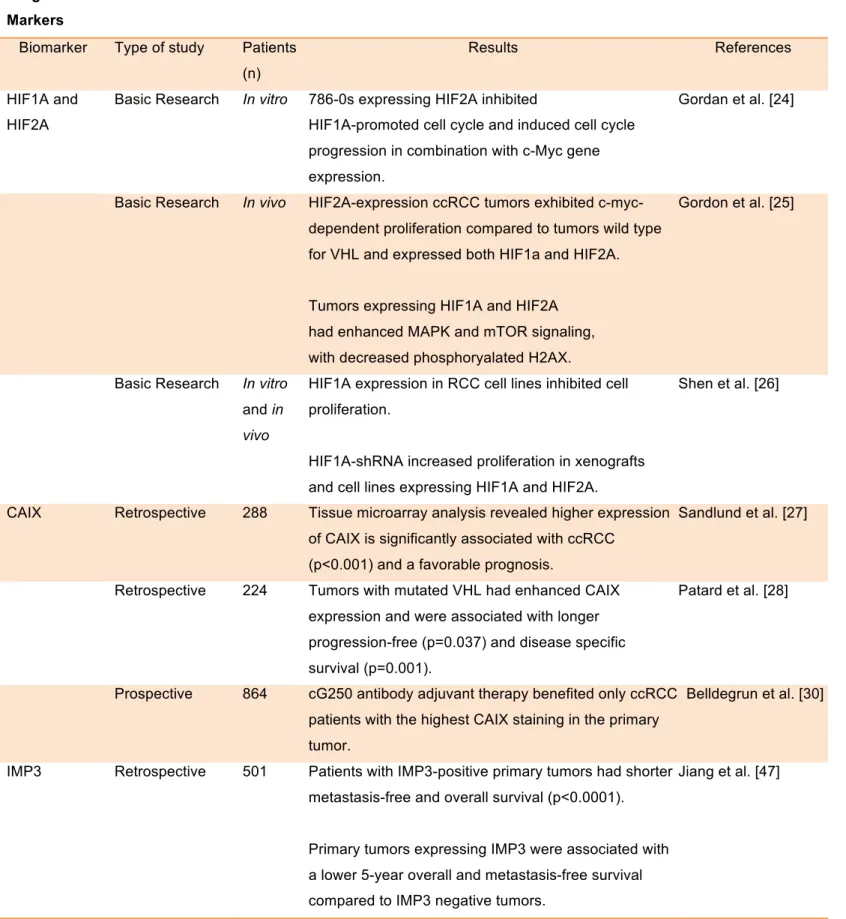
Table 1.1: Prognostic and predictive markers in ccRCC
Prognostic Markers
Biomarker Type of study Patients
(n)
Results References
HIF1A and HIF2A
Basic Research In vitro 786-0s expressing HIF2A inhibited
HIF1A-promoted cell cycle and induced cell cycle progression in combination with c-Myc gene expression.
Gordan et al. [24]
Basic Research In vivo HIF2A-expression ccRCC tumors exhibited
c-myc-dependent proliferation compared to tumors wild type for VHL and expressed both HIF1a and HIF2A.
Tumors expressing HIF1A and HIF2A had enhanced MAPK and mTOR signaling, with decreased phosphoryalated H2AX.
Gordon et al. [25]
Basic Research In vitro
and in
vivo
HIF1A expression in RCC cell lines inhibited cell proliferation.
HIF1A-shRNA increased proliferation in xenografts and cell lines expressing HIF1A and HIF2A.
Shen et al. [26]
CAIX Retrospective 288 Tissue microarray analysis revealed higher expression
of CAIX is significantly associated with ccRCC (p<0.001) and a favorable prognosis.
Sandlund et al. [27]
Retrospective 224 Tumors with mutated VHL had enhanced CAIX
expression and were associated with longer progression-free (p=0.037) and disease specific survival (p=0.001).
Patard et al. [28]
Prospective 864 cG250 antibody adjuvant therapy benefited only ccRCC
patients with the highest CAIX staining in the primary tumor.
Belldegrun et al. [30]
IMP3 Retrospective 501 Patients with IMP3-positive primary tumors had shorter
metastasis-free and overall survival (p<0.0001).
Primary tumors expressing IMP3 were associated with a lower 5-year overall and metastasis-free survival compared to IMP3 negative tumors.
Retrospective 716 A 42% risk increase of disease specific death was significantly associated with IMP3 expression (HR, 4.71; p=0.024).
IMP3-positivity was associated with a 5-fold increased risk of distant metastases.
Hoffman et al. [48]
Survivin Retrospective 49 Immunohistochemistry analysis revealed significant
association of survivin expression with poor differentiation, advanced stages, and aggressive tumors (p<0.05).
Patients with high survivin expression had increased risk of dying from ccRCC compared to patients with low expression after adjusting for tumor stage.
Zamparese et al. [49]
Retrospective and basic research
20, in
vitro
High survivin expression was correlated with lower overall survival compared to low expression (p<0.001).
Reduction of survivin expression by shRNA in ACHN cells decreased cell proliferation, increased apoptotic rate, and enhanced radiosensitivity.
Lei et al. [51]
B7-H1 Retrospective 196 Tumors expressing high levels of B7-H1 were
associated with increased risk of death from RCC, with patients with high B7-H1 tumor expression having 4.5 times the risk of death of RCC compared to those with low levels (RR, 4.53; 95% CI 1.94 to 10.56; p<0.001).
Thompson et al. [64]
Retrospective 306 Immunohistochemistry analysis showed 41.9% and
82.9% 5-year cancer-specific survival rates for patients with and without B7-H1 expression, respectively.
After adjusting for standard clinical variables, B7-H1 tumor expression remained associated with cancer-specific death (RR, 2.00; p=0.0003).
Thompson et al. [65]
Retrospective 259 Fresh-frozen specimens expressing B7-H4 staining
from RCC patients associated with adverse clinical
Patients expressing B7-H4 were three times more likely to die from RCC compared to patients that didn’t express B7-H4 (RR, 3.05; 95% CI, 1.51 to 6.14; p=0.002).
BAP1 and PBRM1
Retrospective 145, 327 Median overall survival was 4.6 and 1.9 years for
patients with BAP1 mutations compared to 10.6 and 5.4 years for those with PBRM1 mutations in the 145 and 327 cohorts, respectively.
Kapur et al. [55]
Retrospective 300 Tissue microarray analysis revealed significant
association between PBRM1 loss with advanced tumor stage (p<0.0001), low differentiation grade (p=0.0002), and worse outcome (p=0.025).
Palowski et al. [56]
Retrospective 188, 421 Patients with BAP1 mutations were associated with a
7.71 (p=0.002) and 2.21 (p=0.002) hazard ratio for cancer specific survival in the 188 and 421 cohorts, respectively.
Hakimi et al. [58]
ccA and ccB Genomic,
Retrospective
177 Genome expression profiling of ccRCC tumors
revealed the ccA and ccB subtypes, which have distinct gene signatures.
ccB-typed patients presented with lower cancer specific survival (2 years) compared to patients displaying the ccB signature (8.6 years) (p=0.0002).
Brannon et al. [14]
Genomic 480 Meta analysis revealed the ccA/ccB gene signature is
stable across a large group of samples.
Brannon et al. [13]
Chromosome 9q deletions
Genomic 703 Cytogenetic and survival analysis revealed patients
with 9q deletions had decreased median disease specific (37 vs 82 months) and recurrence free survival (53 months vs not reached) compared to patients without mutations.
La Rochelle et al. [61]
Chromosome 14q deletions
Genomic 112 Loss of chromosome 14q was significantly associated
with high stage (p=0.001), recurrence risk (p=0.002), and reduced overall survival (p=0.030) using SNP microarray, qPCR, and immunohistochemical analysis, but failed to be independent after adjusting for stage.
Monzon et al. [62]
VEGF and PDGF
Prospective 63 RCC patients who received prior cytokine therapy
from a phase II study had a partial (40%; 95% CI,
28-53%) response and stable disease for ≥ 3 months
(27%) following sunitinib treatment.
Motzer et al. [41]
Prospective 750 Metastatic RCC patients experienced longer
progression-free survival following sunitinib treatment compared to patients treated with interferon alfa (HR, 0.42; 95% CI, 0.32 to 0.54; p<0.001).
A higher objective response rate (31% vs. 6%, p<0.001) and better quality of life (p<0.001) was associated with sunitinib treatment compared to interfon alfa.
Motzer et al. [36]
Prospective 903 Serum VEGF levels significantly associated with
overall survival (17.8 v 14.3 months; HR, 0.78;
p=0.029) and progression-free survival in patients that received second-line treatment of sorafenib compared to placebo following censoring of post-cross-over placebo patients.
Escudier et al. [39]
Genomic, Retrospective
215, 344 Candidate cytokine and angiogenic factors (CAFs) were identified from a screen of 129 patients with the greatest or least tumor shrinkage from a trial of 215 RCC patients treated with pazopanib, which were associated with continuous tumor shrinkage or progression-free survival.
A cohort of 344 RCC patients were used to validate selected CAFs and revealed patients treated with pazopanib that had high concentrations of interleukin 8 (p<0.0001), osteopontin (p=0.0004), HGF (p=0.010), and TIMP-1 (p=0.006) were associated with shorter progression-free survival compared to those with low levels.
Tran et al. [40]
mTOR Prospective 111 A phase II study of advanced RCC patients produced
a 7% objective response rate and 26% minor response rate following treatment of temsirolimus.
Patients who received treatment had a median time to progression of 5.8 months and median survival of 15 months.
Prospective 71 Advanced RCC patients receiving the recommended
dose of temsirolimus and interferon alfa in a phase I/II study resulted in 8% partial responses and 36% stable disease for at least 24 weeks.
Motzer et al. [44]
Prospective 626 A longer median survival was observed in advanced
RCC patients from a phase III study that received first-line treatment of temsirolimus alone (10.9 months) compared to inferno alone (7.3 months) or in combination with temsirlimus (8.4 months).
Increased survival was observed in the patients treated with temsirolimus compared to the interferon alfa group (HR, 0.73; p=0.0069).
ccRCC Heterogeneity
Even within a single subtype of the disease, ccRCC, this cancer can present with
variable histopathogical and clinical patterns, which significantly impairs accurate clinical
prognostication for an individual patient[67]. Moreover, it has recently been reported that
these tumors can display significant intratumoral genomic heterogeneity, which further
complicates tissue based biomarker development. Tumor Fuhrman grade, one of the key
features used to determine the pathology of a tumor and the risk for metastasis, has long been
recognized to have regional variation among and within renal tumors[68]. Recent large-scale
sequencing analyses, however, have identified that individual tumors have a heightened
amount of genomic heterogeneity[53]. Moreover, ccRCC has been observed to be composed
of diverse cell populations and to display intratumoral heterogeneous DNA content[69, 70].
Exome sequencing of multiple ccRCC intratumoral biopsies revealed a high level of DNA
aneuploidy amongst the samples and that the majority of the somatic mutations were
sample-specific[71]. Our own work sampling across tumors has also shown this pattern of mutational
heterogeneity in large tumors: however, we also observed that the gene expression features
of the sampled sublocations were more generally stable, and that sublocations from a single
tumor preferentially clustered together when compared across a larger group of tumors.The
recent discovery of intratumoral heterogeneity in ccRCC has substantially altered cancer
researchers and clinicians’ perspective of this cancer. However, there remains a substantial
deficit of information regarding the affects tumor heterogeneity has on driving biological and
molecular features of ccRCC tumorigenesis, which is examined in Chapter 2 and 3.
Furthermore, understanding the extent of tumor heterogeneity has the potential to facilitate
Environmental exposure and RCC
The kidney is a structurally and functionally complex organ that has a significant role
of detoxifying blood and excreting chemical compounds to maintain homeostasis, making it
vulnerable to chemical insults. Cellular damage due to nephrotoxicity results in acute kidney
injury (AKI)[72, 73], and can be worsened if untreated to cause chronic kidney damage or
promote or exacerbate tumorigenesis[74-76]. In fact, chronic damage is the leading risk
factor for development of renal cancer[76]. Toxicogenomics has been instrumental in
revealing early changes in gene expression in response to compounds and environmental
factors[77, 78]. These genomic mechanisms have elucidated unique gene patterns from
toxicant exposure. While it’s known that RCC can be influenced by chemical exposure, we
are largely unaware of the sustaining effects exposures have on distinct gene signatures of
this disease, and how these exposures relate to tumor heterogeneity and molecular patterns.
Thus, in Chapter 4 I investigate the influence cadmium exposure has on core gene expression
patterns in clear cell renal cancer, prioritizing the focus to genes in Clearcode34.
Environmental Sources of Cadmium
Cigarette smoke (CS) is one of the oldest environmental exposures linked to cancer
[79] and contains numerous carcinogenic compounds, such as Cadmium. Smoking is the
predominant source of Cd exposure and the smoking populations experience higher levels of
cadmium exposure, as one cigarette may contain 1-2 ug cadmium[80, 81]. Cigarette and
second hand smoke have both been shown to induce or be associated with angiogenesis by a
variety of mechanisms, although separating angiogenic effects from other carcinogenic
activities is a challenge. Mouse models of chronic colitis were found to have increased blood
angiogenesis in these models were found to be dose-dependent. In addition, bcl-2 and VEGF
protein expression was significantly increased (p>0.05) after CS exposure. However, CS in
absence of ulcerative colitis failed to induce these pathologic alterations. Tumor growth,
capillary density, plasma VEGF levels, and circulating endothelial progenitor cells were
significantly increased in mice subcutaneously injected with Lewis lung cancer cells after a
17 days exposure to second hand smoke compared to mice exposed to clean room air [83].
Furthermore, a hospital-based case-control study consisting of 730 urothelial carcinoma
cases, 470 bladder cancers, 260 upper urinary tract urothelial carcinomas, and 850
age-matched controls found significant correlations between bladder and upper urinary tract
urothelial carcinomas (UUTUC) and both cigarette smoking and arsenic exposure.[84]
Patients that smoked and had high arsenic exposure, another RCC risk factor, were found to
have increased risk of developing bladder cancer and UUTUC. The risk for both bladder
cancer (6.6; 95% cI, 3.1-13.9) and UUTUC (9.9; 95% CI, 4-24.5) were increased with the
presence of VEGF polymorphisms associated with increased cancer risk.
Consumption of contaminated water or food is the second most common route of
cadmium exposure among non-smokers. Mollusks, crustaceans, seeds (Oil, Sunflower, and
flax), peanuts, vegetables, grains, and offals of sea animals are primary food sources for high
cadmium concentrations[85]. The World Health Organization set a safe intake limit of 7ug
cadmium/week/kg body weight based on a critical renal cadmium concentration between 100
and 200ug/g wet weight that corresponds to a urinary threshold limit of 5-10 ug/g creatinine.
However, studies have reported adverse kidney effects at urinary cadmium levels less than
0.5 ug/g creatinine, Furthermore, increased endometrial cancer risk was detected in a
vegetables and cereals[85], suggesting these limits are too high and lower exposures have the
potential to induce adverse health effects.
Cadmium can also be absorbed through inhalation from ambiant air and occupational
environments, but is the least likely route of exposure. Heavy metal mining, metallurgy and
industrial use of manufacturing nickel-cadmium batteries, pigments, plastic stabilizers, and
anti-corrosive products are the main reasons for exposures. Although cadmium production
has decreased in developed countries due to its toxicity, cadmium pollution has increased due
to waste incineration causing its presence in farm fertilizers and during mud purification.
Kinetics and metabolism of Cadmium
The most efficient absorption of cadmium takes place in the lungs where 25-60% is
absorbed compared to ingestion where the gastrointestinal tract takes up only 5-10%[86]. On
average, adults are estimated to absorb 1.4-8ug of cadmium orally[86]. The cadmium
compound and its solubility highly affect the absorption of oral exposure, while inhalation
absorption is dependent on compound solubility and particle size. Cadmium can also be
absorbed through the skin, but this route is less efficient.
Once absorbed, cadmium binds to red blood cells or high molecular weight proteins
in plasma and distributed through out the body. The kidney and liver are the main deposition
sites for Cd accumulation, which induces the family of metallothineins (MT) that binds the
majority of cadmium[87]. Persons with chronic Cd exposure usually contain high levels of
Cd in the renal cortex, levels that increase with body burden and age until 50 to 60 years.
Cadmium is absorbed by the liver from the blood and bound to MT, where the complex is
then released back into the cardiovascular system and filtered by glomerular in the
production is low in the kidney and makes tubules vulnerable to insult or cell membrane
destruction through the activation of reactive oxygen species caused by free unbound
cadmium[81].
The majority of cadmium ingested is excreted mostly in feces[86]. On the other hand,
Cd is excreted in both urine and feces following inhalation. As exposure prolongs, urine
excretion will increase, but this will only be a small percentage of the total body burden[86].
Accumulating Cd concentrations over time is the main focus of kidney toxicity and has been
linked to numerous adverse effects.
Mechanisms of Cadmium Toxicity
Both acute and chronic cadmium exposures have been linked to adverse health
effects, with acute toxicity responsible for injuries to testes, liver, and lungs, while
obstructive airway diseases, emphysema, end-stage renal failures, diabetic and renal
complications, deregulated blood pressure, bone disorders, and immune-suppression are
associated with chronic exposures[88]. The accumulation of cadmium over time and the lack
of excretion from the body make it highly toxic and dangerous to human health. In addition
to these effects, evidence has shown that cadmium is able to promote cancer. Lung cancer
and cadmium exposure has the strongest association compared to prostate and kidney[89].
Cadmium was deemed a category 1 carcinogen by the International Agency for Research on
Cancer (IARC)[90]. However, cadmium is not genotoxic and exerts its toxicity through
various mechanisms including the induction of reactive oxygen species (ROS), inhibiting
DNA repair systems, and altering the genome and epigenome[88].
Probably one of the main mechanisms cadmium influences genome stability is
indirect processes that involve the decrease of cellular antioxidants and exhalation of ROS by
mitochondria[91]. Increased hydrogen peroxide levels have been measured with Cd
concentrations of less than 50uM up to 15 minutes post exposure and were observed to also
affect permeability of the plasma membrane[92]. Furthermore, Cd-induced oxidative stress
causes the production of mutagenic lesions, such as 8-oxo-7,8-dihydro-2’-deoxyguanosine
adducts, as well as increased production of DNA single-strand breaks[91]. Studies have also
shown that cadmium has the ability to influence antioxidant proteins, such as
glutathione-S-transferase, which play an important role in eliminating ROS. These effects can cause a
heightened oxidative state that can result in DNA damage and aberrant translation. In
addition, superoxide anion and hydrogen peroxide release was enhanced in mitochondria
upon Cd intoxication, enhancing mitochondrial oxidative stress and lipid peroxidation of
mitochondrial membranes[93, 94]. ROS-induced mitochondria damage could result in the
alteration of transmembrane potential, release of mitochondrial calcium and upcoupling,
activation of caspase-3, DNA fragmentation, and apoptosis[88, 95].
Several studies have shown a correlation between cadmium exposure and disruption
of DNA repair mechanisms, such as mismatch repair, nucleotide excision repair, and base
excision repair[88]. In human kidney 293T cells, Cd suppressed the mismatch
repair-mediated cell cycle arrests in G2 phase after intoxication[96]. Mismatch repair is imperative
for reconciling base substitutions and insertion-deletion mismatches that can promote
mutations and cancer. Cd also prevents the xeroderma pigmentosum A protein from binding
to DNA damage sites, which inhibits the recruitment of nucleotide excision repair proteins.
It’s postulated that this effect is due to the replacement of zinc in the zinc finger of the
endonuclease 1 is inhibited and modified by Cd exposure preventing the initiation of base
excision repair, important for resolution of oxidative-induced base damage and single-strand
breaks[88, 98]. It’s thought that cadmium targets the zinc finger motif of the
formamidopyrimidine glycosylase protein to inhibit DNA binding, however, the mechanism
for the inhibition of apurinic endonuclease 1 is unknown.
Cadmium exposure has been shown to regulate cell cycle progression through the
activation of cellular signals and inhibition of DNA methylation. These effects are dose
dependent, with inhibition of DNA synthesis observed at concentrations above 1uM and
increased DNA synthesis and cell proliferation at concentrations lower than 1uM. Moreover,
cell cycle genes and proteins, such as GRB2 and SHC, are upregulated after Cd exposure,
enhancing the RAS signaling pathway implemented in cell proliferation. The expression of
proto-oncogenes C-FOS, C-MYC, and C-JUN has also been induced following Cd exposure.
Interestingly, the induction of apoptosis by Cd2+ intoxication has been demonstrated in Hela
cells, bovine endothelial cells, rat normal kidney tubular epithelial cells, and rat glioma
cells[99-101] through either the extrinsic Fas-FADD caspase-8 pathway initiated by the
activation of the death receptors at the plasma membrane or the intrinsic pathway induced by
cellular stress signals activating caspase-9. The most hallmark genetic effect of Cd exposure
is the induction of metallothioneins (MT), cysteine-rich heavy metal-binding proteins. MTs
protect against toxicity by binding to metals and preventing cellular damage caused by
oxidative stress. Metal response elements located in the proximal promoters of MTs and the
metal-responsive six zinc fingers transcription factor (MTF-1) help facilitate this response.
MTs bind cadmium with high affinity preventing it from being absorbed and allowing for its
Toxicant Exposure and Angiogenesis
Environmental exposures have been found to promote tumorigenesis of multiple
cancers through various mechanisms [102-107]. Vascular endothelial growth factor (VEGF)
has been established as one of the key promoters of vascular bed expansion [32] and has been
targeted for anti-angiogenesis therapy, with numerous VEGF blockers approved by the FDA
to treat metastatic colorectal cancer, non-squamous non-small-cell lung cancer, breast cancer,
renal cell carcinoma, and recurrent glioblastoma [108]. Thus, VEGF-mediated signal
pathways and VEGF-induced tissue factor/factor VII (TF/fVII) signal pathway are prioritized
targets, which are believed to be important in pathological angiogenesis.
Cadmium and ccRCC
Cadmium (Cd) is a known environmental and occupational metal compound that has
the ability to cause kidney toxicity and damage, as well as associated with cancer [109-113].
The half-life of Cd is very long, with an average of 20 years, due to the lack of biochemical
mechanisms to excrete it from the body and reabsorption by the kidney[76]. More
specifically, heavy metals like cadmium can induce nephrotoxicity altering gene expression
in the kidney, and thus increasing the risk of developing RCC [81, 87, 114]. In addition to
transcript alterations, numerous studies have found that Cd exposure can result in epigenetic
deregulation by changing DNA methylation levels, histone modifications, and miRNA
expression [84, 115-117], which further suggests a possible connection between cadmium
and ccRCC due to epigenetic modifiers being highly affected in this cancer. Moreover,
treatment of Nickel, another heavy metal, was shown to induce the expression of the histone
demethylase Jumonji domain-containing protein 1A (JMJD1A), a hypoxic response gene that
expression and epigenetic changes can enhance our understanding of the genetic interactions
that drive the biological responses to these exposures and their influence on prognostic
signatures of RCC.
Concluding Remarks
Conducting clinically relevant research has become increasingly imperative for
understanding the underlying biology of diseases. This dissertation provides the foundations
for risk stratification and ultimately possible therapeutic strategies. I’ve focused exclusively
on clear cell type RCC, which is a highly distinct molecular entity compared with other renal
cell carcinoma histologic subtypes. This work attempts to integrate the genetic and
functional/morphological heterogeneity of primary tumors and molecular influence of
environmental exposures to develop new theories regarding toxicant exposure and
heterogeneous disease progression.
The identification of key molecular profiles of ccRCC and the entities that influence
them presents the opportunity to make novel and substantive discoveries regarding RCC
CHAPTER 33: CLEARCLODE34: A PROGNOSIC RISK PREDICTOR FOR LOCALIZD CLEAR CELL RENAL CELL CARCINOMA
Introduction
The majority of Renal Cell Carcinoma (RCC) or kidney cancer patients have the clear
cell RCC (ccRCC) subtype. Although extensive effort has been devoted to identifying
molecular biomarkers for RCC, there are few validated markers that aid disease prognosis,
and none are used routinely in clinical practice[31, 119-123]. Thus, transcriptional
biomarkers present a potentially target-rich environment towards the goal of improving our
understanding of underlying ccRCC biology.
Recently, we identified two subtypes of clear cell RCC, ccA and ccB, based on patterns
of differential gene expression, which revealed distinct biological signatures[14]. These
subtypes appear to provide prognostic information, with tumors classified as ccA associated
with significantly better survival compared to ccB in a retrospective cohort[14]. The ccA/ccB
classification was subsequently validated in a meta-analysis of 480 ccRCC tumors,
suggesting this profile may have value for risk stratification[13].
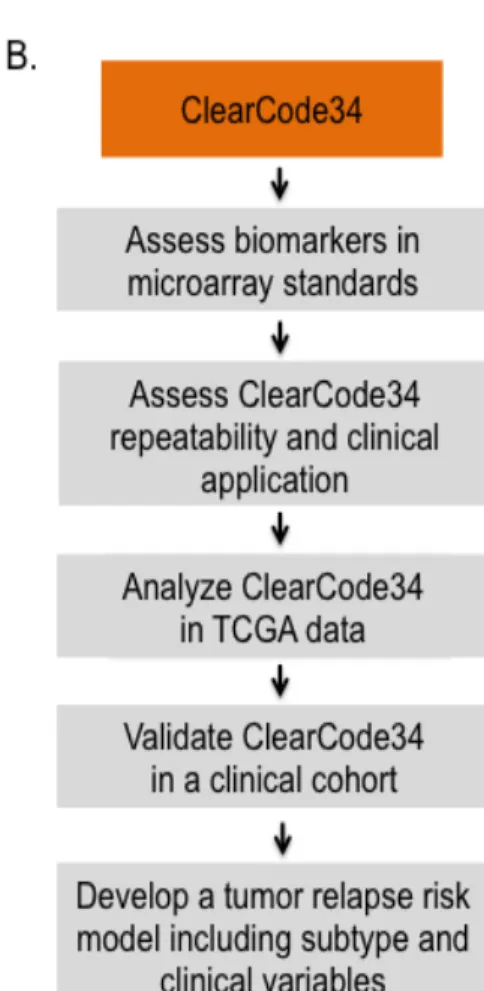
Building on this foundation, in the present study we demonstrate the utility of a novel
tool to identify the ccA and ccB groups in ccRCC. This molecular tool comprises a 34-gene
expression signature (ClearCode34) and an accompanying protocol for ccA/ccB
classification. Clinical utility of the classifier is demonstrated by 1) accurate and reproducible
classification of ccRCC tumors into ccA and ccB molecular subtypes, 2) validation of
prognostic classification in ccRCC samples from The Cancer Genome Atlas (TCGA)[124]
ccRCC project, 3) adaptation of ClearCode34 to a NanoString probeset for validation in an
independent cohort of 163 formalin-fixed paraffin-embedded (FFPE) clinical ccRCC
samples, and 4) constructing a more precise unified model of ccRCC subtype and standard
clinical variables to assign individual ccRCC patients into clinically informative risk
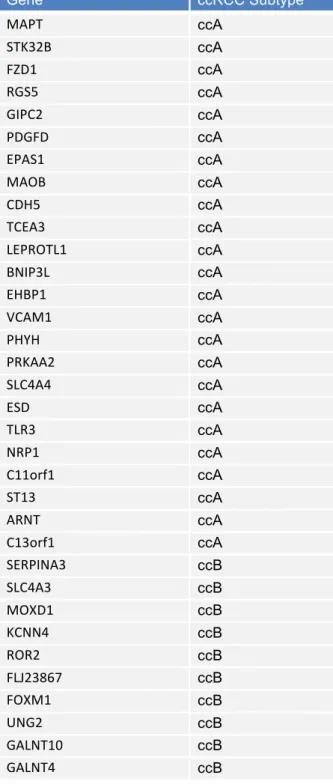
Table 2.1: Expression of ClearCode34
Gene ccRCC Subtype
MAPT ccA
STK32B ccA
FZD1 ccA
RGS5 ccA
GIPC2 ccA
PDGFD ccA
EPAS1 ccA
MAOB ccA
CDH5 ccA
TCEA3 ccA
LEPROTL1 ccA
BNIP3L ccA
EHBP1 ccA
VCAM1 ccA
PHYH ccA
PRKAA2 ccA
SLC4A4 ccA
ESD ccA
TLR3 ccA
NRP1 ccA
C11orf1 ccA
ST13 ccA
ARNT ccA
C13orf1 ccA
SERPINA3 ccB
SLC4A3 ccB
MOXD1 ccB
KCNN4 ccB
ROR2 ccB
FLJ23867 ccB
FOXM1 ccB
UNG2 ccB
GALNT10 ccB
Figure 2.1. Workflow for biomarker discovery and order of analyses.
(A) Steps taken to identify the 34 genes that classify ccA and ccB tumors.
Results
Subtype comparison for prognosis and recurrence in the TCGA dataset
To evaluate the prognostic utility of the 34-gene classifier (Table 2.1), ClearCode34, for ccA and ccB ccRCC tumors, Kaplan-Meier analysis was used to assess tumor recurrence
and survival rates by subtype assignment in tumor samples from 380 non-metastatic ccRCC
patients from the TCGA dataset (Table 2.2). Univariate analysis revealed ccB patients experienced tumor recurrence earlier and more frequently than ccA (HR, 2.3; 95% CI, 1.6 to
3.3; P=4.3e-06) (Figure 2.2A). Moreover, ccB patients had almost three times the risk of death from disease (HR, 2.9; 95% Cl, 1.6 to 5.6; P=0.0005) and more than two times the risk of death from any cause compared to ccA (HR, 2.4; 95% CI, 1.6 to 3.7; P=2.3e-05) (Figure 2.2B and C). Competing risk analysis further validated the differences in survival between the two subtypes, which showed their specificity as prognostic tools for clear cell renal