REAL-TIME PHYSICALLY BASED SOUND SYNTEHSIS AND APPLICATION IN MULTIMODAL INTERACTION
Zhimin Ren
A dissertation submitted to the faculty of the University of North Carolina at Chapel Hill in partial fulfillment of the requirements for the degree of Doctor of Philosophy in the Department of
Computer Science.
Chapel Hill 2014
©2014 Zhimin Ren
ABSTRACT
Zhimin Ren: Real-Time Physically Based Sound Synthesis and Application in Multimodal Interaction
(Under the direction of Ming C. Lin)
ACKNOWLEDGEMENTS
During my PhD education, I have received tremendous help and support from a large number of people, who guided me through challenging times and accompanied me along my fun and exciting PhD journey. To all of them, I wish to extend my sincerest gratitude!
I thank Prof. Ming C. Lin for being my advisor and constantly offering guidance to me throughout my doctoral studies. I am sincerely grateful for her patience when I was taking my time, her encouragement when I doubted myself, and her advice whenever I needed it. Her hard work and zeal for research always inspire me and push me to do better. Her genuine care for me and interest in my growth constantly remind me how lucky I am to have her as my advisor. It has truely been a great honor of mine to have worked so closely with Prof. Lin, and I owe a great deal of gratitude for all the support, help, and guidance she has offered me so tirelessly.
I am grateful to Prof. Roberta Klatzky for a wonderful collaboration opportunity on one of my papers. I thank her for broadening my research interest and unselfishly spending a lot of time on helping me with my doctoral studies. I appreciate her traveling from Pittsburgh to attend my defense and provide the extremely helpful and thoughtful feedback to my defense and dissertation. I thank Prof. Dinesh Manocha for his early support when I first started graduate school and introducing me to the field of sound simulation. His mentorship throughout my entire doctoral studies in the GAMMA research group has helped me significantly. I thank Dr. Nikunj Raghuvanshi. His research inspired me to pursue the area of physically-based sound synthesis. He is the top expert in sound simulation research and is always willing to help me get over technical difficulties. He often joins our discussions remotely, answers my technical questions with great expertise and insights, and urges me to do solid research. I also thank Prof. Gary Bishop for the invaluable feedback and support he has provided me as my committee member. His encouragement has helped me stay optimistic and enthusiastic about my research.
chance to work with Hengching Yeh, Anish Chandak, Micah Taylor, Ravish Mehra, Lakulish Antani, Christian Lauterbach, Jason Coposky, James Norton, and Maggie Zhou. Thanks to them for teaching me so much and being great friends of mine.
I thank the staffin the Computer Science Department at UNC. I especially thank Janet Jones and Jodie Turbull for helping me cope with so many logistic details related to getting my degree.
I owe my every little accomplishment to my parents. Their love and support motivate me to do my best. I thank them for always believing in me and supporting me in anything my heart desires. They are my heaven, my harbor, my protecting shield, and always the home that I return to when I need strength and love.
TABLE OF CONTENTS
LIST OF TABLES . . . xi
LIST OF FIGURES . . . xii
1 INTRODUCTION . . . 1
1.1 Challenges . . . 2
1.2 Previous Work . . . 3
1.2.1 Sound Synthesis . . . 3
1.2.2 Multimodal Applications . . . 5
1.3 Thesis Statement . . . 6
1.4 Main Results . . . 6
1.4.1 Evaluation of the real-time sound synthesis material model: . . . 6
1.4.2 Example-guided framework for material parameter estimation: . . . 6
1.4.3 Efficient contact sound computation: . . . 6
1.4.4 Real-time sound synthesis driven by multi-touch: . . . 7
1.5 Organization . . . 7
2 AUDITORY PERCEPTION OF MATERIAL PROPERTIES . . . 8
2.1 Introduction. . . 8
2.2 Background . . . 10
2.2.1 Rayleigh Damping Model . . . 10
2.2.2 Related Work . . . 11
2.3 Empirical Analysis of Real-World Recordings . . . 14
2.3.2 Resonance Mode Extraction. . . 15
2.3.3 Fitting Modes to the Rayleigh Damping Model . . . 16
2.4 Perceptual Study on Material Similarity . . . 17
2.4.1 Audio Stimuli . . . 18
2.4.2 Study Design . . . 19
2.4.2.1 Stimulus Sampling . . . 19
2.4.2.2 Study procedure . . . 21
2.4.3 Participants . . . 22
2.4.4 Results and Analysis . . . 23
2.4.4.1 Recorded stimulus trials . . . 24
2.4.4.2 Synthetic stimulus trials . . . 24
2.5 Discussion . . . 26
2.6 Conclusion and Future Work . . . 28
3 EXAMPLE-GUIDED PHYSICALLY BASED SOUND SYNTHESIS . . . 39
3.1 Introduction. . . 39
3.2 Related Work . . . 42
3.3 Background . . . 44
3.4 Results and Analysis . . . 46
3.5 Perceptual Study . . . 51
3.6 Conclusion and Future Work . . . 53
4 SYNTHESIZING CONTACT SOUNDS OF TEXTURED MODELS . . . 56
4.1 Modal Analysis for Sound Synthesis . . . 56
4.1.1 Modal Analysis . . . 56
4.1.2 Impulse Response and Modal Synthesis . . . 58
4.2 Interaction Handling . . . 59
4.2.1 Contact Categorization . . . 60
4.3 Implementation and Results . . . 64
4.3.1 User Interface . . . 64
4.3.2 Results . . . 65
4.4 Preliminary User Study . . . 67
4.4.1 Procedure . . . 67
4.4.2 Statistics . . . 68
5 MULTITOUCH VIRTUAL MUSICAL INSTRUMENTS . . . 73
5.1 Introduction. . . 73
5.2 Previous Work . . . 75
5.2.1 Multi-Touch Interfaces for Musical Instruments . . . 75
5.2.2 Sound Simulation for Musical Instruments . . . 76
5.2.2.1 Sound Synthesis . . . 76
5.2.2.2 Acoustic Effects . . . 77
5.3 System Overview . . . 78
5.3.1 Hardware Apparatus . . . 78
5.3.2 Algorithmic Modules . . . 79
5.4 Touch Input Processing . . . 80
5.4.1 Z-Velocity Tracking . . . 80
5.4.2 Implementation and Results . . . 82
5.5 Sound Synthesis . . . 82
5.6 Acoustic Effects . . . 84
5.7 Instrument Modeling and Implementation . . . 86
5.7.1 Sound Generation . . . 86
5.7.2 Acoustic Simulation . . . 86
5.7.3 System Integration . . . 87
5.8 Results and Discussions . . . 88
5.8.2 Limitations . . . 89
5.9 Conclusions and Future Work . . . 90
6 VIRTUAL MUSICAL INSTRUMENTS ON MOBILE DEVICES . . . 91
6.1 Introduction. . . 91
6.2 Previous Work . . . 92
6.3 User Interface Design . . . 93
6.3.1 Editing Mode . . . 94
6.3.2 Playing Mode . . . 94
6.4 Algorithmic Design . . . 95
6.4.1 Input Processing . . . 95
6.4.1.1 Reconstruct 3D Interaction . . . 96
6.4.1.2 Input Approximation . . . 97
6.4.2 Sound Synthesis . . . 98
6.4.3 Implementation Details . . . 98
6.5 Pilot Study . . . 99
6.6 Conclusion and Future Work . . . 100
7 CONCLUSION . . . 101
7.1 Future Work . . . 102
LIST OF TABLES
2.1 Goodness of Fit for the Rayleigh Damping Model . . . 17
2.2 Recorded stimulus sampling . . . 20
2.3 Synthetic stimulus sampling . . . 20
2.4 Synthetic stimulus sampling withgeometry visualization. . . 22
2.5 95% CI for accuracy and confidence for recorded audio trials . . . 24
2.6 95% CI for consistency and confidence for synthetic audio trials . . . 25
2.7 95% CI for consistency and confidence for synthetic materials . . . 25
2.8 95% CI for consistency and confidence for synthetic audio trials with geometry visualization. . . 26
2.9 95% CI for consistency and confidence for synthetic materials with geom-etry visualization . . . 26
3.1 Estimated parameters . . . 48
3.2 Offline Computation for Material Parameter Estimation . . . 51
3.3 Material Recognition Rate Matrix: Recorded Sounds. . . 52
3.4 Material Recognition Rate Matrix: Synthesized Sounds Using Our Method . . . 52
3.5 95% Confidence Interval of Difference in Recognition Rates . . . 53
4.1 Results of User Study:the number of subjects who feel either no audio or the addition of contact and sliding sounds generated by our method make the video more immersive for each scenario shown. . . 68
4.2 Results of User Study:the number of subjects who feel no audio, or the addition of sliding sounds using only the parametric method, or using our method offers more immersive experiences. . . 69
6.1 Are responses as expected? Scale: 0 (No) to 10 (Yes) . . . 97
LIST OF FIGURES
2.1 Recording setup: (a) the sound booth where recordings take place. Other figures (b) - (f) the setups for recording impact sounds from real-world
materials: glass, porcelain, ceramic, wood, and metal, respectively. . . 8 2.2 Fitting objects’ resonance modes to the Rayleigh damping model. The
top row shows real-world objects used in this experiment. The bottom row presents the fitting results, where the bottom plane represents the
frequency-decayplane, the values in the height axis are relative energy,
and the black curves on the frequency-decay plane visualize the fitted Rayleigh damping model. The color codes on the real objects match their
extracted resonance modes in the same color. . . 12 2.3 Resonance mode extraction results forglassbowls of different shapes and
sizes, as shown in Fig. 2.2a. Fig. 2.3a - Fig. 2.3l show, for each object, the power spectrograms of the recorded audio, the extracted resonance mode
mixed audio, and the absolute error between the two. . . 30 2.4 Resonance mode extraction results for ceramic material, as shown in
Fig. 2.2c. For example, GREEN object in this figure represents the object labled GREEN in Fig. 2.2b. Fig. 2.4a - Fig. 2.4i show, for each object, the power spectrograms of the recorded audio, the extracted resonance mode
mixed audio, and the absolute error between the two. . . 31 2.5 Resonance mode extraction results forporcelainmaterial, as shown in
Fig. 2.2b. For example, GREEN object in this figure represents the object labled GREEN in Fig. 2.2b. Fig. 2.5a - Fig. 2.5i show, for each object, the power spectrograms of the recorded audio, the extracted resonance mode
mixed audio, and the absolute error between the two. . . 32 2.6 Resonance mode extraction results for wooden material, as shown in
Fig. 2.2d. For example, GREEN object in this figure represents the object labled GREEN in Fig. 2.2d. Fig. 2.6a - Fig. 2.6i show, for each object, the power spectrograms of the recorded audio, the extracted resonance mode
mixed audio, and the absolute error between the two. . . 33 2.7 Resonance mode extraction results for metallic material, as shown in
Fig. 2.2e. For example, GREEN object in this figure represents the object labled GREEN in Fig. 2.2e. Fig. 2.7a - Fig. 2.7l show, for each object, the power spectrograms of the recorded audio, the extracted resonance mode
mixed audio, and the absolute error between the two. . . 34 2.8 Variousshapesandmaterialsused in the material similarity perceptual
study described in Sec. 2.4. Six representative shapes: stick, cube, bunny, sphere, plate, and torus; five synthetic materials modeled with Rayleigh
2.9 Three different sizes(1x, 2x, and 4x) for each shape, as shown on the
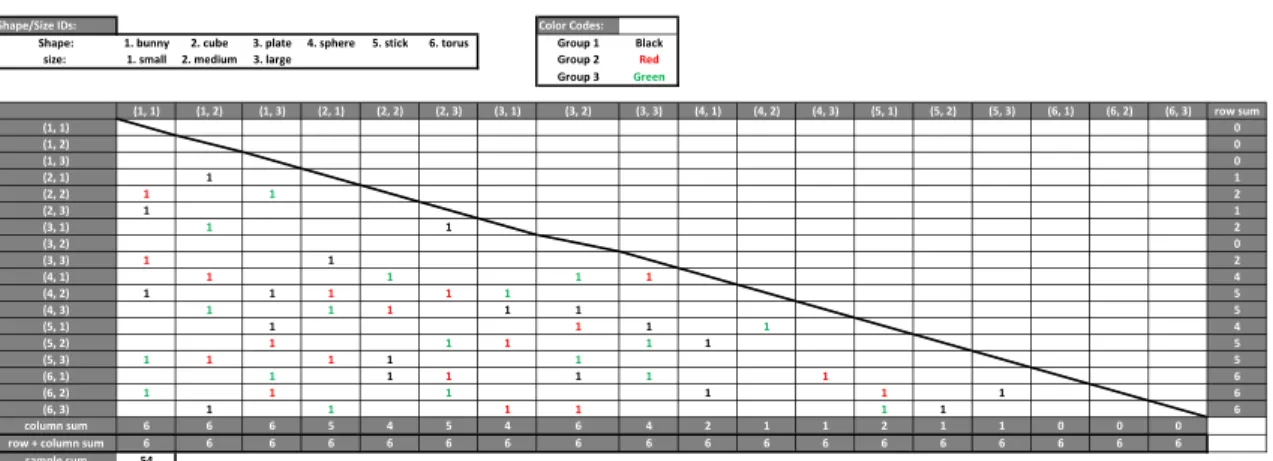
metallic bunny example in this figure. . . 35 2.10 Sampling schemes for subgroups: The number 1 marked in the spreadsheet
cells indicates a selected combination. The shape and size IDs are listed in the top left corner of this table. The three different colors represent three different sampling subgroups. In each subgroup, each geometry of a distinctive size and shape is selected exactly twice, and all the combination pairs are different in both size and shape among the selected two geome-try instances. Notice the combined three subgroups appear to randomly
sample all possible pairings. . . 36 2.11 Consistency and confidence levels for synthetic audio trials across shapes
for all materials. The radii of the disks represent confidence levels, which
are also shown as the numbers below the disks. . . 37 2.12 Consistency and confidence levels for synthetic audio trials across sizes
for all materials. The radii of the disks represent confidence levels, which
are also shown as the numbers below the disks. . . 38
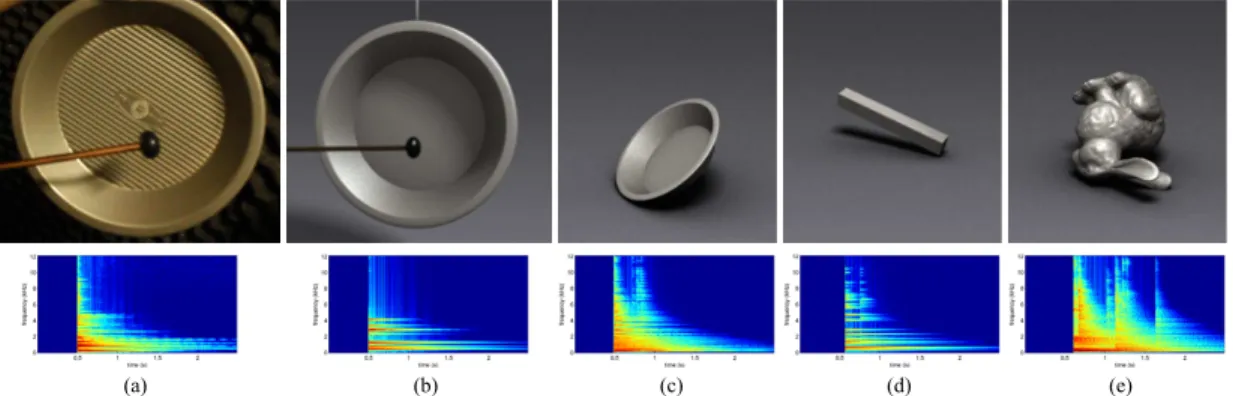
3.1 From the recording of a real-world object (a), our framework is able to find the material parameters and generates similar sound for a replicate object (b). The same set of parameters can be transfered to various virtual
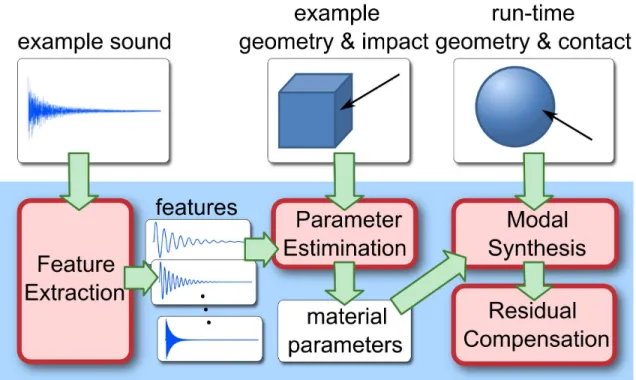
objects to produce sounds with the same material quality ((c), (d), (e)). . . 39 3.2 Overview of the example-guided sound synthesis framework (shown in the
blue block): Given an example audio clip as input, features are extracted. They are then used to search for the optimal material parameters based on a perceptually inspired metric. A residual between the recorded audio and the modal synthesis sound is calculated. At run-time, the excitation is observed for the modes. Corresponding rigid-body sounds that have a sim-ilar audio quality as the original sounding materials can be automatically synthesized. A modified residual is added to generate a more realistic final
sound. . . 42 3.3 Results of estimating material parameters using synthetic sound clips. The
intermediate results of the feature extraction step are visualized in the plots. Each blue circle represents a synthesized feature, whose coordinates (x,y,z) denote the frequency, damping, and energy of the mode. The red crosses represent the extracted features. The tables show the truth value,
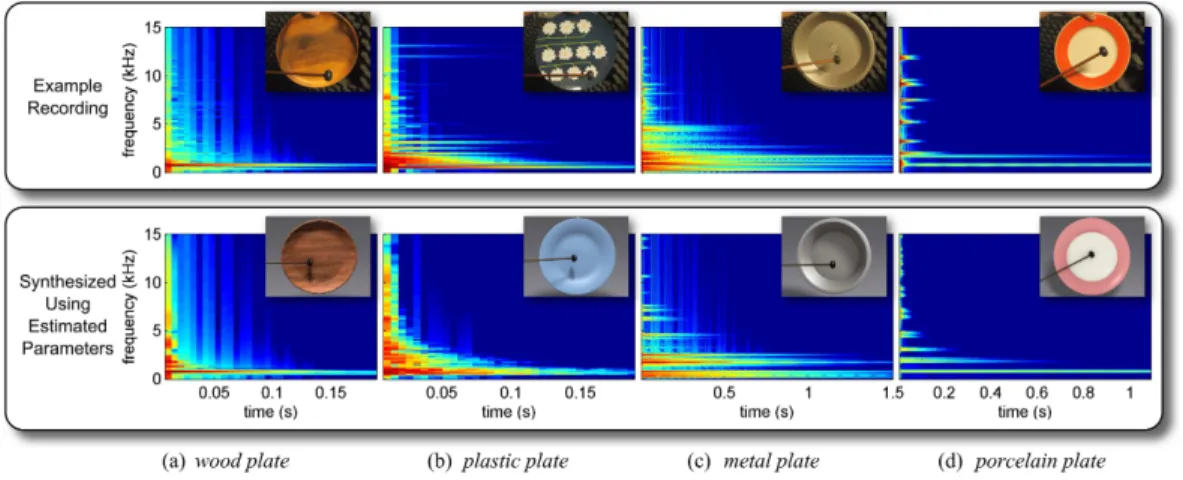
estimated value, and relative error for each of the parameters. . . 47 3.4 Parameter estimation for different materials. For each material, the
mate-rial parameters are estimated using an example recorded audio (top row). Applying the estimated parameters to a virtual object with the same geom-etry as the real object used in recording the audio will produce a similar
3.5 Feature comparison of real and virtual objects. The blue circles represent the reference features extracted from the recordings of the real objects. The red crosses are the features of the virtual objects using the estimated parameters. Because of the Rayleigh damping model, all the features of a
virtual object lie on the depicted red curve on the (f,d)-plane. . . 49 3.6 Transfered material parameters and residual: from a real-world recording
(a), the material parameters are estimated and the residual computed (b). The parameters and residual can then be applied to various objects made of the same material, including (c) a smaller object with similar shape; (d) an object with different geometry. The transfered modes and residuals are
combined to form the final results (bottom row). . . 49 3.7 Comparison of transfered results with real-word recordings: from one
recording (column (a), top), the optimal parameters and residual are es-timated, and a similar sound is reproduced (column (a), bottom). The parameters and residual can then be applied to different objects of the same material ((b), (c), (d), bottom), and the results are comparable to the
real-world recordings ((b), (c), (d), top). . . 50 3.8 The estimated parameters are applied to virtual objects of various sizes
and shapes, generating sounds corresponding to all kinds of interactions
such as colliding, rolling, and sliding. . . 50
4.1 Interaction Handling: Given contact information, this module will classify the type of contacts based on velocity and contact normals. It then uses the three-level surface representation for contact handling to generate
impulses that drive the sound synthesis module. . . 59 4.2 Different Contact States. The arrows indicates the linear velocity of
the object. The dots indicate the contact point, and the line between them
indicates the contact area. . . 60 4.3 The Three-level Contact Surface Representation. (a) The trapezoid
conceptualizes the geometry of the object. (b) The wiggly curve represents the surface of the geometry after the surface normals being changed by a normal map. (c) Within one pixel, the roughness of the surface is represented by a fractal noise. The geometry, bumpiness, and roughness
models all contribute to various levels of frictional interaction. . . 62 4.4 Impulse Computation. (a) The pathPtraced by an object sliding against
another object within a time step, and the normals stored in the normal map around the path. The path lies on the surfaceF, which is represented coarsely with a low-resolution mesh (here a flat plane). (b) The normal map suggests that the high-resolution surface looks like f, and the object is expected to traverse the path P0. (c) The impulse along the normal direction can be recovered from the geometry configuration ofn,N, and
4.5 The System Setup. A user is synthesizing sound using a tablet connected to our sound rendering system by moving the stylus to interact with the
virtual environment. . . 65 4.6 Comparison: Snapshot images of a pen scrapping on three surface
textures with different normal maps. The wave plots to the right show the sounds generated by our method (upper) and those generated from
previous methods with only contact and friction sounds (lower). . . 70 4.7 An example of a contact sound generated from the virtual marimba-like
instrument. The bars are set to have different material parameters. In the three wave files shown above, sound waves correspond to marimba (b:
wood), xylophone (c: metal), and a user designed material (d). . . 71 4.8 Many objects interacting with each other, making colliding, rolling and
sliding sounds. . . 71 4.9 Contact sounds (shown in wave plots below each image) generated by our
method by the objects moving in a game-like environment, where boxes
slide through the same surface with three different textures. . . 72
5.1 Tabletop Ensemble Multiple players performing music using our virtual
percussion instruments. . . 74 5.2 The system pipeline of Tabletop Ensemble. During the preprocessing
stage, our system automatically extracts the material parameters from a sample audio recording for a musical instrument. Given the geometry of each virtual instrument and its material parameters, I can precompute the acoustic effects due to the instrument’s body cavity. At run time, user inter-action with the multi-touch table is first interpreted by the input processing module and forwarded to sound synthesis engine. Synthesized sounds for instruments with cavity structures are modulated by the precomputed
acoustic effects to generate the final audio. . . 76 5.3 The optical multi-touch table with diffuse side illumination, upon which
our virtual percussion instruments are built. . . 78 5.4 A snapshot of the cross section of a soft ball striking against X-Y plane at
a velocityV. After time∆t, the ball is deformed, and its center position in Z-direction can be calculated. Velocity in Z-axis can be derived from this
position and the elapsed time information as discussed in Sec. 5.4.1. . . 81 5.5 Estimated Z-velocity vs. real velocity values: This experiment is
per-formed under four different tempos for strikes, i.e. 60, 100, 150, and 200
5.6 Numerical acoustics precomputation pipeline: The input to our system is a 3D model of the virtual instrument. I assign material properties to its different parts based on the type of percussion instrument I want to model. Next, I place impulsive sound sources (red spheres) at sampled positions on its sound generating surface, run the numerical simulation and collect impulse responses at 3D grid positions (blue spheres) corresponding to
each source. This impulse response is encoded and stored for run-time use. . . 84 5.7 5.7a shows a virtual metallic xylophone, and 5.7b shows a five-piece drum set. . . 86 5.8 Discretized mesh representation for the xylophone bar and drum head
models used in this system. The red dots in 5.8b indicate fixed nodes. . . 87 5.9 Acoustic simulation results for metallic (top row) vs wooden (bottom row)
drum at different time-steps with absorption coefficient of 10% and 30%
respectively. . . 88
6.1 Virtual Musical Instruments: The two images on the left show a user editing virtual musical instruments and a screenshot of the mobile
applica-tion inediting mode, while the two on the right showplaying mode. . . 91 6.2 Playing Mode System Pipeline: Raw multi-touch events registered by
touch screen are processed by theInput Approximatorand interpreted as meta interaction data. These data are used to drive the efficient physically-based sound synthesis module, which takes the instrument geometry and materials defined ineditting mode. The interpreted interaction data also determine the dynamic animation and vibration the user experiences. To-gether richly varying multimodal feedback that corresponds to the user
input is computed in real time. . . 93 6.3 Input Approximation:Dimentionality reduction that abstracts and
CHAPTER 1: INTRODUCTION
In our everyday life, we are constantly engaged in interactions that involve different senses, e.g. sight, hearing, and touch. In order to create an immersive experience in virtual environment (VE) applications, generating synchronous multiple sensory feedback is essential. In particular,auditory
feedback plays a vital part. In our real-world experiences, humans are constantly submerged in a large variety of audible sounds. When we type on a keyboard, we expect varying clicking sounds based on how fast or hard we strike the keys. When we walk in the streets, we expect our shoes to rub against different materials on the ground and make richly detailed sounds depending on this complex interaction. When we throw a bowling ball, we expect a series of loud impact sounds coming in synchrony with the dynamic collision among the ball, the pins, and the surrounding environment. My thesis focuses on studying physically based techniques that automatically synthesizes richly varyingauditoryfeedback inrealtimeand utilizing detailed user interaction information to drive this sound synthesis process. I aim to design and evaluate dynamicmultimodalapplications that generate sounds corresponding closely with users’ visual and touch sensory.
Recently, visual simulation and rendering have been immensely developed and studied, in comparison, auditory simulation has been largely overlooked. The computer-generated imagery in modern movies, video games, simulators, and other VE applications are often simulated with physically based methods and then rendered at photo-realistic quality with advanced ray tracing or rasterization techniques. Meanwhile, the accompanying audio component is usuallymanually
recorded, edited, and then synchronized with the visual by foley artists and sound designers. Unfor-tunately, this is a labor-intensive practice. More importantly, it cannot be applied to all interactive applications, in which it is still challenging, if not infeasible, to produce sound effects that precisely capture complex interactions that cannot be predicted in advance. On the other hand,physically
based sound synthesisis capable of reflecting the variations and diverse configurations at run-time.
real-timeapplications in particular demand responsive and richly-varying auditory feedback that closely corresponds to information in other senses. The first part of my thesis presents techniques that advance real-time physically based sound synthesis for rigid bodies and proposes a novel framework that facilitates this process.
The sense of touch is also ubiquitous in our daily-life. Haptic research has long been studying generating feedbacks in the sense of touch through various novel materials and devices. However, very few haptic devices have gained mainstream popularity. Withmulti-touchdisplays becoming prevalent instead, much richer real-time input and control data from users’ touch interaction are readily available for VE applications compared with the traditional cursor or joystick based interfaces. My thesis examines how users’ active touch and contact that are captured by consumer multi-touch devices can be translated into physical performance models that control the sound simulation. Applications for virtual musical instruments are studied. Such an interactive, multimodal system would offer capabilities for expressive music playing, rapid prototyping of virtual instruments, and active exploration of sound effects determined by various physical parameters. Moreover, I demonstrate that through effective algorithms this is feasible on mobile hardware, where computing resources is limited.
1.1 Challenges
With state-of-the-art real-time sound synthesis techniques and current multi-touch enabled devices, I have identified the key challenges for real-time physically based sound synthesis and its adoption for multimodal interaction.
Real-Time Performance: Human’s audible frequency range is between 20Hz and 22,000Hz, so the audio refresh rate has to be as high as 44,000Hz. This directly translates into extremely small time steps for real-time sound simulation. Within such a short time step, faithfully solving for the complex dynamics that drives the sound synthesis is infeasible. Moreover, on mobile multi-touch devices, where computing resources are scarcer, with touch event tracking and visual renderings, very limited resources are left for user interaction modeling and sound simulation.
materials with a much simpler model. Firstly, no previous work has studied if this simple model is sufficient to be considered geometry-invariant so that it is usable across virtual objects of different shapes and sizes. Without this property, it is infeasible to adopt this material model for complex applications. Moreover, it is painstakingly difficult to obtain high-quality material parameters for this model. While pre-processing takes minutes to hours depending on the complexity of the geometry, so far it has been challenging and laborious to explore and identify material parameters users desire. Limitations on Multi-Touch Devices: With visual, auditory, and touch interactions happening at the same time, one of the biggest challenges is how to diminish any perceptible latency among these components. Moreover, multi-touch devices usually only have sensors for tracking interaction on the touch surface, so accurately modeling user interaction dynamics in 3D space is a hard problem to solve. On mobile devices like tablets and phones, the above challenges coupled with limited computing power make it even more difficult to create a highly responsive and integrated multimodal experience.
1.2 Previous Work
1.2.1 Sound Synthesis
In the last couple of decades, there has been strong interest in digital sound synthesis in both computer music and computer graphics communities due to the needs for auditory display in virtual environment applications. The traditional practice of Foley sounds is still widely adopted by sound designers for applications like video games and movies. Real sound effects are recorded and edited to match a visual display. More recently,granular synthesisbecame a popular technique to create sounds with computers or other digital synthesizers. Short grains of sounds are manipulated to form a sequence of audio signals that sound like a particular object or event. Roads (2004) gave an excellent review on the theories and implementation of generating sounds with this approach. Picard et al. (2009) proposed techniques to mix sound grains according to events in a physics engine.
ubiquitous rigid-body sounds play a vital role in all types of virtual environments, and these sounds are what I focus on in this chapter. O’Brien et al. (2001) proposed simulating rigid bodies with deformable body models that approximates solid objects’ small-scale vibration leading to variation in air pressure, which propagates sounds to human ears. Their approach accurately captures surface vibration and wave propagation once sounds are emitted from objects. However, it is far from being efficient enough to handle interactive applications. Adrien (1991) introducedmodal synthesis
to digital sound generation. For real-time applications, linear modal sound synthesishas been widely adopted to synthesize rigid-body sounds (van den Doel and Pai, 1998a; O’Brien et al., 2002b; Raghuvanshi and Lin, 2006b; James et al., 2006a; Zheng and James, 2010a; Ren et al., 2012a). However, despite its extensive adoption, the Rayleigh damping model has never been formally evaluated for its transferability across varying shapes and sizes. In other words, it has not been formally studied and validated that the same set of Rayleigh damping coefficients along with the intrinsic material parameters, i.e. density and elasticity, preserve the same sense of material perception, if they are applied to objects made of the same materials but different shapes and sizes. This method acquires a modal model (i.e. a bank of damped sinusoidal waves) usingmodal analysis
and generates sounds at runtime based on excitation to this modal model. Moreover, sounds of complex interaction can be achieved with modal synthesis. van den Doel et al. (2001a) presented parametric models to approximate contact forces as excitation to modal models to generate impact, sliding, and rolling sounds. More recently, Zheng and James (2011) created highly realistic contact sounds with linear modal synthesis by enabling non-rigid sound phenomena and modeling vibrational contact damping. Moreover, the standard modal synthesis can be accelerated with techniques proposed by (Raghuvanshi and Lin, 2006b; Bonneel et al., 2008a), which make synthesizing a large number of sounding objects feasible at interactive rates.
1.2.2 Multimodal Applications
Multi-touch hardware and software have been actively studied and innovated for many years. As early as 1985, Buxton et al. (1985) analysed touch-input devices and compared them with conventional mice and joysticks. Nowadays, multi-touch technologies are mainly categorized into three types of devices:capacitive sensing,resistive sensing, andoptical sensing. Han (2005) invented a low-cost optical multi-touch sensing technology that made fast multi-touch on a large surface more practical. Rosenberg and Perlin (2009) designed an inexpensive and lightweight multi-touch input pad that provides pressure-sensing, and this device can be attached to assorted displays for a direct touch experience. With the prevalence of capacitive sensing devices like the iPhone and iPad, average digital device users have become familiar, comfortable, and even used to interacting with multi-touch. Such expressive interfaces encourage much more intuitive and natural interactions from users and also offer applications additional dimensions for input information.
One prominent format of such interface is the multi-touch tabletop, which has low cost and the capability for multiple-user collaboration. It is a great candidate for building multi-modal interactive systems. Researchers have employed such technology for creating music and sounds in general. Davidson and Han (2006) employed their multi-touch tabletop to control widgets that modify sound synthesis. Kaltenbrunner et al. (2006) designed a tangible multi-touch interface that allows both local and remote collaboration on synthesizing audio. Hochenbaum and Vallis (2009) built a multi-touch table and applied it to generating parametric sounds and remotely controlling real drums. However, none of these works attempts to virtually simulate musical instruments. Various techniques for finger tracking are surveyed by Sch¨oening et al. (2009). These methods facilitate higher-level touch interpretation and gesture recognition. Nevertheless, none of those techniques handles percussive interactions, in which case striking velocity is required to be estimated.
1.3 Thesis Statement
Through studying the geometry-invariant property, a novel example-guided framework makes real-time physically based sound synthesis feasible and easy to adopt for virtual environment applications. Combined with an efficient contact sound synthesis model and expressive multi-touch handling, the richly varying synthetic sound effects provide a responsive and immersive multimodal interaction that closely couples visual rendering, auditory simulation, and touch input.
1.4 Main Results
The goal of my work is to develop techniques that advancereal-timephysically based sound synthesis, make it feasible and easy-to-adopt for VE applications, and finally apply such sound simulation approaches to creating richly varying multimodal interaction:
1.4.1 Evaluation of the real-time sound synthesis material model:
Through an empirical analysis and a psychoacoustic study, I evaluate and conclude that the widely adopted real-time sound synthesis model, which assumes Rayleigh damping, can be largely considered geometry-invariant. As a result, the same set of material parameters can be applied to objects of various geometry while the same sense of material is generally preserved.
1.4.2 Example-guided framework for material parameter estimation:
A novel framework that automatically identifies material parameters for sound synthesis based on one audio recording example is presented. With this framework, adopting real-time physically based sound synthesis for various VE applications that involve a large number of objects is now feasible.
1.4.3 Efficient contact sound computation:
1.4.4 Real-time sound synthesis driven by multi-touch:
Rich and detailed modeling of user interaction based on the tracked multi-touch input is presented. With this information, physically based sound synthesis closely respond to users’ rich and dynamic input. A multimodal interaction coupling visual rendering, auditory simulation, and multi-touch input is presented on both large-size tabletop and mobile tablet devices.
1.5 Organization
The rest of this dissertation is organized as follows:
CHAPTER 2: AUDITORY PERCEPTION OF MATERIAL PROPERTIES
2.1 Introduction
Realistic sound effects that closely correlate with visual stimulus play a vital role in many virtual environment (VE) systems and interactive 3D graphics applications, e.g. video games, immersive sim-ulators, and special effects. With recent advances in high-quality audio generation, physically-based sound synthesis is gradually becoming a feasible and suitable approach for automatic incorporation of convincing sound effects in 3D graphics applications. These methods offer synthesized sounds based on material properties, object geometries, and physical contacts that excite the resonant objects.
Among various physically-based sound synthesis methods, modal synthesis(Adrien, 1991; Shabana, 1997) is one of the most widely used real-time techniques in VE applications. It is highly efficient because it reduces complex vibrations of arbitrary geometries and materials to a linear combination of decoupled resonance modes. The geometry, characterized typically by shape and size, along with material parameters, determines the resonance modes obtained in the preprocessing step calledmodal analysis. When modeling resonant materials using modal sound synthesis, thedamping
component has always been a challenging issue, largely because the mechanism of energy dissipation for vibration is complex and not well understood. Moreover, modal decoupling is only feasible under
(a) Sound booth (b) Glass (c) Porcelain (d) Ceramic (e) Wood (f) Metal
certain damping models.Rayleigh damping (Rayleigh, 1945) is one of the approximation models that enable such decoupling. As a result, it has been commonly adopted in rigid-body sound synthesis. However, to the best of our knowledge, though widely used in engineering applications, there has not been a formal analysis or rigorous evaluation of the Rayleigh damping model’s transferability across different geometry (i.e. shapes and sizes). In other words, it is unknown if a single set of Rayleigh damping model parameters is sufficient for an arbitrary space of geometries or if the parameters would have to be “tuned” for changing geometry.
Without such an assumption, the Rayleigh damping model can only be applied on a per-object basis and a new set of damping parameters must be selected and tuned for every unique geometry – evenwith the same materials. This greatly limits the use of this approximation model and the adoption of modal sound synthesis in general, since finding appropriate Rayleigh damping parameters
per objectis usually non-trivial, tedious, and time-consuming. This process of material parameter
tuning can quickly become prohibitively expensive for even a slightly complex VE scenario, where objects of different shapes with the same material are simulated. For example, the virtual fracture sound simulated by Zheng and James (2010b) is only feasible when assuming the same material parameters, including Rayleigh damping parameters, for the hundreds of fractured pieces.
In this chapter, I examine the Rayleigh damping model’s transferability across different shapes and sizes, using both real-world audio recordings and synthesized sounds to perform both objective and subjective analysis of this approximation model. Our goal is to determine if auditory perception of material under Rayleigh damping assumption is “geometry-invariant”, i.e. if this model is transferable across different shapes and sizes. To achieve this goal, I have conducted an empirical analysis and a number of psychoacoustic studies in exploring human auditory perception of materials using the Rayleigh damping model across different geometric variations, as well as crossmodal perception of material under the influence of geometry.
The rest of the chapter is organized as follows. In Sec. 2.2, I briefly describe the formulation of Rayleigh damping and related work on material perception in visual rendering and sound synthesis. Sec. 2.3 introduces our empirical study with real-world audio recordings. I analyze the recorded impact sounds of five sets of real objects. Each set contains several objects of thesamematerial but
differentshapes or sizes. I verify if these recordings of the same material can be fitted to the same
to evaluate material similarity. Based on the responses from the subjects, I analyze the transferability of Rayleigh damping model with respect to variation in shapes and sizes. In Sec. 2.5 and 2.6, I discuss our findings, the application of these findings, limitations, and possible future directions of this work.
2.2 Background
2.2.1 Rayleigh Damping Model
Sound from rigid bodies is generated due to resonant objects’ vibration. In order to model this process accurately and efficiently,linear modal synthesismethods (Adrien, 1991; Shabana, 1997) are commonly adopted. It assumes small deformations during object vibration, thus its dynamics can be modeled as a linear system described by:
M¨x+C˙x+Kx=f, (2.1)
wherex∈R3Nis the displacement vector of the system, andM,C,Krepresent the mass, damping, stiffness matrices, respectively.MandKcan be acquired through finite element analysis (O’Brien et al., 2002a), simple mass-spring formulation (Raghuvanshi and Lin, 2006b) and so on. In an
undampedsystem,M andKcan be diagonalized, and through generalized eigen-decomposition
the solution of Eqn. 3.1 can be obtained, which is a series ofdecoupledharmonic oscillators, or
resonance modes. Therefore, the complex dynamics of resonant objects are simplified and can now
be computed efficiently. This process is calledmodal analysis, which is a standard structural analysis technique in engineering. However, if thedampingterm is present, the vibration dynamics can be reduced to a decoupled linear system only ifCcan be diagonalized as well asMandK. Rayleigh (1945) proposed a formulation for the damping matrix:
which is a linear combination of mass and stiffness matrices, whereαandβare Rayleigh damping coefficients. Given this simplification, solutions to the linear system in Eqn. 3.1 are:
qi =aie−ditsin(ωit+θi). (2.3)
In this equation,ωianddiare respectively the angular frequency and the decay rate of theith mode, whileaiandθiare the excited amplitude and initial phase determined by runtime excitation.
I further observe that the Rayleigh damping assumption (Eqn. 2.2) and solutions to the dynamics formulation (Eqn. 3.4) define a frequency-decay relationship as a circle determined by Rayleigh damping coefficientsαandβ:
ωi2+ d i−
1 β
!2
= 1βp
1−αβ !2
. (2.4)
This frequency-dependent decay rate model is a simplification of the complex mechanism of real internal material friction.
This simple damping formulation allows modal decoupling, and, therefore, it has been extensively used in rigid-body sound synthesis (Cook, 2002b; O’Brien et al., 2002a; Raghuvanshi and Lin, 2006b; James et al., 2006b; Ren et al., 2010; Zheng and James, 2010b; Ren et al., 2012a).
2.2.2 Related Work
Human hearing and auditory perception have been widely studied by researchers. Among them, Gaver (1988) designed experiments to study the perception of everyday sounds, more particularly in sonic events, such as struck bars of wooden and metallic materials, and went on to apply his results to designing user interface with auditory icons. Wildes and Richards (1988) studied recording audio of anelastic solids and determined that theangle of internal friction,tan(φ), is constant throughout
all geometries of the same material. This work essentially defines a simple damping model, in which decay rate is linearly dependent on frequency. This damping model has been adopted by previous sound synthesis work (e.g. (Doel and Pai, 1998; Takala and Hahn, 1992)).
Glass Material Porcelain Material Ceramic Material Wooden Material Metallic Material
GREEN BLUE
RED MAGENTA
20 cm
(a) Glass bowls
GREEN BLUE MAGENTA RED
15 cm
(b) Porcelain set
15 cm
GREEN
BLUE
RED
(c) Ceramic Tiles
8 cm
GREEN
BLUE
RED
(d) Wooden Blocks
GREEN
BLUE
RED
MAGENTA
30 cm
(e) Metallic Pots
(f) Glass: Mode Fitting (g) Porcelain: Mode Fit-ting
(h) Ceramic: Mode Fit-ting
(i) Wood: Mode Fitting (j) Metal: Mode Fitting
Figure 2.2: Fitting objects’ resonance modes to the Rayleigh damping model. The top row shows real-world objects used in this experiment. The bottom row presents the fitting results, where the bottom plane represents thefrequency-decayplane, the values in the height axis are relative energy, and the black curves on the frequency-decay plane visualize the fitted Rayleigh damping model. The color codes on the real objects match their extracted resonance modes in the same color.
parameters in this sound synthesis model. In particular they found that the decay parameterτd, or equivalently, the internal friction coefficienttan(φ), is a better indicator than frequency alone
in determining material similarity. This work suggests that the decay parameter can be used as a shape-invariant material property for synthesizing sounds. They also found that when subjects were asked to directly assign a gross material category for a given synthetic sound, it is the combination of both the frequency and decay parameter that determines their categorization.
However, the constant internal friction model is not sufficient. Krotkov et al. (1996, 1997) analyzed the recordings of hitting real world objects of different materials and observed that for a given material, the internal friction is not a constant but instead a function of frequency. They suggest that the shape invariance may be encoded in the functional form of the relation oftan(φ) and
frequency, and proposed that a quadratic function appears to be a possible fit. In fact, theRayleigh
dampingmodel is one such quadratic formulation for relationship between damping and frequency.
properties to perceptual dissimilarity of the resulting sounds were studied, and a two-dimensional perceptual space was found to correlate with the material properties, namely the density and one of the two viscoelastic damping coefficients. Their result attests to the perceptual salience of energy-loss phenomena in sound source behavior. In another study, McAdams et al. (2004) studied material categorization of recorded impact sound, and a large set of acoustic descriptors related to frequency, damping, and loudness. They found that a slightly modified measure, tan(φaud), of damping is
sufficient for recognition of gross material categories. For example, they combined steel with glass as a ”gross” category steel-glass. They also combined wood and plexiglass, a special type of plastic, as plastic.
2.3 Empirical Analysis of Real-World Recordings
In this experiment, I use recorded audio from real-world objects to evaluate the transferability of Rayleigh damping model across different geometry. To verify if the Rayleigh damping model is capable of capturing the intrinsic material damping that does not vary with the object’s shape and size, I fit the recorded audio to a sound synthesis model using the Rayleigh damping assumption. If impact sounds fromsame-materialobjects indifferent shapes and sizescan be well approximated with the same Rayleigh damping model, this material model can be considered geometry-invariant across these objects. Five sets of real-world objects are selected for this experiment. Each set consists of three to four items made of the same material but with different geometry, i.e. varying shapes and/or sizes. The five sets are glass bowls (Fig. 2.2a), a set of porcelain dinnerware (Fig. 2.2b), ceramic tiles (Fig. 2.2c), wooden blocks (Fig. 2.2d), and metallic pots (Fig. 2.2e). The legend under these figures indicate the sizes of these experimental objects. In this section, I first describe the setup of our recording sessions. Then, I use an existing method to extract theresonance modesfrom the original recordings, and the summation of these key features accurately represent the recorded audio. Finally, I present the results for fitting these resonance modes to corresponding Rayleigh damping models. The fitting results are shown in the bottom row of Fig. 2.2, where the resonance modes’ colors match the color codes of the real objects shown in the top row.
Here, I show feature extraction results for materials: porcelain, ceramics, wood, and metal. The objects used in this empirical study are shown in Fig. 2.2b, 2.2c, 2.2d, and 2.2e. The power spectrograms of the feature extraction results are Fig. 2.5, 2.4, 2.6, 2.7.
2.3.1 Recording Setup
care is taken during the striking motion to minimize the swinging of the struck object, so that ringing sound effects are reduced. In order to limit the variation to only geometry and material, I manually control the striking motion’s magnitude and direction to be as consistent as possible throughout all recordings. To diminish the hit point variation, all strikes are aimed at the center position of objects, for example the center point on the bottom of the glass bowls, metallic pots, and porcelain set. The recording setups for some examples are shown in Fig. 2.1.
2.3.2 Resonance Mode Extraction
Recorded audio is complex and high-dimensional data, which are difficult to directly map to any simple material model. As shown by van den Doel et al. (2001a) and Corbett et al. (2007), many rigid-body impact sounds can be well approximated with the summation of a bank ofdamped
sinusoidswith different frequencies, decay rates, and amplitudes. Each damped sinusoid is considered
oneresonance mode, whose frequencies and decay rates are intrinsic to the particular object, while
the amplitudes vary with the magnitude and location of an impact applied to the object. I adopt these
modesas a high-level representation for the original sound.
2.3.3 Fitting Modes to the Rayleigh Damping Model
Once a resonance mode representation of a recording is acquired, I study how well the Rayleigh damping model can approximate these modes. I do so by fitting a curve following the Rayleigh damping model to these collected mode data points. For each material, the resonance modes of objects with different geometry are fitted to the same curve defined by one set of Rayleigh damping parameters. As shown in Fig. 2.2, I fit the curves on the 2D bottom plane to the observed (frequency, decay) pairs of modes. The values in the height axis represents relative energy of modes under a certain excitation. The relative energy values are used as weights in the least square regression, where the residual is defined as the difference between the observed and the predicted decay values. I weight the residual with relative energy because I want the fitted Rayleigh damping model to predict the more important modes (i.e. the higher energy modes) better than the less important ones. The fitting results for the five materials are shown as the black curves in Fig. 2.2f, 2.2g, 2.2h, 2.2i, and 2.2j. In Sec. 2.3.3, I statistically analyze the quality of the fit.
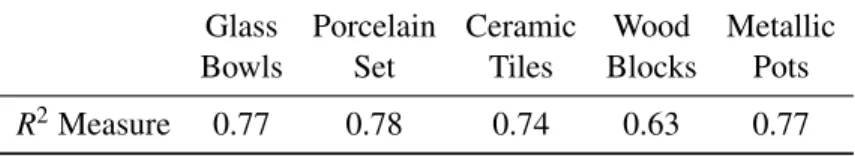
Quantitative Analysis of Goodness of Fit: In order to evaluate how well the curves fit the data, I compute thecoefficient of determination,R2, which is a widely used measure for assessing the
goodnessof regression using least squares techniques (Steel and Torrie, 1960). I adopted the standard
weightedR2formulation,
R2=1− Σwi×(yi−yˆi)
2
Σwi×(yi−y¯)2
, (2.5)
where{yi}are the decay values of the observed resonance modes,{yˆi}are the decay values predicted by the Rayleigh damping model given the resonance modes’ frequencies, ¯yis the mean of{yi}, i.e. the average value of observed decays, and{wi}are the weights, which are the relative energies of modes. Based on the standard interpretation ofR2measure, anR2of 1 means the curve model perfectly fits the observed data, and the closer the value to 1 the better the fitting. TheR2measures of the fitted Rayleigh damping models for the five materials in our experiment are listed in Table 2.1 (p<0.0001
for all materials). This indicate the Rayleigh damping model generate predictions that are strongly and significantly correlated with the observed models of all materials. In four out of the five materials, the model accounts for approximately 75% of the observed variance in modes.
micro-Table 2.1: Goodness of Fit for the Rayleigh Damping Model Glass Porcelain Ceramic Wood Metallic
Bowls Set Tiles Blocks Pots
R2Measure 0.77 0.78 0.74 0.63 0.77
structures) of the wooden material contribute to the fact that the simple Rayleigh damping model cannot fully reflect the damping phenomena of wood, hence the resonance modes fitted relatively poorly to the Rayleigh damping model. The relatively higher decay rates of the modes of wooden blocks may have also led to the poorer fitting. Nonetheless, theR2measures for all materials are reasonably high, indicating that in our experiment the Rayleigh damping approximation is accounting for a substantial, and highly significant, amount of the variance in the observed modes.
2.4 Perceptual Study on Material Similarity
In addition to the empirical experiment described in Sec. 2.3, I also conduct a psychoacoustic study where, in each trial, I ask subjects to determine if two sound clips played side-by-side are coming from objects made of the samematerial, while the objects can be of the same or different
geometry. The study objective is to determine if the Rayleigh damping model can indeed capture the
perceived material property sufficiently well to achieve transferability across different geometry. Throughout this perceptual study, the independent variables are material and geometry (i.e. shape and size). The dependent variables that I measure as results are accuracy and confidence for experiments using recordings and consistency and confidence for those using synthetic sounds. Sec. 2.4.1 introduces what independent variables are used, and Sec. 2.4.2.1 describes how the study is designed to reasonably sample all independent variable combinations. Finally, Sec. 2.4.4 presents a detailed definition for the dependent variables and their values for the studies. I performwithin subject
incidence. Combining these factors, I believe our subjects do not have any assumption about the material identities before hand and are not biased to give a same-material or different-material answer in either way.
2.4.1 Audio Stimuli
In this experiment, subjects’ perceived sense of materials is directly used as the indicator for determining whether Rayleigh damping model can be considered transferable across different geometry. However, human perception of materials is not solely dependent on the intrinsic material itself. It can also be affected by objects’ geometry (Klatzky et al., 2000; Vangorp et al., 2007). I hope to study to what extent this effects the perception of real-world materials, and this finding serves as the baseline for interpreting the results from synthetic sound. Therefore, bothrecordedandsynthetic
audio clips are used as stimuli in our perceptual study.
Forrecordedaudio stimuli, I use all the recordings acquired in Sec. 2.3. The first row in Fig. 2.2
shows pictures of the 18 objects for which impact sounds are used.
As tosyntheticsounds, to explore the wide range of geometry and material variations, I selected a representative set of variations for generating the audio stimuli.
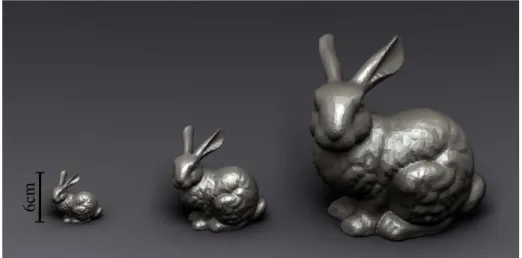
Shape variation: stick, cube, bunny, sphere, plate, and torus. They are shown in Fig. 2.8. These six sample shapes are chosen to represent shape variations such as complexity, dimensionality, and genus. For example, the simple cube shape is used, while the bunny shape is much more complicated. The plate is flat and circular, while the stick is much larger in one dimension than the other two. The sphere is a closed shape, while the torus has genus one. In addition, all shapes are solids that contain no cavity.
Size variation: small, medium, and large. I also vary the size of our sample shapes in order to study potential size-induced change in material perception. Three-size variations are adopted and illustrated on the example of bunny in Fig. 2.9. The smallest bunny is about 6cmtall, while the medium and large ones are respectively 2x and 4x the size of the small one. The same size variation is applied to all other shapes.
In total, there are 90 variations arising from the combinations of the six shapes, three sizes, and five materials. Synthetic impact sounds for these 90 variations are generated using modal synthesis with the Rayleigh damping assumption, and they serve as the synthetic audio stimuli in our psychoacoustic experiments.
2.4.2 Study Design
In designing these experiments, I face two major challenges. Firstly, as described in the previous subsection, I have 18 recorded and 90 synthetic audio stimuli. If I aim to cover all variations in the stimulus space, picking two stimuli to form a question results in a huge number (nearly 12,000) of combinations which is infeasible for the study questionnaire. Secondly, human perception of material is inevitably affected by geometry variation. It is difficult to separate such effects in our study. Moreover, most people probably do not pay enough attention to auditory sensations in their daily lives to have closely observed the geometry effects in perceiving materials. Therefore, it is challenging to study auditory perception of materials across different geometry due to subjects’ inability to distinguish variation in sound caused by geometry or material variation.
In this section, I first present an efficient stimulus sampling scheme that systematically picks pairing of audio stimuli to sample the combination space with a relatively small number of questions. Then, I describe our three-segment study procedure as an effort to better understand the perceived material variation due to geometric effects.
2.4.2.1 Stimulus Sampling
Table 2.2: Recorded stimulus sampling Material Geometry Count
Total: 6 Trials Group 1 Identical Different 5
Group 2 Different Different 1
Table 2.3: Synthetic stimulus sampling Material Geometry Count
Total: 50 Trials Group 3 Identical Different 30
Group 4 Different Identical 10 Group 5 Different Different 10
In Group 1, identical material and different geometry, one sample is selected for each real-world material out of the five I have, and the geometry combination is randomly selected. Group 2 is randomly selected following the constraint of different material and different geometry. I pick more samples for Group 1 because I hope to gather more data with real-worldrecordingson how geometry affects material perception with the same material.
Synthetic stimulus sampling:Each subject is asked to complete a total of 50 trials for this category. The proposed sampling is outlined in Table 2.3.
assign each of the five material choices to two of them. Thus, the 10 sample pairs for this subgroup are decided. For the subgroup of 10 pairs only different in shape, I fix the size configuration to be medium, randomly assign each of the five materials twice, and randomly combine shapes from the six options. Similarly, for the 10 pairs only different in size, I fix the shape configuration (five are fixed to be plates, and five are torus), two pairs for each material, and randomly combine sizes from the three options.
The 10 pairs in Group 4 and 5 follow the constraint of covering all possible material combinations (i.e. select any two out of five). For Group 4, an identical geometry configuration is randomly drawn for each pair, while for Group 5, two different geometry configurations are randomly selected for each trial.
With the above described sampling scheme, I define an approach that generates pairings in a random yet controlled fashion that provides us with experiments that cover a wide range of variants and focus on specific configurations that are central to our study (i.e. Group 3 in Table 2.3). Note that I did not include the group of identical material and identical geometry in either the recorded audio or the synthetic audio samplings. This is due to the subject’s perfect identification rate for such pairings in our preliminary studies.
2.4.2.2 Study procedure
Our perceptual study is conducted in the format of online surveys. The interface of the study is shown in the accompanying video, and the study is designed to consist of the following three major parts, where each subject takes a 7-trial training session and then judges 67 stimulus pairs.
question, images of the resonance objects are revealed to subjects, which show audio and visual renderings of both the geometry and material of the experiment objects.
Material discrimination:The second part is an audio-only material discrimination study. Subjects are presented with two side-by-side audio clips and asked two questions for each trial. First, they are asked if the two audio clips come from objects made ofthe same material. Radio buttons for yes and no are provided for subjects to input their answers. Second, they are asked to rate howconfidentthey are with their answer. Scores ranging from 0 to 10 represent ’not confident at all’ to ’very confident’. The 56 trials sampled as described in Sec. 2.4.2.1 are conducted in this part of experiments.
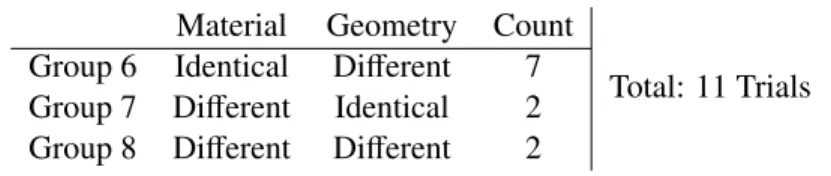
Material discrimination with geometry visualization: The final part of this experiment is an audio-visual material discrimination study. The questionnaire is the same as the previous part, except that two side-by-sideimages corresponding to the two audio stimuli are also shown to subjects. These images are visual renderings of the resonance objects’geometry, and subjects are informed that they only carry geometry information and no texture or material clues. This allows us to explore how the added geometry visualization affects the subject’s auditory perception of materials. A total of 11 trials are conducted, and they are sampled as shown in Table 2.4.
Table 2.4: Synthetic stimulus sampling withgeometry visualization Material Geometry Count
Total: 11 Trials Group 6 Identical Different 7
Group 7 Different Identical 2 Group 8 Different Different 2
A focus study: While the above study is relatively thorough, I hope to obtain more data in the category that is the most interesting to this study, i.e. Group 3 in Table 2.3, since I aim to evaluate if
Rayleigh dampingparameters transfer across geometry. Therefore, I also provide a focus perceptual
study that only asks 21 trial questions after the 7-step training. 15 of the the 21 questions are subsamples chosen from Group 3 in Table 2.3, and the other 6 are randomly sampled in different material combinations, so that the study is more balanced with both same and different material pairs.
2.4.3 Participants
is 28.40. The other 22 subjects completed the focus study, 8 are female, and the group average age is 32.27. All subjects reported normal hearing and performed the study at their own pace on a personal computer. All of them used headphones in the study for better audio quality, since frequency components at the high and low ends of audible spectrum might be inaudible through some consumer speakers.
2.4.4 Results and Analysis
The result of each trial is measured by the following two variables.
Consistency:Subjects are asked to answer if two audio clips are from the same material in each trial. For recorded stimuli, the concept ofaccuracyis directly adopted, since the ground truth of same or different materials for each trial pair can be determined, and an answer is correct or incorrect can be decided. For synthetic stimuli, I defineconsistency, which is analogous toaccuracyfor recorded stimuli. If subjects’ answer is consistent with the material model assumption, I define consistency as 1.00. If not, it is defined to be 0.00. For example, if two audio clips in one trial are synthesized using the same material parameters, and the subject consider them the same material, I assign 1.00 to the consistency of this trial. The mean consistency is essentially the proportion of subjects’ answers consistent with the tested material model assumption.
Confidence:Besides the yes and no material discrimination question, subjects are also asked to rate their confidence with their decision. This 0 - 10 value indicates how confident the subject is, while 0 means not confident at all, and 10 is very confident. In other word, if the subject has difficulty or uncertainty in answering the material discrimination question, the confidence value of this trial should be low.
Results from the full-length studies are used in the analysis below. The focus study is solely designed to provide more samples for Group 3 in Table 2.3, so its results are only used in analyzing the across-shape and across-size cases described in Sec. 2.4.4.2. In all the results, I report both
meansand 95%confidence intervals(CI) for the accuracy/consistency and confidence values for each
group, presented as CI centered around means. Where appropriate,paired t-tests(Howell, 2009) are performed to test the statistical significance of hypotheses on comparisons between two groups, and
I adopt .05 as the p-level for significance. The rest of this subsection includes the results and analysis of each data group. More observation and discussion are presented in Sec. 2.5.
2.4.4.1 Recorded stimulus trials
Table 2.5 shows the 95% confidence intervals of accuracy and confidence for all trials ofrecorded
stimulus respectively in Group 1 and 2. Notice in Table 2.5, the accuracy rate is only 84.75% for Group 1. This indicates even with real-world recordings, when sounds of objects from identical materials are presented, subjects can be affected by the geometry variation and mistake identical materials as different. Perfect material discrimination across geometry variation is improbable. The variance in accuracy values is relatively large for Group 2, I suspect it is due to the small number of trials I performed for this particular category.
Table 2.5: 95% CI for accuracy and confidence for recorded audio trials
Material Geometry Accuracy Confidence
Group 1 Identical Different 84.75%±6.95% 7.46±0.52
Group 2 Different Different 85.00%±16.06% 7.70±0.77
2.4.4.2 Synthetic stimulus trials
Table 2.6 presents the 95% CI centered around mean consistency and confidence for each group throughout all synthetic audio trials. Notice the consistency rate for Group 3 is quite high, which indicates subjects perceive Rayleigh damping as transferable across geometries in a large proportion (around 76%) of the study trials. A paired two-tailed t-test between Group 3 and 5 indicates subjects are more capable of detecting mismatches than matches in material, when geometry differs (tconsistency(20) = −3.01, pconsistency < 0.007;tcon f idence(20) = −2.43, pcon f idence < 0.025). The same type of t-test between Group 4 and 5 fails to support the hypothesis that a geometric mismatch heightens reports of material mismatch (tconsistency(20) = −1.94, pconsistency < 0.068;
tcon f idence(20)=−1.23, pcon f idence<0.233).
Table 2.6: 95% CI for consistency and confidence for synthetic audio trials Material Geometry Consistency Confidence Group 3 Identical Different 76.73%±4.29% 7.25±0.57
Group 4 Different Identical 81.17%±4.97% 7.65±0.53
Group 5 Different Different 87.50%±4.69% 8.07±0.46
Table 2.7: 95% CI for consistency and confidence for synthetic materials
Wood Plastic Porcelain Metal Glass
Consistency 70.77%±7.92% 90.81%±4.82% 77.64%±7.23% 81.69%±6.84% 80.38%±7.49% Confidence 7.26±0.52 7.54±0.62 7.25±0.71 7.87±0.60 7.24±0.62
audio trials. For all five materials, consistency and confidence are relatively high. Notice that the material of wood leads to the lowest performance.
Synthetic stimulus trials - same material, across shapes and sizes respectively: The focus of our study is to test if the same sense of material is preserved across different geometry (i.e. shapes and sizes), if the same material parameters including the same Rayleigh damping coefficients are assumed. Below, I present results categorized respectively into different shapes while sizes are fixed (Fig. 2.11) and different sizes while shapes are fixed (Fig. 2.12). All results in this part are calculated from the identical material trials in both the full-length and the focus study. Therefore, a total of 42 subjects’ results are included. Fig. 2.11 shows results across all shapes: stick, cube, bunny, sphere, plate, and torus. Fig. 2.11a, 2.11b, 2.11c, 2.11d, and 2.11e present data for materials: wood, plastic, porcelain, metal, and glass, respectively. Fig. 2.12 shows results across all sizes: small, medium, and large. Fig. 2.12a, 2.12b, 2.12c, 2.12d, 2.12e present data for materials: wood, plastic, porcelain, metal, and glass, respectively. Once again, trials of wooden material yield one of the worst consistency rates. Additionally, thesmallobjects in general appear to be identified as inconsistent with the material model more often than the other sizes. It also appears consistency varies more with shapes than sizes, which means, compared with sizes, a drastic shape change is more likely to lead subjects to identify sounds produced by the same material parameters as coming from different materials.
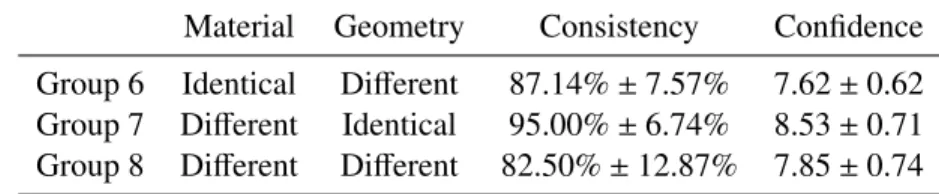
due to that the geometry is identical. When a subject is shown the visualization of two identical geometries, it is clear the only variable is material. In this case, subjects can judge material similarity purely based on the variation in the perceived audio and not be affected by geometry variation at all. The results with geometry visualization are also categorized into different materials and shown in Table 2.9. The mean consistency and confidence values are generally larger than those of the audio only results (Table 2.7), while the standard deviations are also larger, which can be due to the smaller number of trials performed. In fact, in the comments left by several subjects, they specifically pointed out that the geometry visualization made the material discrimination task easier for them. Table 2.8: 95% CI for consistency and confidence for synthetic audio trials withgeometry visualiza-tion
Material Geometry Consistency Confidence Group 6 Identical Different 87.14%±7.57% 7.62±0.62
Group 7 Different Identical 95.00%±6.74% 8.53±0.71
Group 8 Different Different 82.50%±12.87% 7.85±0.74
2.5 Discussion
Through the empirical experiment in Sec. 2.3 and the perceptual study in Sec. 2.4, I make the following key observations.
The Rayleigh damping model can be considered geometry-invariant: In the empirical study, the Rayleigh damping model appeared to serve as a reasonably good approximation for five real-world resonance materials, based on the observed fitting results (i.e. R2 measure in Table 2.1) for the experimental materials across different geometries. In addition, synthetic audio generated with the Rayleigh damping model were tested in our perceptual study. High consistency between these adopted synthetic materials and subjects’ material discrimination were recorded (76.73% for Group 3 synthetic audio only trials in Table 2.6 and 86.14% for Group 6 synthetic audio with geometry visualization trials in Table 2.8). The consistency rates indicate that synthetic sounds of various
Table 2.9: 95% CI for consistency and confidence for synthetic materials with geometry visualization
Wood Plastic Porcelain Metal Glass
geometry (i.e. sizes and shapes) using the same Rayleigh damping model are perceived as the same material at a very high percentage. In addition, the broken down across-shape and across-size consistency rates shown in Fig. 2.11 and Fig. 2.12 and the average consistency rates for each material recorded in Table 2.7 and Table 2.8 (with geometry visualization) are also relatively high, especially the ones with geometry information. Moreover, I need to consider that subjects are not capable of perfectly discriminating materials due to geometry variation. Evidence for this is shown in the recorded audio trials. Even if the underlying material is identical (no approximation with any model), subjects can mistake them for different materials. In fact, the mean consistency values for synthetic stimuli in Group 3 and 5 are not significantly smaller than those of recorded stimuli in Group 1 and 2, respectively. It suggests that synthetic stimuli with Rayleigh damping assumptions can be considered good approximations in terms of preserving the sense of materials that is comparable with that of real-world audio. From the results in our experiments, I verified when applying the same set of Rayleigh damping parameters across different geometries, the same sense of material is preserved to a large extent.
Multi-modal effects in auditory material perception:Respectively compare results in Table 2.6 and Table 2.8, and Table 2.7 and Table 2.9. I observe, with the added visualization of object geometry, subjects’ material perception shows significantly higher agreement with the Rayleigh damping model. In fact, a paired two-tailed t-test between Group 3 and 6 hastconsistency(20)=−3.34, Pconsistency<0.003, andtcon f idence(20)=−2.29,Pcon f idence<0.033, and same type of t-test between Group 4 and 7 show tconsistency(20) = −3.09, Pconsistency < 0.006, and tcon f idence(20) = −2.42,
Pcon f idence<0.026. This strongly indicates that when visual geometry information is present, which is the case for most graphics and virtual environment applications, the Rayleigh damping model is perceived as geometry-invariant at an even higher rate. Therefore, Rayleigh damping assumptions should be readily adopted as a geometry-invariant material approximation model in most virtual environment applications. In scenarios, where multiple objects of various geometry are present, I can apply the same set of material parameters in Rayleigh damping model to them, and users would generally perceive them as bearing the same auditory material.