OPIOID ANALGESIC PRESCRIBING AND OVERDOSE MORTALITY IN NORTH CAROLINA
Nabarun Dasgupta
A dissertation submitted to the faculty of the University of North Carolina at Chapel Hill in partial fulfillment of the requirements for the degree of Doctor of Philosophy in the
Department of Epidemiology.
Chapel Hill 2013
Approved by:
Steve Marshall, Ph.D. Carri Casteel, Ph.D.
ABSTRACT
NABARUN DASGUPTA: Opioid Analgesic Prescribing and Overdose Mortality in North Carolina
(Under the direction of Steve Marshall)
Mortality from drug overdose has risen since the 1990s. Composite International Classification of Disease (ICD-10) overdose definitions in state vital statistics
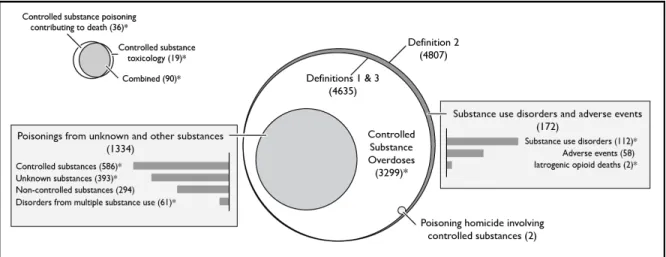
surveillance may include deaths that do not involve controlled substances while missing deaths that do. We evaluated seven ICD-10-based definitions using North Carolina mortality data from 2008 through 2011. Overdose deaths varied by definition, ranging from 734 to 1,202 per year. Up to 16.1% of deaths using the national definition showed no evidence of controlled substance involvement, however, additional deaths involving controlled substances were not identified. We propose a definition that includes deaths from substance use disorders, but removes deaths from pharmaceutical adverse events, resulting in 1,149 deaths per year from overdoses involving controlled substances.
Strong associations have been observed between amount of opioids dispensed and overdose mortality. Yet, clinical trials consistently show safety of opioid analgesics at high doses. To explore this paradox we conducted a prospective cohort study among North Carolina residents in 2010 to quantify dose-dependent overdose risk in routine clinical practice. Dispensing data were matched to overdose deaths identified in medical examiner records. Incidence rates were estimated using regression models.
but stayed elevated beyond 200 mg average daily milligrams of morphine equivalents. The dose-dependent effect was exacerbated by co-prescribed central nervous system (CNS) depressants; rates were ten times higher among opioid analgesic patients
ACKNOWLEDGEMENTS
I would like to thank the following for their contributions to this endeavor.
Committee: Steve Marshall, Michele Jonsson Funk, Scott Proescholdbell, Kurt Ribisl,
Carri Casteel
Aim 1: Kay Sanford, Kathleen Creppage
Aim 2: Bill Bronson, Chris Ringwalt, Annie Hirsch, Rick Saucier, Gabi Hubier
Manuscripts: Roxanne Saucier, Anindita Dasgupta
Subject Material: Fred Brason, Sid Schnoll, Mariana Garretson, Maya Doe-Simkins,
Robert Heimer, Allan Clear, Mark Kinzly, Rick Dart, Doug Kramer, Mary Beth Ritchey, Robert Childs, Lynn Webster, Corey Davis, Traci Green
Department of Epidemiology and the Injury Prevention Research Center: Nancy
Colvin, Carmen Woody, Tonya Watkins, Charlie Poole, Apostolos Alexandridis
Funding Agencies: Robert Wood Johnson Foundation and the Centers for Disease
Control and Prevention
Personal: Priya Dasgupta-Yeung, Avijit and Nandita Dasgupta, and many dissertation
support groups; John Brownstein, Clark Freifeld, Robin Heffernan
TABLE OF CONTENTS
LIST OF TABLES……… x
LIST OF FIGURES………. xi
LIST OF ABBREVIATIONS……….. xii
CHAPTER 1. INTRODUCTION Overview………...…... 1
Specific aims………...………... 3
CHAPTER 2. BACKGROUND Overview………...………... 4
International context……….……... 4
Drug-related mortality in the United States………... 5
Pain and public health……….………... 6
Opioid pharmacology and pain management………...………... 8
Clinical practice of pain management………...………... 13
Etiology of opioid overdose……….………... 15
Published studies on opioid analgesic dose and overdose death…………. 17
Figures………...………... 20
CHAPTER 3. RESEARCH DESIGN AND METHODS Overview………...………... 23
Mortality data………...………. 26
Prescription data………...…… 27
Time-at-risk calculations and determination of dose “cutpoints” for Aim 2.. 31
Mortality and prescription data linkage……….……... 32
Statistical approach for Aim 2……….. 33
Human subjects protection………... 34
Figures………..………...………... 35
CHAPTER 4. EXPLORATION OF DEFINITIONS OF OVERDOSE MORTALITY Overview………...………... 37
Introduction………...………... 37
Methods………...………... 40
Mortality data source……… 40
Definitions………...………... 40
Statistical analysis……….... 43
Results………...………... 43
Describing drug overdose deaths……… 43
Identifying pharmaceutical adverse event and substance use disorder codes………... 45
CHAPTER 5. A PROSPECTIVE COHORT STUDY OF HIGH-DOSE OPIOID ANALGESICS AND OVERDOSE MORTALITY
Overview………...………... 58
Introduction………...………... 59
Methods………...………... 61
Data sources….………...…… 61
Study design……….……… 62
Data linkage……….………. 62
Exposure definition..………... 63
Outcome definition………...………... 65
Access to care definition.……… 66
Analysis…………..………... 66
Human subjects protection.…….………... 68
Results………...………. 68
Opioid analgesic utilization patterns……….. 68
Overdose deaths………... 69
Extended-release and immediate-release opioid analgesics…….. 70
Benzodiazepines…………….. 71
Discussion………...………... 71
Strengths and limitations………. 76
Conclusion...………...………... 78
Tables and figures………...………….. 79
CHAPTER 6. SYNTHESIS Overview………...……….. 90
Strengths………...………. 94
Public health and policy impact………... 95
Directions for future research……….. 97
APPENDIX 1. ANALYSIS OF NARCOTIC UNSPECIFIED DEATHS……… 100
APPENDIX 2. SEASONALITY AMONG OVERDOSE DEATHS……… 103
LIST OF TABLES
Table 4.1. ICD-10-based definitions for identifying drug overdose deaths……. 54 Table 4.2. Annual overdose deaths, by fatal overdose definition, NC
residents, 2008 though 2011……… 55 Table 4.3. Drug toxicology codes reported, by fatal overdose definition, NC
residents, 2008 though 2011……… 56 Table 4.4. Deaths from different causes among decedents identified using
Definition 2, North Carolina residents, from 2008 through 2011…… 57 Table 4.5. Proposed ICD-10-based definition of overdose mortality from
controlled substances for vital statistics (Definition 8)………. 58 Table 5.1. Published studies of opioid analgesic dose and mortality………….. 86 Table 5.2. Incidence rates and incidence rate ratios for overdose deaths
involving opioid analgesics, by average daily milligrams of morphine equivalents, North Carolina Residents,
2010………. 87
Table 5.3. Incidence rates per 10,000 person-years for overdoses involving opioid analgesics, by average milligrams of morphine equivalents and formulation status, North Carolina Residents, 2010………. 88 Table 5.4. Incidence rates per 10,000 person-years for overdoses involving
opioid analgesics, by average milligrams of morphine equivalents and benzodiazepine prescription status, North Carolina Residents,
2010………. 89
Table 5.5. Rate differences per 10,000 person-years and number needed to harm for overdose deaths involving opioid analgesics, by average milligrams of morphine equivalents, formulation type and
benzodiazepine prescription status, North Carolina residents,
LIST OF FIGURES
Figure 2.1. Annual age-adjusted mortality rates per 100,000 for selected
diseases, United States, 2009………. 21 Figure 2.2. Rates of opioid analgesic overdose death, substance abuse
treatment admissions, and kilograms sold, United States, 1999 to 2010..………..…. 22 Figure 2.3. Age-adjusted proportion of adults reporting pain in the last three
months, by site of pain, United States, 2009. ……….. 23 Figure 3.1. Data cleaning steps for prescription data……….. 37 Figure 3.2. Visual representation of person-time accounting………. 38 Figure 4.1. Schematic representation of definitions of drug overdose deaths,
North Carolina residents, 2008 through 2011………... 59 Figure 4.2. All drug and opioid overdose death rates, North Carolina residents,
2008 through 2011..……….. 60 Figure 5.1. Data cleaning steps for prescription data used in study, North
Carolina, 2009 through 2011……… 91 Figure 5.2. Study participant patient flow diagram, North Carolina residents,
2010………. 92
Figure 5.3. Percents of prescribers, prescriptions, patients receiving opioid analgesics, and overdose deaths, by active ingredient and
formulation, North Carolina Residents, 2010……… 93 Figure 5.4. Incidence rates and incidence rate ratios for overdose deaths
involving opioid analgesics, by average milligrams of morphine
equivalents, North Carolina residents, 2010………. 94 Figure 5.5. Mortality rates for overdose involving opioid analgesics, by
average milligrams of morphine equivalents and formulation type, North Carolina Residents, 2010……….. 95 Figure 5.6. Incidence rate ratios for overdose deaths involving opioid
analgesics, by average milligrams of morphine equivalents and benzodiazepine prescription status, North Carolina Residents,
LIST OF ABBREVIATIONS
ACE Angiotensin-converting-enzyme
AIDS Acquired immune deficiency syndrome
ASTHO Association of State and Territorial Health Organizations AUC Area under the curve
CDC Centers for Disease Control and Prevention CI Confidence interval
CLR Confidence limit ratio
Cmax, Cmin Maximum and minimum plasma concentration CNS Central nervous system
COPD Chronic obstructive pulmonary disease
CSTE Council of State and Territorial Epidemiologists DEA Drug Enforcement Administration
DMHDDSAS Division of Mental Health, Developmental Disabilities and Substance Abuse Services
DPH Division of Public Health ER Extended-release
FDA Food and Drug Administration GABA γ-Aminobutyric acid
HIV Human immunodeficiency virus HR Hazard ratio
ICD International Classification of Disease INCB International Narcotics Control Board IQR Inter-quartile range
ISW Injury Surveillance Workgroup ITTT Intent-to-treat-type
LOESS Locally smoothed regression
ln Natural log
NB2 Negative binomial, type 2 NC North Carolina
NCHS National Center for Health Statistics NDC National Drug Code
NHANES National Health and Nutrition Examination Survey NNH Number needed to harm
NSAID Non-steroidal anti-inflammatory drug NSDUH National Survey on Drug Use and Health OCME Office of the Chief Medical Examiner OPR Opioid pain reliever
OR Odds ratio
mg Milligrams
MME Milligrams of morphine equivalents
LL Lower limit
PMP Prescription monitoring program
REMS Risk Evaluation and Mitigation Strategies SCHS State Center for Health Statistics
UL Upper limit
CHAPTER 1
INTRODUCTION
Overview
Non-medical use and misuse of prescription drugs are large and growing public health problems in the United States. Deaths from drug overdoses now account for more fatalities than motor vehicle-related deaths in the US [1]. The majority (65% nationally) of drug overdose deaths involve prescription opioid pain medications [2]. These fatalities are a result of both patients using the drugs for pain relief and those using the drugs primarily for euphorogenic effects.
Quantifying opioid-related overdose morbidity and mortality has been a persistent public health challenge. Over the last decade, vital statistics data collection systems have adopted the use of International Classification of Disease (ICD) codes to classify events. State-based vital statistics rely on composite ICD-based definitions of “overdose” that may include deaths that do not involve controlled substances, and may also be missing deaths that do involve controlled substances. For example, the main national ICD-based definition includes deaths resulting from “poisoning” by controlled
been issued by the Injury Surveillance Workgroup 7 (ISW) [3], but have not been evaluated. The sensitivity and specificity of the various ICD-based definitions of “overdose” is currently unknown.
At the national level, a linear ecological association has been observed between the total amount of opioids dispensed and parallel overdose morbidity and mortality, going back 15 years. This association has been observed at the national, state, and county level [4,5,6,7,8,9,10,11,12]. This has led to the general belief that opioids are overprescribed. However few studies have documented the association at the level of the individual patient [13,14,15,16,17]. Yet, clinical trials and their meta-analyses consistently show safety of opioid analgesics at high doses [18,19,20,21,22,23]. Additionally, there are concerns that many individuals in chronic pain in the United States do not receive adequate analgesic relief, and there is limited safety data on overdose risk at higher doses (e.g., over 150 mg per day) that are commonly prescribed to chronic pain patients in clinical practice. The ecological studies conducted to date have provided limited information relevant to current clinical practices. Among high-dose opioid analgesics, there are clinical choices between immediate-release (IR)
formulations dosed every four to six hours, and extended-release (ER) formulations dosed once or twice per day. There is vigorous debate in the policy realm about the relative safety of these two types of formulations.
Thus, there is a pressing need to more clearly quantify the dose-dependent
evaluate this hypothesis, we need to evaluate and compare the various definitions of opioid-related mortality.
Specific Aims
Aim 1. Evaluate definitions of opioid-related mortality for internal consistency.
Aim 1 Scope: Use decedent-level characteristics to evaluate differences between seven ICD-10-based definitions of opioid overdose mortality from North Carolina vital statistics. Evaluate the impact of including substance use disorders and pharmaceutical adverse events codes in definitions of overdose. Propose a definition for use in surveillance based on the findings.
Aim 2. Quantify the association between high-dose opioid analgesic utilization and opioid-related mortality.
Aim 2 Scope: Conduct a prospective cohort study using mortality data linked to opioid analgesic dispensing data to examine the association between dose and overdose risk. Describe patterns of clinical opioid analgesic utilization, focusing on prescribers,
CHAPTER 2
BACKGROUND
Overview
This section reviews the epidemiological, clinical and pharmacological knowledge base relevant to pain management and overdose. It includes a literature review on published individual-level studies of opioid analgesic dose and overdose death.
International Context
The use of opioids in the management of pain has long been tempered with concerns about abuse, addiction, and diversion of medicinal supplies into illicit channels of trade. The World Health Organization designates four opioids (morphine, codeine, methadone, buprenorphine) used to treat pain and addiction on the Model List of Essential Medicines [24]. The cultivation, manufacture, distribution, and dispensing of opioids are subject to international control, with the intent of assuring access for legitimate medical and scientific purposes while minimizing diversion and abuse [25]. These international obligations continue to influence national control programs.
There are significant differences among nations both with respect to utilization of controlled substances and the degree of concern over diversion of such drugs to
Narcotics Control Board (INCB), the United Nations body responsible for monitoring and enforcing the treaties that apply to the international manufacture, sale and distribution ofcontrolled substances [25]. These countries also have high levels of public concern with the non-medical use and abuse of prescription and illicit drugs. The public health problem created by the inappropriate use of opioids is pervasive in both countries.
Drug-related Mortality in the United States
In the United States, rates of mortality attributable to unintentional drug poisoning have risen consistently since the early 1990s [27]. In 2009, the national age-adjusted death rate from drug poisonings was 12.0 per 100,000, making it the leading cause of injury death surpassing motor vehicle-related injuries [28] (Figure 2.1). Overdose is the leading cause of death among young injection drug users in the United States [29] and outpaces mortality from injection-borne infectious diseases [1]. By way of comparison, in 2008 the age-adjusted mortality rates per 100,000 were 2.5 for viral hepatitis and 3.1 for HIV/AIDS [1].
The Centers for Disease Control and Prevention (CDC) report that “in 2007, approximately 27,000 unintentional drug overdose deaths occurred in the United States, one death every 19 minutes” [27]. In 2008, prescription opioid analgesics were involved in 73.8% of drug overdose deaths, meaning they were more frequently involved than heroin, cocaine and methamphetamine combined. The pharmaceutical opioids most often causally identified in post-mortem toxicology reports are fentanyl, hydrocodone, methadone, morphine, oxycodone and oxymorphone [6,27].
with these medicines (Figure 2.2). This observed association suggests that opioid analgesics are “overprescribed” for post-operative and other types of pain [30].
It is clear that, among the pool of decedents, there are heterogeneous reasons for ingesting prescription opioids. Deaths occur in pain patients who mistakenly take more pain relievers than directed by clinicians (misuse), as well as individuals using diverted opioids for euphoric effect, e.g., to get high. The percent of overdose decedents who had a prescription for the opioid involved in their overdose fatality is in the range of 44% to 91%, varying by state and definition [9,31,32,33,34], suggesting that substantial portions of those dying from an overdose are being exposed to pharmaceutical opioids outside of medical supervision. In contrast to mortality, in a national survey of young adults who endorsed nonmedical use of prescription analgesics, 53% reported they received them free from a relative or friend [35]. However, the median age of overdose death in the United States is around 40 years [36], while the peak in nonmedical use is in the 20s, suggesting that opioid use is causal but not sufficient to result in overdose death. Regardless of the reasons for ingestion of an opioid analgesic (e.g., pain,
addiction, etc.), there are multiple factors that influence whether the exposure will result in an overdose, and others that influence whether the overdose will be fatal.
Pain and Public Health
The belief in the causal connection represented by the linear association between opioid prescribing and overdose (Figure 2.2) is at the heart of much of the policy
response. The assumption that reducing the amount of opioid analgesics prescribed will result in fewer overdose deaths, although logical, has been subject to limited empirical investigation.
prescribed at appropriate levels in the population. However, there are substantial limitations in estimating national pain prevalence, let alone the prevalence of painful conditions that would be responsive to opioid therapy. Pain is by its very nature
subjective, and no biometric test can accurately predict the amount of pain an individual is in. Definitions of pain in the major federally sponsored self-report surveys (e.g., National Health and Nutrition Examination Survey [NHANES]) vary greatly, do not distinguish acute from chronic pain, do not attempt to link pain to specific medical conditions, and often exclude children and institutionalized populations.
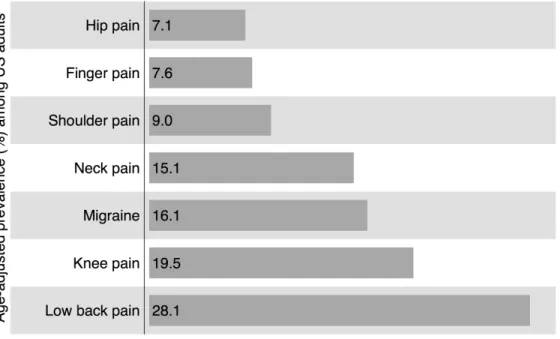
In one of the few population-based estimates of its kind, the CDC reports that 30% of Americans ages 45-64 reported problems with pain lasting more than 24 hours in the previous month [37]. It remains an open question how many of these individuals would benefit from opioid pharmacotherapy for chronic pain. Other CDC data suggest that the most common causes of pain in the last three months are musculoskeletal injuries, with lower back pain being the most common (Figure 2.3). There is relatively little debate on the appropriateness of using opioids in cancer pain, although what constitutes “cancer pain” can depend on the perception of the physician. However, despite the prevalence of musculoskeletal pain, and a plethora of clinical trials showing efficacy, the use of opioid analgesics in chronic non-cancer pain has recently been a highly contested area of clinical and policy debate focused on the Food and Drug Administration (FDA) [38,39].
In a recent report, Relieving Pain in America, the Institute of Medicine attributes the observed rise of the prevalence of chronic pain conditions to greater expectations for pain relief among patients, degenerative musculoskeletal disorders of an aging
to address pain needs [41,42,43]. Paradoxically, pain appears to be under-treated in the United States in some populations, and yet there is a belief that opioids are
overprescribed with resulting unacceptable levels of overdose. The continued outpatient use of opioid analgesics is contingent upon our ability to address the health and societal concerns associated with broader availability of these essential medicines.
Opioid Pharmacology and Pain Management
Clinical practice differentiates between three main types of pain frequency: acute, chronic and breakthrough [44]. Acute pain usually arises from minor physical injuries, limited surgical procedures, headaches, etc. The pain is intermittent and resolves in less than a month. Chronic pain (or “persistent pain”) can arise from more serious injuries and invasive surgical procedures, cancer, and degenerative nerve and musculoskeletal diseases (e.g., fibromyalgia, lupus, etc.), often with genetic underpinnings. The pain lasts more than a month. Breakthrough pain is a phenomenon that routinely occurs in patients whose pain is otherwise well-controlled (using opioid analgesics or other
pharmacotherapies). In these instances, a sharp and temporary pain may manifest itself and require additional pain medication.
Another dimension of pain is its intensity. Mild pain usually does not require opioid pharmacotherapy, and can be controlled with over-the-counter medications, non-opioid prescription drugs, and physical manipulation (e.g., massage), and often self-resolves without intervention. When pain results in interference with daily functioning and sleep, it is classified as moderate-to-severe, although in practice the differentiation between moderate and severe is often subjective.
and (2) those that have partial effect at the mu-opioid receptor and may also have action in other neurophysiolgical pathways that modulate the perception of pain (e.g.,
serotonin, γ-Aminobutyric acid [GABA], etc.). The latter have less risk for respiratory depression due to the lower levels of central nervous system depression (tramadol, propoxyphene, buprenorphine, with codeine and meperidine of intermediate risk). Other opioid formulations are used in modern medicine to suppress cough, usually found as syrups and primarily containing codeine (also hydrocodone), but are rarely implicated in overdose deaths. In addition to lower potency of the active ingredient, these liquid formulations contain excipients that make it difficult to consume large quantities, and are therefore placed in a lower controlled substance schedule. We do not include these in the definition of “opioid analgesics,” a distinction from many other studies. This
distinction becomes relevant when we analyze the association between opioid analgesics and overdose mortality in Aim 2.
In general, opioids increase activity at one or more G-protein–coupled
transmembrane molecules, known as the µ-, δ-, and κ-opioid receptors. These receptors are activated by both endogenous opioid peptides and pharmaceutical opioids.
Endogenous opioids (endorphins, enkephalins, dynorphins and endomorphins) function as hormones and neuroregulators in the limbic system and elsewhere, and are
responsible for feelings of well-being and analgesia. They also control respiration and many other roles that are not fully characterized. The receptors are widely distributed throughout the human body; those in the anterior and ventrolateral thalamus, the
manifestations of tolerance [45]. Unlike endogenous opioids that naturally cycle in concentration in the extracellular matrix, repeated dosing of pharmaceutical opioids or heroin leads to persistent binding and desensitization of these receptors leading to a state of tolerance whereby more of the opioid must be administered over time to achieve the same clinical effects. Thus, when exogenous opioids are abruptly discontinued, resensitization of these receptors leads to symptoms of opioid withdrawal (e.g., agitation, anxiety, diarrhea, muscle aches, insomnia, vomiting, etc.) [46].
There are more than a dozen alkaloids that naturally occur in the plant Papaver somniferum (somniferum means to cause sleep in Latin). Of these, morphine, codeine and thebaine are the most plentiful, and these molecules can be modified to produce drugs that have varying degrees of biological effects. Modifications of moieties give rise to differing side effect profiles (e.g., more potent opioids cause less constipation, oxymorphone is associated with less itching than codeine, etc.), while maintaining structural similarity. Because of the differences in potencies between opioids, clinicians refer to equianalgesic conversion tables when switching patients from one opioid to another during opioid rotation. Clinically, opioid rotation can assist in improving side effect profiles and reducing tolerance for patients maintained on chronic mono-opioid therapy. While these are rough guidelines for clinical conversion, the tables can be used in epidemiologic research to standardize by potency when analyzing utilization data. Morphine is the archetypical molecule and data are often presented in terms of “milligrams of morphine equivalents” (MME).
hydrocodone (Vicodin, Lortab, Lorcet, etc.), hydromorphone (Dilaudid), and
oxymorphone (Opana). ER formulations have labeled indications of moderate-to-severe pain where around-the-clock analgesia is required. These drugs are found as tablets or capsules with slow-release mechanisms and transdermal patches that regulate the elution of opioid over 12 or 24 hours. Some branded ER opioids are: fentanyl (Duragesic patch), hydromorphone (Exalgo), morphine (MS Contin, Kadian, Avinza, Embeda), oxycodone (OxyContin), oxymorphone (Opana ER), tramadol (Ultram ER). Methadone is also prescribed as a solid oral tablet for chronic pain management. Since the plasma half-life of methadone is sufficiently long enough to allow for chronic pain control with single doses (e.g., without a pharmaceutically engineered extended-release
mechanism), it is considered a “long-acting” (LA) opioid, but is often classified alongside ER opioids, as we have done in our research. The IR opioids have one recognized sub-category, called “ultra rapid release” that have fentanyl as an active ingredient. Fentanyl is a potent synthetic opioid that has quick onset, a short duration of action, and moderate affinity for the µ-opioid receptor. These products are used for sudden debilitating spikes in pain intensity lasting less than an hour, known as breakthrough pain (“flare ups”), for patients whose pain is being controlled with around-the-clock analgesic(s). These products come in different formulations: oral lozenge (Fentora), on a stick as “lollipops” (Actiq), nasal spray (Lazanda), buccal soluble film (Onsolis), and sublingual tablet (Abstral). These products have labeled indications only for cancer pain, but are widely used for non-cancer pain. In general, they are expensive products and used much less frequently than other IR opioids for breakthrough pain.
opioid during the transit of the tablet through the gut, and allowed for a single tablet to be taken every 12 hours. The other IR opioid formulations on the market at the time
required dosing every four to six hours. The ER formulation was lauded by pain patient advocates for allowing patients to receive adequate analgesia to sleep through the night or work through the day, without having interruptions for additional dosing. The
pharmacokinetic benefit is that the plasma concentration of the opioid remains at a steady state during the 12 or 24 hour dosing period; using the same amount of IR opioid would result in “peaks and valleys” in plasma concentration with corresponding
vacillations in pain relief. The justification for extended-release opioid preparations is that a steady, continuous release of the opioid over 12 or 24 hours would lead to better control of chronic pain because of a smaller mean difference in plasma concentration between Cmax and Cmin, while maintaining the same area under the curve (AUC).
In addition to steady state plasma concentration, the other oft-cited benefit of ER opioids is that they do not contain acetaminophen, ibuprofen or naproxen. Many immediate-release opioid pain relievers contain ibuprofen (200mg to 400mg) or acetaminophen (325mg to 750mg) in addition to codeine, hydrocodone, oxycodone, propoxyphene, or tramadol. Some brand names of combination products are Ultracet, Vicodin, Percocet, Tylox, and Lortab. However, long-term ingestion of ibuprofen and acetaminophen is associated with kidney failure and hepatic injury, respectively [47]. This is one of the justifications for using extended-release opioids for chronic pain since they do not contain either ibuprofen or acetaminophen [48,49]. FDA-approved labels for non-steroidal anti-inflammatory drugs (NSAIDs) and acetaminophen-containing
analgesics note that taking these for more than a couple of weeks can lead to liver, kidney and gastrointestinal tract damage. In addition to long-term risks with
injury, the FDA limited the amount of acetaminophen in opioid analgesic combination products to 325mg on January 13, 2011. The labeled upper limit of daily acetaminophen dosing is 4 grams when taken as an immediate-release combination opioid pain reliever. However, due to concerns about overdose risks with extended-release opioids, there is a belief in the pain management community that high doses of combination opioids are being unjustifiably prescribed to patients, partially out of fear of abuse and overdose associated with ER opioids. Therefore, we will examine high-dose and long-term IR opioid analgesic utilization in Aim 2.
While the clinical upside to ER opioids for chronic pain management has been important in hospice and palliative care, the amount of opioid in each ER tablet, capsule or patch is generally significantly more than in IR formulations. The ER formulations may be more attractive outside the medical realm to those seeking to obtain a larger bolus of opioid for their euphorogenic effect, i.e., to get high. The higher mass of opioid also may increase the overdose risk of ER medications over IR medications when taken other than as indicated, when taken without proper clinical monitoring, or when tampered with (e.g., crushed to snort or inject) to intentionally release all the active ingredient at once.
Clinical Practice of Pain Management
As increasing numbers of patients present with chronic pain complaints, it is unavoidable that some will have or have had substance abuse problems. For example, the 2010 federally sponsored “household” National Survey on Drug Use and Health (NSDUH) reported that 12.2% of males and 5.8% of females aged 18 years and older had diagnosable substance dependence or abuse in the past year [50]. While there are clinical tools to differentiate the “legitimate patient” from the “drug seeker,” these
those with substance abuse and dependence disorders frequently suffer from severe pain at higher rates than the general population, thus necessitating strategies for addressing both conditions simultaneously [51]. Effective strategies for treating patients with substance use disorders (including opioid therapy) have been articulated [52].
Primary care physicians prescribe more than 40% of the opioids in outpatient use in the United States [53]. ER opioids are prescribed more frequently by anesthesiologists and pain medicine and rehabilitation specialties than others. Prior to the early 1990s, primary care physicians prescribed a much smaller proportion of opioid analgesics, with specialty practices making up the bulk of opioid analgesic prescribing. While increased prescribing by primary care doctors has led to wider access to pain treatment, a general concern is that non-specialized doctors may not have been adequately trained to
prescribe these medications safely [53]. At the same time, there are theoretical concerns that physicians will stop prescribing opioid analgesics because of the fear of overdose, leading to decreased access to pain medication. Therefore, we utilized the number of clinicians prescribing opioid analgesics as an important variable in Aim 2.
Opioids are the mainstay for the management of moderate to severe chronic and acute pain the United States. Assessing the evidence for opioid analgesic effectiveness in cancer and non-cancer pain is beyond the scope of this dissertation. A recent review article by the American Society of Interventional Pain Physicians (ASIPP) assessed the evidence of published and unpublished clinical trials and epidemiologic reports about the effectiveness and adverse consequences of opioid therapy [53]. While we have
Etiology of Opioid Overdose
At an individual level, the risk factors for fatal accidental overdose among drug users and pain patients appear to be due to three major factors:
• Opioid exposure in individuals with no or inadequate opioid tolerance
Examples: new pain patients without a previous history of opioid therapy, infrequent drug users, unexpected fluctuations in purity of heroin
• Opioid exposure after disruption of physiological tolerance
Examples: resumption of previous dose of opioids after taper for surgery requiring anesthesia, resumption of previously normal dose after release from prison or abstinence-based drug treatment, failure to maintain level of tolerance due to the inability to procure opioids
• Multiple central nervous system depressants
Examples: combining prescribed opioids and benzodiazepines, drinking alcohol in combination with opioids
conflicts, and perceived ineffectiveness of the emergency response as deterrents to seeking medical help in an overdose situation [55,56,57]. Consideration of the risk environment includes the interplay of physical, genetic, behavioral, social, economic, and policy factors that influence opioid-related morbidity and mortality [58,59]. If prevention of opioid analgesic overdose deaths was as simple as reminding people to call 911 in an emergency or improving wording on a prescribed medication’s package insert, we would have observed a reversal in the mortality trends involving prescription opioids long ago. Rather, the rising death toll indicates society’s failure to recognize the complexity of prescription opioid abuse and the multiple societal and structural factors that contribute to the risk environment and ultimately to overdose mortality.
Beyond overdose mortality, there are social and structural determinants that influence who receives opioid analgesics in the United States. The relationship between poverty, pain and drug abuse is poorly understood. Substance abuse problems and poverty have long reinforced each other, at the extreme intertwined with major psychiatric disorders and homelessness. Employment opportunities in lower income communities are often limited to jobs with considerable physical stress or danger,
including military positions; the Institute of Medicine reports that a quarter of those below 100% of the federal poverty level suffer from pain on a regular basis [40]. When
Published studies on opioid analgesic dose and overdose death
At the societal level, many studies have suggested a co-linear ecologic
association between the total amount (by weight or number of prescriptions) of opioids dispensed and overdose morbidity and mortality over the last 15 years
[4,5,6,7,8,9,10,11,12]. Locations with the highest levels of opioid prescribing also have the highest rates of overdose deaths involving these substances. Simply summarized: the more that opioid analgesics are dispensed, the greater the overdose morbidity and mortality involving these substances are observed at the population level. These studies universally assume a linear relationship between prescribing and overdose, which may or may not be justified. Although there are caveats about inter-level (ecological) bias [60], there is a tendency in these papers to draw conclusions about individual-level risk of overdose based on opioid exposure.
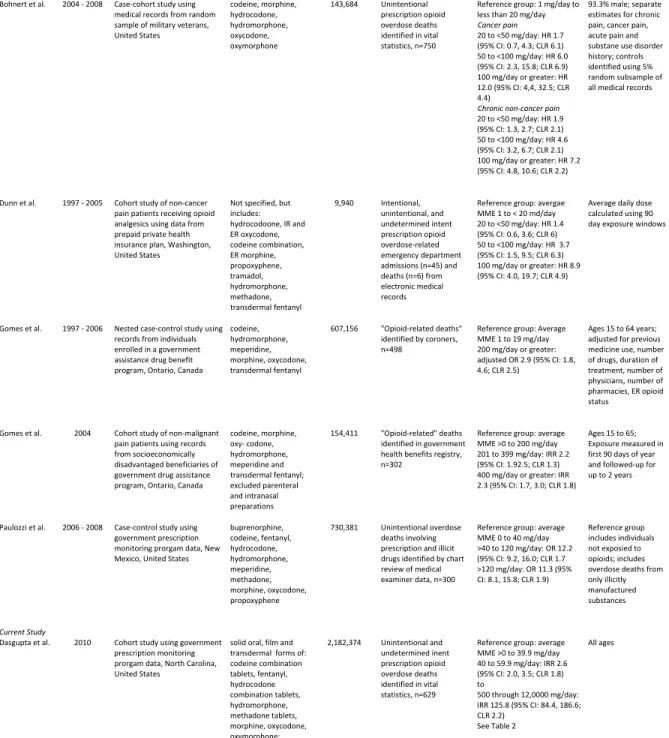
We identified five peer-reviewed published studies that have attempted to quantify the individual-level dose response between opioid analgesics and mortality. These five studies were identified by tracing references, searches of online databases (e.g., PubMed and Web of Science), but also from having followed the literature and public debate for the past ten years. We did not make an attempt to identify unpublished studies, or to conduct a systematic review or meta-analysis, because that was beyond the scope of this dissertation. However, these studies are widely considered to be the five most important and recent papers on the topic. The five studies are summarized in Table 5.1, and described below.
• Dunn, 2010: The earliest and smallest study of note [14] was a cohort study
4.0, 19.7; CLR 4.9) comparing those with at least 100 mg average daily MME to the lowest strata of 1 to less than 20 mg/day MME. This is the only one of the five that includes data on non-fatal overdoses.
• Bohnert, 2011: A case-cohort study looked at medical records from a random
sample of 154,684 nearly all-male military veterans in the United States during a four-year period ending in 2008, which reported 750 overdose deaths identified through vital statistics [13]. They compared the highest strata, using maximum daily dose, of at least 100 mg/day to a reference group of 1 mg/day to less than 20 mg/day. Their stratified results were HR=12.0 (95 percent CI: 4.4, 32.5; CLR 4.4) for cancer pain, and HR=7.2 (95 percent CI: 4.8, 10.6; CLR 2.2) for chronic non-cancer pain. They did not include transdermal fentanyl in their analysis.
• Gomes, 2011a: A nested case-control study [16] in Ontario, Canada included
607,156 non-malignant pain patients receiving opioid analgesics through a public assistance program during a ten-year period ending in 2006, and 498 overdose fatalities identified by coroners. They reported an adjusted odds ratio (OR) of 2.9 (95 percent CI: 1.8, 4.6; CLR 2.5) comparing 200 mg/day or greater to the reference dose of 1 to 19 mg/day. They did not include hydrocodone products.
• Gomes, 2011b: Another investigation conducted in Ontario [15] was a cohort
study of non-malignant pain patients using records from 154,411 “socioeconomically disadvantaged” beneficiaries of a government drug assistance program. They reported 302 overdose deaths during two years of follow-up ending in 2006. They reported an IRR of 2.2 (95% CI: 1.92.5; CLR 1.3) for 201 to 399 mg/day, with a reference group of average MME >0 to 20 mg/day. They also reported IRR 2.3 (95% CI: 1.7, 3.0; CLR 1.8) for 400 mg/day or
• Paulozzi, 2012: The study most similar to Aim 2 was conducted [17] as a
population-based case-control study of 730,381 patients, during an 18-month period ending in 2008, which included 300 overdose deaths among residents of New Mexico, United States. They reported an OR of 11.3 (95 percent CI: 8.1, 15.8; CLR 1.9) for those with greater than 120 mg/day average MME, however their control group included controls receiving less than 40 mg/day as well as controls who had not received any opioids. They included buprenorphine products in their exposure, even though these were primarily used for addiction treatment and not pain during the study period.
FIGURES
Figure 2.1. Annual age-adjusted mortality rates per 100,000 for selected diseases,
United States, 2009. There are more drug overdose deaths (pink) than motor vehicle
Figure 2.2. Rates of opioid analgesic overdose death, substance abuse treatment
admissions, and kilograms sold, United States, 1999 to 2010. There has been a
co-linear increase in the amount of opioid analgesics dispensed and unintended
Figure 2.3. Age-adjusted proportion of adults reporting pain in the last three
months, by site of pain, United States, 2009. The most common type of chronic pain
CHAPTER 3
RESEARCH DESIGN AND METHODS
Overview
There are two major types of data used in this analysis, mortality data and prescription utilization data. Aim 1 used only mortality data, while Aim 2 will used both mortality and prescription utilization data. The goal of Aim 1 was to describe in detail the nature of each of seven proposed definitions of overdose and yield a proposed definition for use in surveillance, and evaluate the impact of including substance use disorders and pharmaceutical adverse events codes in definitions of overdose. The goal of Aim 2 was to draw insight from regression models that estimate the association between opioid prescribing dose and overdose mortality risk at an individual level.
Deaths that may have been due to pharmaceutical adverse events and substance use disorders were identified, and we determined whether these were included in each definition. We compared demographic and co-morbidity information with known deaths from controlled-substance overdoses to judge whether the definitions would benefit from inclusion of these records. Based on these findings, we proposed an ICD-based definition of controlled substance overdose that could be used to potentially generate more accurate estimates of mortality.
An additional analysis, not included as part of the submitted peer-reviewed paper, dealt with “narcotic unspecified” deaths. Despite having markedly different mechanisms of toxicity, the historical artifact of classifying drugs derived from both the opium poppy (Papaver somniferum) and the coca leaf (Erythroxylum spp.) as “narcotics” results in a modern day methodological challenge of differentiating deaths involving derivatives of these plants, whether medicinal and illicitly manufactured [3,36]. The differences in the mechanisms of toxicity between opioids and cocaine, as well as separate clinical management, make it important to distinguish between the two in vital statistics data. Therefore, we also evaluated the impact of including “narcotic
We used data the same data from NC vital statistics and conducted a subset analysis of all deaths with a T40.5 code. We examined codes for contributing causes-of-death to see if we could identify whether the overdose was due to opioids or cocaine, or other discernible patterns. We supplemented our findings with a brief examination of the literal causes-of-death listed on death certificates as part of ongoing study by the NC Division of Public Health.
We also assessed whether seasonality was present in NC overdose mortality data, in order to determine if this concern would need to be accounted for in modeling when we were originally considering time series modeling. This analysis was not submitted as part of the peer-reviewed paper. We selected Definitions 1 and 4 to represent the broad and more general definitions. Gross time-vary trends were visually assessed with the aid of LOESS smoothing. The Walter and Elwood test for seasonality was applied [61], with and without adjustment for all other deaths among NC residents. This test takes advantage of the coincidence that there are 365 days in a year, and 360 degrees in a circle. Visually, by aggregating counts by day-of-the-year for multiple years, areas of uneven distribution along the perimeter of the circle suggest seasonal trends. Statistically, the amplitude of seasonal variation and the date on which the maximum occurs are modeled as a simple harmonic function, with a goodness-of-fit test based on the chi-squared distribution. Significance was assessed at p=0.10, because the test is low power to detect seasonality. We implemented the test using the SEAST module in STATA version 12 (College Station, Texas, United States) [62].
For Aim 2, we conducted a cohort study of all North Carolina residents
patients, with attention to opioid substance and formulation type. Then, we examined the relationship between high dose opioid analgesic prescribing and overdose mortality, and potentially confirm the findings of the most similar published study [17]. Finally, we evaluated possible differences between high doses of IR and ER opioid analgesics on overdose mortality.
Data Sources
Three data sources maintained by the North Carolina Division of Public Health provided drug-specific information for this study. Vital statistics were used to identify overdose decedents and describe demographic characteristics. Medical examiner post-mortem toxicology data were used to determine what substances were involved in the overdose death. Finally, data from the North Carolina Controlled Substances Reporting System (CSRS), the state’s prescription monitoring program, were used to gather prescription histories for each overdose decedent. These data were combined with CSRS data for all NC residents to create an individual-level analysis dataset. Incidence rate ratios were calculated using Poisson regression implemented with generalized estimating equations.
Mortality Data
Mortality data for 2008 through 2010 were obtained from the North Carolina Vital Statistics Dataverse at The Howard W. Odum Institute for Social Science of the
were obtained by DPH staff as part of an ongoing collaboration. Information from medical examiner files was extracted into a structured database, for the purpose of this research. Details on determination of death and data abstraction are presented in the methods section of the second paper.
Prescription Data
We used data from the state’s Controlled Substances Reporting System (CSRS) to construct exposure variables and quantify opioid analgesic dispensing in North Carolina. The CSRS is one of a set of clinician-oriented databases generally known as prescription monitoring programs (PMP). These state government-run programs are centered around electronic databases with the general goal of limiting overdose and illicit activities (e.g., diversion of medicines from “legitimate” channels) associated with
prescription controlled substances. PMPs are funded largely by federal grants through the Department of Justice, supplemented with funding from state governments.
data with permission from the Division of Public Health for all prescriptions dispensed from 2009 through 2011.
Converting prescription-level data to a person-level analysis dataset required extensive formatting. The starting dataset was 7.1 gigabytes in size, with 54,825,930 observations. Data cleaning steps are described below, and represented in Figure 3.1.
• 964,678 observations were deleted because county of residence was not a NC
county, resulting in 53,861,252.
• In order to eliminate non-controlled substances from the dataset, we decided to
manually classify the top 400 named drugs by the number of prescriptions by listing their active ingredient and therapeutic class. This represents 54,757,801 prescriptions from the original dataset, or 99.931% of all the prescriptions. The top 400 drugs in the CSRS dataset included all the major drugs of interest; the top 175 are used by state health department officials to roughly clean the data, however, we wanted greater confidence for individual-level modeling. We were able to include any dispensed controlled substance that had more than five prescriptions per month on average in the whole state. 62,975 observations were deleted because they were neither a controlled substance nor in the top 400, resulting in 53,731,213 observations.
• Days supply was missing or zero for 5,370,484 observations. We imputed the
days supply from the rest of the dataset using NDC number for all but 3,364 records, which were dropped. Singly imputed values were derived from non-missing records by NDC.
• In order to classify records by whether they were an ER versus IR opioid
in March 2013. The CDC file had classifications for each product by ER vs. IR, however there were observable mistakes. We therefore used Perl regular expressions to find discrepancies between the literal drug name and the CDC classification, with the literal name considered the higher authority. Search
strings included phrases such as “extended-release” and “controlled-release” and “CR”, as well as the known brand names of all market opioids. Further logic checks were implemented based on knowledge of the class of medicines, including ensuring no hydrocodone or oxycodone products were considered ER, all methadone was treated as ER, etc.
• Liquids were also identified using regular expressions (e.g., “liquid,” “tincture”,
“syrup,” etc.).
• After reconciliation of the classification, MME conversion factors were used as
suggested by CDC to convert each record MME by multiplying the quantity dispensed times the strength times the conversion factor.
• The resulting file had 53,712,910 records.
• Benzodiazepine, stimulant and sleep aid exposure was then determined for
2010.
• Prescriptions for liquids were dropped because it was not possible to determine
the units that quantity was measured in (milliliters, vials, ampoules, etc.), thereby making it impossible to calculate MME: 382,872 records.
• We analyzed data from 7,393,375 prescriptions for opioid analgesics dispensed
for use in 2010 (including those dispensed in 2009 with days supply that ran into 2010).
• Data for all prescriptions active for at least part of 2010 were identified. Any that
prescriptions, with person-days of supply and quantity split proportional to the number of days in each year. Only the active prescriptions in 2010 were retained.
• Then, each prescription active in 2010 was duplicated, one copy each
corresponding to the start and end date.
• A brace counting algorithm was implemented using this new date variable to
determine the number of days between consecutively alternating open and closed dates, accounting for the day of dispensing.
• The total number of days exposed in 2010 was summed for the exposure
person-days, and the balance from 365 was treated as unexposed, with
exposure time going into two possible observations per person. Throughout this process, county of residence, benzodiazepine exposure status and other explanatory variables were retained.
• Dummy records were then added to the dataset, corresponding to 365 days of
unexposed time for every NC resident who did not receive an opioid analgesic.
• The final analysis dataset had 9,560,234 unique identifiers, with 11,261,504
lines.
• Since CSRS records for decedents were collected by DPH using a separate
process, the variable formats did not allow us to positively identify the
corresponding prescription-level records in the total CSRS dataset. Therefore, we created a duplicate record for each decedent, and set it to the negative value of any exposed time, thereby mathematically eliminating their exposed person-time contribution when collapsed for Poisson regression.
Once the data were cleaned, many descriptive analyses of interest were
time series graphs to examine this. Of particular interest was proproxyphene utilization after it was withdrawn from the market in early 2011.
Time-at-risk Calculations and Determination of Dose “Cutpoints” for Aim 2
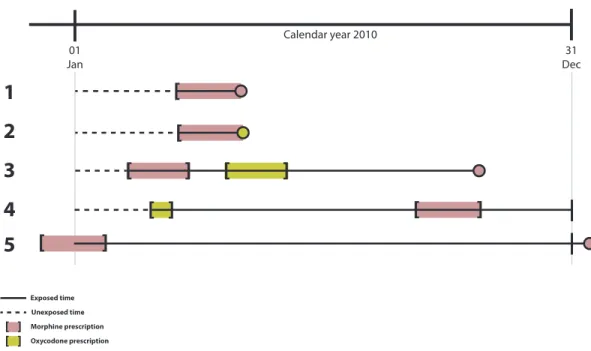
We explored the possibility of calculating person-time “as treated” or following “intent-to-treat” principles. Under the former, exposure time is only accrued during the time when the prescription is active. If an event occurs after the end of exposure, it would be classified as having occurred among the unexposed. In the intent-to-treat type (ITTT) method, person-time is accrued from the day the first prescription is received. As illustrated in Figure 3.2, there would be much less exposed time accrued (solid black lines) for the as-treated analysis. There would be fewer cases among the exposed (337 as-treated; 478 for intent-to-treat) among the 629 overdose deaths in Aim 2. We felt that the ITTT was a more appropriate choice for person-time accrual because
non-adherence to therapy is a serious concern with opioid analgesics, especially IR formulations prescribed pro re nata in the outpatient setting. Put another way, once patients receive opioid analgesics, there is a credible expectation that they may continue to have them around the house if they don’t use them all. The ITTT approach better reflects this scenario.
Mortality and Prescription Data Linkage
We used a deterministic one-to-one process to link the mortality and CSRS data. For each overdose decedent, we identified prescriptions in the CSRS that were
dispensed within 365 days of death using a two-step process. First, we queried each decedent using the web interface of the CSRS using the first five letters of their last name and their date of birth. Confirmatory matching was the second step, and involved matching the first name, last name and date of birth as recorded on the death certificate. Matching records were extracted electronically. The matching was conducted by staff of DPH and de-identified data were made available to us for analysis.
Statistical Approach for Aim 2
Since an individual could be represented twice in the dataset (exposed,
unexposed) we wanted to account violation of independence of observations assumed in regression models. Generalized estimating equations (GEE) offered a flexible and efficient solution that could be used in conjunction with Poisson regression to estimate rates. GEEs use the quasi-likelihood method to solve for parameters. GEE also have the benefit of allowing us to use robust variance estimators to generate standard errors. The choice of GEE also means that we cannot use the likelihood ratio test, or similar metrics, because the quasi-likelihood methods does not produce a numeric solution for log-likelihood. The general form of the Poisson equation is given below.
0 1 1X ... kXk
e
β
β
β
To generate state-level overdose rates for Aim 1 we used the following equation:
Ln(Rate) = ln(a/n) = β0 + β1X1 ð ln(a) = β0 + β1X1 + ln(n)
Where β1 represents the number of overdoses, and n is the population at risk, and β0 is
the intercept. For modeling in Aim 2, we used dichotomous indicators (1,0) for each level of the exposure variable (e.g., by MME quantile) to calculate strata-specific rates.
ln(a) = β0 + [β1X1 + … + βnXn]+ ln(n)
To calculate the incidence rate ratio, we divided the rate for the contrasting strata of interest by the rate for the reference group, equivalent to back-exponentiating the coefficient for the indicator variable of interest to arrive at the IRR. We multiplied the standard error of the coefficient by 1.96 to derive the 95 percent confidence intervals following standard large-sample assumptions of asymptomatic normality for the model’s beta coefficients.
Overdispersion in the Poisson models was assessed using the deviance divided by the degrees of freedom, with greater than 1.0 suggesting the need to consider other models. Overdispersion was not detected (e.g., dispersion of 1.0026757 was observed in the benzo exposed model). We also fit negative binomial models (NB2) for the sake of comparison, and these yielded nearly identical results to the Poisson models.
GEE with an independent structure as the final model in Aim 2, in large part because this model form imposed the fewest assumptions on the data.
Data transformations and statistical modeling were performed in Stata/MP 12.1 (College Station, Texas, USA), running on eight parallel core processors in a Linux-based computing system.
Human Subjects Protection
FIGURES
Figure 3.1. Data cleaning steps for prescription data. Flowchart of data
transformations and cleaning steps. Numbers represent the count of unique prescription records in the dataset.
All prescriptions dispensed 2009 to 2011 and recorded in North Carolina Controlled Substances Reporting System
(n=54,825,930)
Excluded (n=1,094,717)
Non-North Carolina county of residence (n=964,678) Unknown or missing drug information (n=67,064) Non-controlled substances (n=62,975)
Missing data assessment (n=53,731,213)
Imputed missing days supply (n=5,367,120)
Classification by active ingredient and formulation to identify solid oral and transdermal opioid analgesics
(n=53,712,910)
Classification by year dispensed
to identify prescriptions only intended for use in 2010 (n=21,448,986)
Opioid analgesic prescriptions intended for use in 2010
(n=7,393,375)
Excluded (n=18,303)
Missing days supply could not be imputed (n=3,364) Quantity dispensed could not be determined (n=14,939)
Excluded (n=32,263,924)
Not opioid analgesics (n=31,881,052) Liquids (n=382,872)
Excluded (n=14,055,611) Dispensed in 2011 (n=7,522,050)
Figure 3.2. Visual representation of person-time accounting. Person-days were calculated using intent-to-treat principles.
01
Jan Dec31
Calendar year 2010
Exposed time Unexposed time
3
2
4
1
5
Oxycodone overdose Morphine overdose
[ ] Oxycodone prescription Morphine prescription
[ ]
[ ]
[ ]
[
[
[ ]
[ ]
[ ]
Censored
|
|
CHAPTER 4
EXPLORATION OF DEFINITIONS OF OVERDOSE MORTALITY
Overview
The rate of mortality attributable to drug poisoning has risen consistently since the 1990s. State-based vital statistics registries estimate the incidence of drug overdose deaths using International Classification of Disease 10th revision (ICD-10) codes.
Composite ICD-10-based definitions of “overdose” may include deaths that do not involve controlled substances while missing deaths that do.
We evaluated the impact of including substance use disorders and
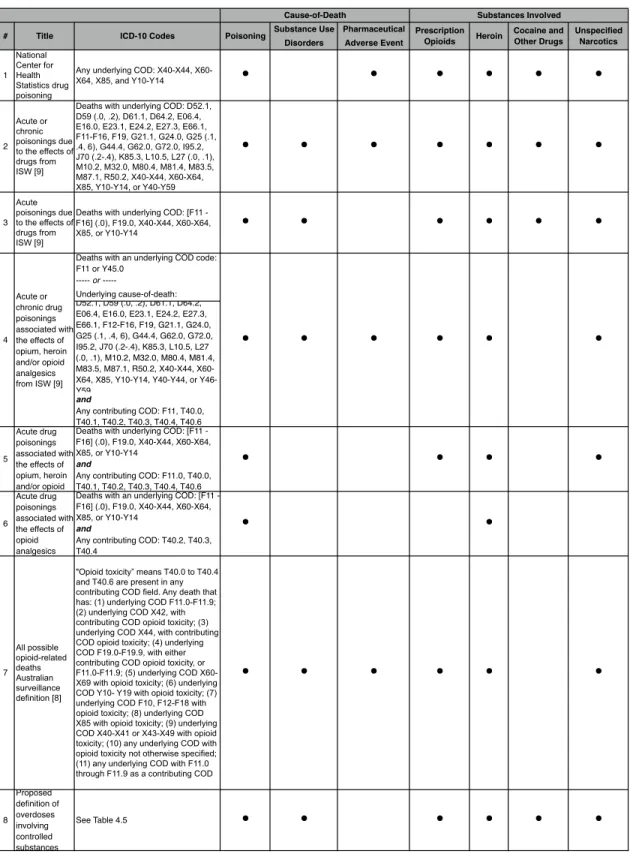
pharmaceutical adverse events codes in definitions of overdose. Seven proposed ICD-10-based definitions, including ones from the Injury Surveillance Workgroup (ISW) and the Centers for Disease Control and Prevention (CDC), were applied to North Carolina mortality data from 2008 through 2011. We examined whether overdose deaths varied among definitions and made a proposal for a definition to be used in future research.
Introduction
from drug poisonings was 11.9 per 100,000, making it the leading cause of injury death, surpassing motor vehicle-related fatalities [66]. Drug poisoning mortality outpaces injection-borne infectious diseases, including HIV and viral hepatitis, as the leading cause of death among young injection drug users in the United States [67].
Since 1999, national mortality data have been coded using the International Classification of Disease 10th Revision (ICD-10) maintained by the World Health
Organization. Using ICD-10, each death is assigned a single underlying cause and up to 20 contributing causes. To compute incidence estimates for poisonings, death certificate data and medical examiner case records are tabulated in state and territorial vital
statistics systems, and reported nationally through the National Vital Statistics System of the National Center for Health Statistics (NCHS) for the Centers for Disease Control and Prevention (CDC).
There is considerable interest in the timely and accurate identification of deaths from ingesting psychotropic (controlled) substances in amounts that directly cause or contribute to a fatality (consistent with the US Food and Drug Administration (FDA) definition of a serious adverse event; 21 CFR § 314.80). For controlled substances the most relevant ICD-10 codes are: poisoning by narcotics and hallucinogens (X42, X60 and Y12; unintentional, intentional and undetermined intent, respectively); and three codes (X41, X61, Y11) that include other controlled substances, such as sedatives and other psychotropic drugs, as well as less frequently prescribed non-controlled medicines for epilepsy and Parkinson’s disease that are dopaminergic precursors or otherwise increase dopamine activity. We collectively refer to these codes (X42, X60, Y12, X41, X61, Y11) as “poisonings from controlled substances.”
deaths in surveillance data [69,70]. The multi-disciplinary Injury Surveillance Workgroup (ISW) of the Safe States Alliance recently suggested five possible consensus-based recommendations of ICD codes to be used for identifying overdose events, based on more expansive definitions that include substance use disorder and a wide list of pharmaceutical adverse event codes [3,71]. However the inclusion of non-controlled medicines in the definition may overestimate overdose events.
We evaluated definitional issues of using ICD-10 codes for drug overdose death surveillance in a two-step process. First, we assessed the effect of including substance use disorder codes with the goal of implementing a more inclusive (“broad”) definition of drug overdose involving controlled substances. Second, we evaluated the effect of excluding deaths due to pharmaceutical adverse events in “broad” surveillance definitions for drug overdose involving controlled substances.
All of the NCHS and ISW definitions (Table 4.1) include deaths from
pharmaceutical adverse events, even if the medicines involved were not controlled substances [3,28,72]. We could not find a clear justification for this. The FDA has used some of these exact codes to identify adverse event deaths unrelated to controlled substances, for example when reviewing the risk of infection associated with
corticosteroid treatment [73,74]. Discrepancies such as these between federal health agencies necessitate a closer look at the definitions of overdose. This study explored which pharmaceutical adverse event deaths should be included in definitions of
overdose mortality for controlled substances. This topic is of significance worldwide, for surveillance and incidence estimates and for researchers seeking to evaluate
interventions to prevent overdoses from controlled substances.
collected in a statewide electronic medical examiner records system overseen by the North Carolina Office of the Chief Medical Examiner [70].
Methods
The study population was any NC resident whose death was recorded in NC vital statistics as having occurred from January 1, 2008 through December 31, 2011.
Mortality Data Source
Each death triggers a registration of the death with a local or municipal health authority, a mandated administrative task. The cause-of-death is determined by local health directors, attending physicians, or medical examiners based on autopsies or other investigations. Once the cause(s) of death are determined, the death record is
appended, i.e., with the literal words used to describe the cause of death, which may occur months after the issuance of the original certification of death. The death records are converted by individual nosologists or computer software to alphanumeric ICD-10 codes. Mortality data for 2008 through 2010 were obtained from the North Carolina Vital Statistics Dataverse at The Howard W. Odum Institute for Social Science of the
University of North Carolina at Chapel Hill [63]. Vital statistics mortality data for 2011 were obtained from the Injury and Violence Prevention Branch, North Carolina Division of Public Health, Department of Health and Human Services, as were death certificate data listing the literal text of the cause-of-death fields for 2010 and 2011.
Definitions
public health authorities in Australia [71] (Table 4.1). Definitions 1, 2, and 3 are intended to broadly identify all overdoses due to “drugs” and controlled substances. Definitions 4, 5, and 7 are intended to specifically identify opioid overdoses, whereas Definition 6 only identifies prescription opioid overdoses. All seven definitions include the aforementioned six codes for poisonings from controlled substances. All definitions include homicidal poisoning using drugs or biological substances (X85). The definitions can also include deaths due to substance use disorders (Definitions 2, 3, 4, 7), pharmaceutical adverse events (all), the involvement of heroin (all except Definition 6), cocaine and other drugs (Definitions 1, 2, 3), or unspecified narcotics (all except Definition 6).
Substance use disorder codes are found in chapter F of ICD-10, with the following two-digit number indicating the substance, e.g., opioids are F11. A fourth digit suffix indicates the chronicity of substance use that led to the death. The codes of
greatest relevance for mortality are: acute intoxication (.0), harmful use (.1), dependence syndrome (.2), withdrawal (.3), and unspecified chronicity (.9). The presence of an acute intoxication code (e.g., F11.0 for opioids) is in conflict with unintentional poisoning code (e.g., X42 for opioids). Accordingly, in 2007 NCHS discontinued the use of acute intoxication F codes for underlying cause-of-death in favor of X- and Y- chapter poisoning codes [3] (this convention may have continued at the state level beyond 2007). However, substance use disorder codes of other chronicity (e.g., not .1) continued to be used.
and unspecified drugs that act on the autonomic nervous system or elsewhere.” We collectively refer to these as “poisonings from other and unknown substances.”
In the second approach, Definitions 2 and 4 also include deaths with an
underlying cause in the range of Y40 through Y59, which are poisonings resulting from medicines causing adverse events during therapeutic use, i.e., iatrogenic exposures. Medicines could include: anti-coagulants, antibiotics, bacterial vaccines,
immunosuppressive agents, angiotensin-converting-enzyme (ACE) inhibitors, and others. Of particular interest is Y45.0 which designates deaths due to the use of opioids and related analgesics during therapeutic use. The third way to identify adverse events is by using outcomes codes that suggest physiologic harm. ISW constructed Definitions 2 and 4 to include 34 specific drug-induced underlying causes including medicine-induced versions of conditions such as aplastic anemia, pancreatitis, gout, obesity, osteoporosis, and lupus erythematous, traditionally used for pharmaceutical adverse event reporting. We collectively refer to these as “adverse events during therapeutic use.”
The Australian surveillance definition (Definition 7) uses a different approach to specifically identify opioid overdose deaths (Table 4.1). It includes deaths due to any underlying cause that is opioid related, defined as the presence of any of the following in contributing cause-of-death fields: T40.0, T40.1, T40.2, T40.3, T40.4, T40.6, or F11 [71]. For example, Definition 7 includes deaths with underlying causes for asthma or chronic obstructive pulmonary disease (COPD) that also have contributing causes that show opioid toxicity. None of the other definitions include these cases but they are likely cases of interest to us.
unspecified (T40.6), benzodiazepines (T42.4), amphetamine-type stimulants (T43.6), ketamine (T41.2), cannabis (T40.7), hallucinogens (T40.8, T40.9), barbiturates (T42.3) and gamma hydroxybutyrate (T52.8). Ethanol toxicity (T51.0) was considered
separately. The intent of the ICD-10 schema is that these codes are not intended to represent the mere presence of the substance in post-mortem toxicology findings or circumstantial evidence, but rather indicate their causal involvement in the fatality.
Statistical Analysis
We compared seven definitions to each other using bivariate and descriptive statistics, with particular attention to Definition 1 because it is used by NCHS. Variables of interest included: sex, race and ethnicity, age, marital status, whether an autopsy was conducted, and place of death. Sex differences were examined because differences in opioid effects have been documented in clinical trials [75,76]. Age and racial differences have been observed in opioid metabolism [77,78] and dependence [79]. We also
compared definitions on whether the death was intentional, unintentional or of
undetermined intent. Previous analyses have noted empirical interstate variation in the classification of intent of overdose deaths [36] and we explored whether variations within a state could also be ascertained. All data analysis was conducted in STATA 12
(College Station, Texas). Population rates were calculated using Poisson regression with population denominators from NCHS bridged population estimates.
Results
Describing Drug Overdose Deaths