INSTRUMENTATION APPROACHES TO BIOLOGICAL SYSTEM ASSESSMENT, GUIDED MSC DIFFERENTIATION, AND FUNCTIONAL TISSUE ENGINEERING
Avery Ted Cashion IV
A dissertation submitted to the faculty of the University of North Carolina at Chapel Hill in partial fulfillment of the requirements for the degree of Doctor of Philosophy in the Department of Biomedical Engineering.
Chapel Hill 2013
©2013
ABSTRACT
Avery Ted Cashion IV: Instrumentation Approaches to Biological System Assessment, Guided MSC Differentiation, and Functional Tissue Engineering
(Under the direction of Robert Dennis)
Instrumentation methods and tools are developed for electrical and mechanical stimulus/assessment of biological systems. In Chapter 1, a distributed control data acquisition system (DAQ) was developed and demonstrated in the application of measurement and analysis of dielectric relaxation sensing of bio-cultures. As a
demonstrative example, a simple probe was constructed and used to measure absorption behavior of varying volumes of soybean oil. Extracted features of this calibration dataset were used to train a support vector machine (SVM). The SVM was then able to predict the known volumes of a separate specimen with approximately 98% accuracy. In
Chapter 2, enabling bioreactor technologies were developed for the investigation of the effects of periodic strain on patches of self-organized rat myocardial tissue in-vitro using a novel voice coil actuator (VCA) system. The DAQ was purposed as a control board for the VCA mechanobioreactor network. The researcher can program strain protocols for individual bioreactors using a single user interface on a computer. Possible
implementations of the described system include micro-newton twitch force measurement capability as well as the ability to generate stress-strain curves of
engineered tissues. To examine the compatibility of the bioreactor with engineered tissue samples, a uniaxial 1Hz cyclic 10% tensile strain was applied to 2cm square tissue
strain period. In Chapter 3, the VCA system was modified to enable research on the effects of periodic vibratory stimulus on human and porcine mesenchymal stem cells (MSCs). Multiple bioreactors within the incubator can be independently addressed. Once programmed, the embedded microprocessor and sensor system on each bioreactor
TABLE OF CONTENTS
List of Figures………...………..…….…. vii
Introduction……….……….1
Chapter 1 Introduction………...………...……….………..6
1.2 Materials and Methods………...…..…….………..…….11
1.3 Results………..……..……….……….21
1.4 Discussion………..………….….…………....24
1.5 Conclusions……….…...………..…25
Chapter 2 Introduction...………...……….………..…..26
2.2 Materials and Methods…………..………...……….…………..….28
2.3 Results…………..………..………..………..….…….37
2.4 Discussion………..………..………….………...……39
2.5 Conclusions………...………...………40
Chapter 3 Introduction………...………...……….…….41
3.2 Materials and Methods………..………..……….………43
3.3 Results………..………..……….…….53
3.4 Discussion………..……….……….………55
3.5 Conclusions………...………...………56
Appendix 1.………...……….………57
Appendix 2.………...……….………62
Appendix 3.………...…….………89
LIST OF FIGURES
Figure
1.1. Representation of a single data collection cycle….………...…11
1.2. Circuit schematic and image of the system hardware..……….…..14
1.3. Program flow diagram for the USB intermediary chip (PICI)……….….15
1.4. Program flow diagram for PICII, the microcontroller that directly controls data collection parameters ……….15
1.5. Dielectric Relaxation Probe……….………….…….16
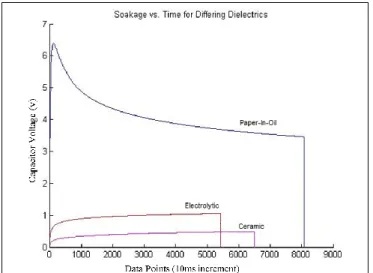
1.6. Example data from commercial capacitors with differing dielectric materials..…...21
1.7. Matlab Analysis of Dielectric Absorption Volume Discrimination…..……....……22
2.1. Conceptual VCA Drawing…...………..29
2.2. Bioreactor Overview………..31
2.3. Electronics Design……….………33
2.4. VCA System Calibrations………….………..……….……..34
2.5. Cardiac Patch Attachment………..….………...37
2.6. Twitch Force Assessment……….……….38
3.1. Vibration Bioreactor Design……….………..….………..43
3.2. Magnetic Braking Damping Mechanism……..………...………..47
3.3. MSC Characterization………50
3.4. hMSC stain results………...………..52
3.5. pMSC stain results………...………..53
Introduction
Following the initial expansion phase of the zygote into the blastocyst, gastrulation organizes the embryonic stem cells into three layers labeled ectoderm, mesoderm and endoderm. Masses of ESCs from each of these germ layers are formed into tissues and organs by intricate activations and repressions of specific genes. The ectoderm forms most of the central and peripheral nervous system as well as hair, nails and tooth enamel. From the mesoderm layer comes the majority of the musculoskeletal, cardiovascular and lymphatic systems as well as gonads and connective tissues. Finally, the endoderm produces most of the organs in the gastrointestinal tract as well as liver, pancreas and lungs. The human body continues to repair and replace damaged tissue throughout life based on the blueprint laid out during embryogenesis but is never again capable of regenerating fully functional organs from scratch.
When tissue damage is beyond repair by natural healing processes, replacement interventions often become necessary. Depending on the specific condition and on the organ or tissue type, successful treatments can be achieved by autograft, xenographt, or allograft of whole or parts of organs and tissues. The holy grail in tissue engineering is to create fully functional replacement parts for the human body from a person’s own cells in order to eliminate recipient rejection issues. The research path to achieve this goal requires diverse approaches, skillsets, and tools as well as management of ethical and sociopolitical
A recent query of 24 leaders in the field of tissue engineering was conducted on the topic of achieving large scale clinical significance by the year 2021.1 The study is largely subjective but provides an interesting amalgamated expert perspective. Briefly, each person was asked to generate a list of the 10 most important concepts that will lead to the stated goal. Dominance of each listed research concept over the others was quantified by analysis of the interdependence of all of the provided concepts. Progress in each research direction was estimated by literature review. The authors of the study normalized the dominance scores by the progress scores to yield a sorted list of the most strategic research directions for tissue engineering to achieve large scale clinical significance. Topping the list of the most strategic research directions were angiogenesis research and stem cell science. These topics are central to the majority of the work presented in this dissertation.
Instrumentation
At the core of all reliable scientific observation and experimentation are the principles of measurement and instrumentation. The development of universal standards has made possible the successful cataloging of verifiable scientific data from research spanning over many centuries. Over the years, the development of science has demanded several increases in the precision of known standards. At the time of this writing, the International System of Units defines a second as the amount of time taken by 9192631770 oscillations of light emitted by a cesium-133 atom, a meter as the distance light travels in 1/299792458 seconds, and 1kg as the mass of a 3.9cm x 3.9cm platinum-iridium cylinder. Interrelationships
context, instrumentation is the art of meeting the complex demands of a given experiment in order to generate data within the framework of existing standards. Basic physical concepts can be logically interconnected and compounded into precise, functional systems in much the same way fine music can be composed using a finite number of piano keys.
Biology and regenerative medicine is a broad field of research that creates an enormous need for sensor systems and bioreactor engineering. Highly specialized skillsets are in many cases making interdisciplinary collaboration a necessity for scientific
advancement. Each part of the work presented here is a product of a diverse group of intelligent individuals noncompetitively working toward a common goal. Electrical and mechanical engineering principles are applied to biological research problems to create engineering solutions that provide enabling technologies to important areas of biological research.
Outline of Work
chapters lies in the versatile data acquisition system that was developed and further employed in Chapters 2 and 3, as well as the nondestructive assessment of a biological system.
Chapter 2 details the development of instrumentation controlled by the Chapter 1 DAQ to explore the effects of cyclic mechanical strain on patches of self-organized
myocardial tissue. Engineered cardiac patches may have great potential for the treatment of damaged or scarred heart tissue in myocardial infarction patients. In order to achieve
clinically relevant adult phenotype patches, a great deal of basic research into the factors that govern heart tissue organization and extracellular matrix production is necessary. In order to study pure myocardial tissue, cardiac patches were cultured from primary rat heart cells using a digestible “scaffold”. The resultant patches are held together by cell-cell and cell-matrix interactions. To simulate the physically dynamic environment of the beating heart, a programmable voice coil actuator was developed and attached to the cardiac constructs. Viability of the instrumentation was examined by the application of a 1Hz cyclic 10% strain. While still an order of magnitude lower than adult phenotype tissue, patch twitch force showed a marked increase following the applied stimulus. This result would suggest that physical manipulations of cardiac patches may play a critical role in the development of clinically relevant heart tissues.
was modified and applied to the mechanical stimulation of MSC cultures in Chapter 3. The results from this experiment agree with the suggestion from the literature that in the absence of other stimuli, the gene expression regulators that are sensitive to mechanical stimulus will only trigger osteogenic or chondrogenic MSC lineages. However, it may be possible that other cell signaling pathways will increase the sensitivity to vibration of other gene expressions. For example, co-culture of MSCs with self-organized cardiac patches and applied cyclic strain to the knowledge of the author has not been explored. An initial study is detailed in Chapter 3, wherein the efficacy of the instrumentation was evaluated and shown to elicit a chondrogenic lineage at 1Hz stimulus and osteogenic at 100Hz.
Recently in the field of cardiac tissue engineering, decellularized rat heart has been demonstrated to be an extremely effective biomatrix for the production of functional myocardial tissue.4 Perfusion decellularization methods remove the cellular and genetic material and leave behind the (mostly collagen) extracellular matrix. Along with preserved organ geometry and matrix molecules, the resultant constructs retain an intact vasculature that can be used for both nutrient delivery and recellularization. From these constructs, bioartificial hearts have been developed by recellularization with cardiac cells.4 With electrical stimulation, the engineered hearts performed at about 2% adult rat heart pump function.
CHAPTER 1: INSTRUMENTATION AND ANALYSIS FOR SENSOR APPLICATIONS OF LOW FREQUENCY DIELECTRIC ABSORPTION1
1.1 Introduction
Dielectric Absorption
Dielectric absorption describes an intrinsic property of dielectric materials employed within electrical capacitors wherein the charge on a capacitor returns to a certain degree after briefly shorting the terminals. Dielectric theory suggests that dielectric absorption arises from a gradual polarization of the molecules of the dielectric material and/or orientation of
existing dipoles within the material in the presence of an electric field.7–10 Because all dielectric materials are by definition electrical insulators, charge redistribution within dielectric materials is much slower than in electrical conductors which results in a slower change in the resulting electric field condition10–12. Thus, for a capacitor to be completely discharged, the short circuit condition must remain for a length of time sufficient to allow the dielectric polarization to relax, permitting this form of stored energy within the dielectric to be fully equilibrated.
Dielectric absorption is significant in modern-day capacitors, leading to important non-linear behavior often referred to in electronics literature as “soakage.” This non-linear effect on capacitance has been a thorn in the side of circuit designers since the invention of
_____________________________________
1This chapter was submitted to IEEE Transactions on Instrumentation and Measurement. The
citation is as follows:
capacitors over 100 years ago.7,8,13 Soakage must be considered and to the extent possible eliminated when working with systems that rely heavily on precision analog signals that are stored as a voltage in a capacitor because errors are often introduced over time as energy “soaks” into and is released from the dielectric material.9,13,14 Such behavior can cause very large errors in many common analog signal conditioning and filtering circuits, including but not limited to the ubiquitous sample-and-hold components found in virtually all analog-to-digital conversion circuits. In addition to measurement accuracy and precision, safety is another major concern related to charge soakage in capacitors. In the case of high
voltage/high power systems, capacitors must often be discharged for long periods of time before they can be safely handled. Therefore, minimization of this effect is an important criterion in the selection of dielectric materials by capacitor manufacturers. Some common modern dielectrics include mylar, silver mica, and ceramic but for better absorption
performance higher-cost dielectric materials such as polypropylene or PTFE (Teflon) can be used.8,14
An absorption-compensating mathematical model of a capacitor has been described using a succession of RC circuits connected in parallel with the original capacitor.15 The RC circuits, referred to as “compartments,” mimic dielectric absorption behavior by representing delayed release energy storage elements. This compartmental model describes the total current i(t) involved in recharging a capacitor due to dielectric absorption as an infinite sum of decaying exponential currents according to:
( ) ∑ [ ]
Where the resulting voltage on the capacitor is described by:
( ) | |∑ [ ]
( [ ]) (2)
In these equations, and are the charge voltage and short voltage respectively. Short
voltage is the voltage to which the capacitor has been clamped for discharging. represents the overall capacitance, is the number of parallel RC compartments, is the decay rate of each compartment, is the resistance in each compartment, is the capacitor short
duration, and is the time elapsed since the short condition was removed. It should be noted that values specific to each compartment, namely Rj and τj are not, and cannot be explicitly
measured—they are simply useful as a model for conceptualization.
Dielectric Sensors
Sensor applications based on other dielectric behaviors have been applied
added to the container. The resulting change in capacitance is easily measured, and by this means a liquid-level sensor with no moving mechanical components can be realized. Differential capacitance probes have also shown promise in application to determining relative compositions of liquids.16
Another sensor implementation is dielectric spectroscopy, which generally refers to the observation of dielectric behavior as a function of applied frequency. One use of dielectric spectroscopy relevant to biological systems is a method of determining biomass concentration in suspended cultures of microorganisms using a capacitive probe.17,18. The
process works by selecting a capacitor charge frequency based on the dielectric dispersion principles of biological cells.17–20 Conductivity and permittivity data, obtained by monitoring conductance of the sample and capacitance of the probe, can be used with a series of
equations17 to determine the volume fraction of the sample that is inhabited by cells. While applications of dielectric-based capacitive sensors are widely varied, sensors based on direct current (DC) dielectric absorption characteristics, to the knowledge of the authors, have not been explored. The DC measurement of characteristic dielectric absorption behavior of materials has certain advantages, including the fact that the phenomenon can be observed and measured without the need for careful selection of capacitor charging
possible application of this method in the rapid assessment of oil content in a capacitive probe.
Algae derived biofuels
The potential contribution of algal oil to future economic growth goes well beyond its value as a replacement for current petrochemical liquid fuels. To fully replace petro-oil (a finite and non-renewable resource) in the global economy with any renewable resource, consideration must also be given to the production of chemical substrates into the global material commodities stream. The current petrochemical industry provides massive amounts of material that is employed in all industries, especially plastics and agricultural (fertilizer), and energy alternatives such as wind and solar simply do not produce concurrent streams of useful materials, thus they can never fully replace petrochemical resources. Algal oil, on the other hand, can be modified to replace most, perhaps all petrochemical-derived material substrates. For this to become a practical reality, it will be necessary to monitor and control not only the total mass of algal oil being produced in large algal fields, but also to monitor and control the quality and types of oil being produced. The richness of data obtainable from dielectric absorption may allow the necessary information to be gathered rapidly from
industrial-scale algal oil producing installations.
measurement are mainly limited to theoretical yield calculations based on multiple efficiency assumptions23 and experimentally determined weight percentage of algal lipids versus dried biomass. Though theoretical approaches provide a valuable means for estimation of algal oil yield possibilities, actual oil productivity measurements must be collected to facilitate the necessary incremental research in this field, and to allow large-scale industrial plants to accurately monitor and control the process of generating oil from large algae fields.
Determining percent lipids by weight measurements are currently time and energy intensive and require relatively large samples of algae. A capacitive probe based on dielectric
absorption may help fill this technological void in bio-fuels research.
1.2 Methods
System Overview
To enable low frequency and DC dielectric absorption measurements, we have
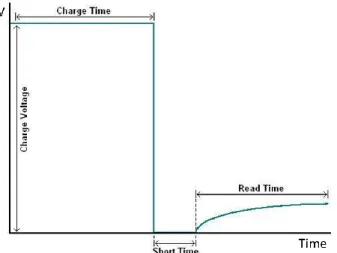
selected five user defined parameters for data collection settings in this system: charge voltage, short time, collection time and number of data collection cycles (Fig. 1). One data collection cycle includes three modes of data collection. When the system is in charging mode, the positive terminal of the probe or subject capacitor is
connected to the charge voltage. The charge voltage is disconnected and the Fig. 1. Representation of a single data collection cycle and
capacitor is shorted during shorting mode. Finally, the system transitions into collection mode where the capacitor charge is building and is connected exclusively to the data digitization circuitry.
The data collection settings are specified in the system software where they are automatically logged at the top of the data file and sent to the system hardware (Fig. 2) for execution. A green LED on the circuit indicates that the system is ready to start a new dataset.
Electronic Data Collection System
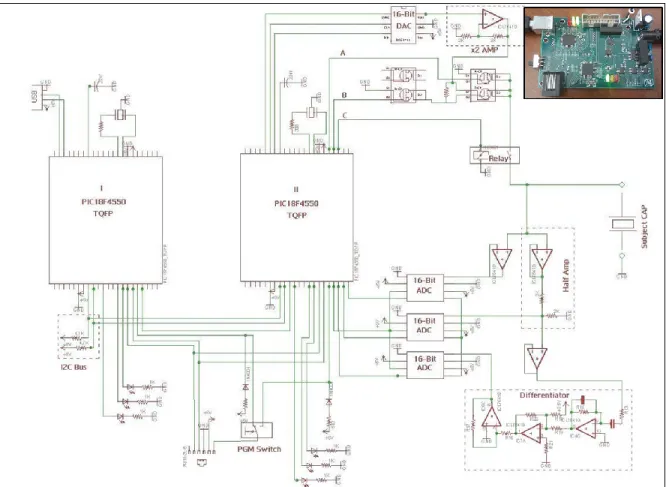
The system described here employs a method for measurement of this property adapted from a design by Robert Pease wherein analog switches and a strip chart recorder were used to characterize some absorption behaviors of different dielectrics in commercial capacitors.8 The present system acquires absorption signals using solid state electronics and digital methods (Figure 2).
This system is capable of generating DC dielectric soaking signals ranging from zero to ten volts. A 16-bit digital-to-analog converter (DAC8411) is set using SPI communication from a PIC18F4550 microcontroller. The output of the DAC is then doubled using a non-inverting amplifier operational amplifier circuit (LF444CM) to increase the voltage range and the available current of the charging signal.
or more, the P-Ch cannot be controlled by a microcontroller digital I/O pin directly. In light of this constraint, a N-Ch MOSFET serves as an open-collector interface between the microcontroller and the gate of the P-Ch. Thus, activation of the N-Ch grounds the gate of the P-Ch which connects the charge signal to the relay. To short the capacitor, the open-collector N-Ch is deactivated and a separate N-Ch is activated which grounds the relay. The relay is in place to allow for complete disconnection of the capacitor from the
charging/shorting circuitry during collection mode to eliminate data aberrations from transistor switching noise. Data is digitized and collected during all modes of operation.
Following the momentary short of the capacitor terminals, the system is transitioned into collection mode. The signal is buffered with a voltage follower op-amp circuit to isolate the collection circuitry from the signal with a high input impedance to minimize distortions.
Three 16-bit ADCs (TLC4545) allow for three parallel options for signal
conditioning. All signal conditioning circuits are electrically isolated from one another using voltage followers. These ADCs work on the range from zero to five volts which allows the first ADC to collect voltages five volts or lower over the full 16-bit resolution of the ADC. The second ADC has a one half voltage divider following the buffer for digitizing voltages up to ten volts. The third acquisition option is an analog differentiated signal. This is in place to offer a measurement of the signal current (first derivative of the voltage). In order to make the differentiated signal comply with the input range of the ADC, a combination of a
sampling of all three data collection options. Only the 10V collection method was used in data presented here.
Two PIC18F4550 microcontrollers, labeled I and II in the (Figure 2) schematic, were used in the hardware design of this system; referred to as PICI and PICII henceforth. All microcontroller code was written using the PICC compiler by Custom Computer Services (CCS). PICI acts as a USB intermediary between PICII and the graphical user interface (GUI) generated in VisualBasic 2010 (Figure 2). USB communication on these PICs is
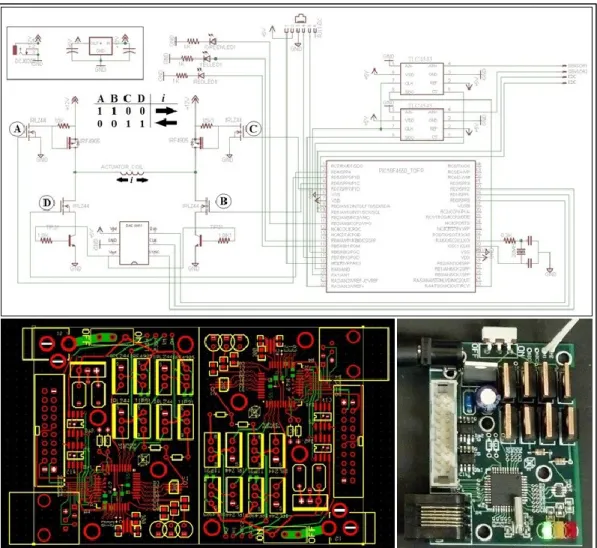
Fig. 2. Circuit schematic for generation of charge signals and acquisition of data. Created using EAGLE Layout Editor CAD software. Experimental parameters set in software control the behavior of the circuit. Three 16-bit ADCs are used to provide options of reading the raw signal, the signal halved (for values in excess of 5V), and/or a differentiated signal. (Inlay) System hardware. The printed circuit board (PCB) was created using ExpressPCB development software.
relatively demanding of microcontroller resources, resulting in undesirable design constraints when attempting to implement all the necessary system firmware on a single chip.
Inter-Integrated Circuit (I2C) was selected as the communication protocol between the PICs for its speed, reliability, and modularity in adding multiple slave devices to the same clock and data lines. Generally, in I2C communication the master device (PICII) interrupts the slave device (PICI) whenever it has data to send. For data transfers in the opposite
direction however, the master device has to request the data from the slave and generate clock cycles to receive it. In order to achieve seamless bidirectional data flow in this system, an additional digital connection line was added between the PICs wherein the slave can trigger an external interrupt on the master device to notify it of newly
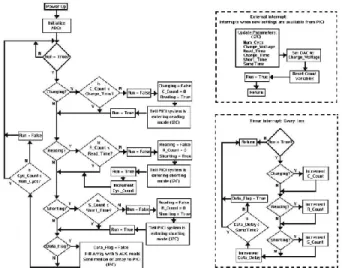
Fig. 3. Program flow diagram for the USB intermediary chip (PICI). PICI acts as the I2C slave. The SSP interrupt triggers when the master is sending data to the slave or requesting data from it. When data is received from the master device, it is sent to the computer through USB under the Human Interface Device (HID) protocol. Conversely, when USB data is received from the computer PICI triggers an external interrupt on the I2C master device (PICII) to tell it to read the new settings.
available settings from the GUI. PICI and PICII program flow diagrams can be seen in (Figure 3) and (Figure 4) respectively.
The design specifications require communication of 16-bit collected data and settings. One consideration of many data transfer protocols, including I2C, is an 8-bit packet size per transfer. Well established methods using binary rotations and firmware implementations of logic gates accomplish the splitting and reassembling of the 16-bit integers on each
microcontroller.
Signal noise was significantly reduced with the introduction of a preconditioning median filter on PICII. Five rapid reads of the ADC into a data array comprises one data point to be collected. The value recorded is the middle element of the bubble-sorted array (median).
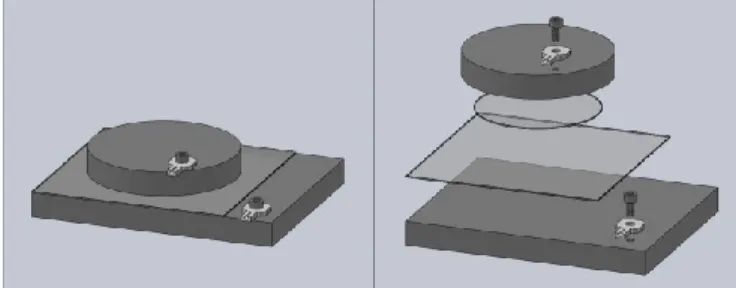
Probe Design
A simple parallel plate capacitive probe was designed and constructed for collecting data from varying volumes of soybean oil (Figure 5). The base plate is a 10.16 x 12.7 x 1.27cm (4 x 5 x 0.5in) block of aluminum and the top plate is a 7.62 cm (3in) diameter by 1.27cm (0.5in) thick cylinder. The circular plate shape was selected to even out edge effects
due to electric field concentrations. The plate surfaces facing one another were machined flat using a 1.27cm (0.5 in) flat end mill. The sample was placed between two sheets of Teflon FEP, each 0.127mm thick (McMaster-Carr:
85905K66). The bottom sheet is a 10.16 cm (4-in) square and the top sheet is a 6.35cm (2.5-in) diameter circle. The PTFE circle is smaller than the top plate so that surface tension can keep the liquid sample from leaking out of the probe. The plates were electrically coupled to the circuitry using #6 socket screws. The probe was housed in a grounded faraday cage during all data collection.
Signal Feature Selection for Sensor
In order to compare absorption responses in differing dielectric samples, specific features of the signal must be selected. Ideally for creating sensors based on this
phenomenon, the selected features will contain the maximum amount of absorption information specific to the sample.
We have selected two features of the dielectric dipole relaxation response for comparison between samples: maximum recharge voltage Vmax, and the length of time it
takes to reach 63% of the maximum voltage. When discussing capacitors, the time constant of a capacitor can be represented as RC, a value whose product represents a time. A useful method for measuring the time constant of a capacitor can be produced by observing that at time t = RC, the voltage (VRC) on a charging capacitor is:
( ) (3)
Where Vmax represents the driving voltage on the capacitor. Thus, by knowing the length of
time required to reach 0.63*Vmax, one can infer the value of RC. As the Iorga model15 is
the material properties of a dielectric would be the value of a “bulk time constant.” In our case, we have named this bulk time constant t63% and it is derived as follows:
An explicit equation for dielectric absorption Vmax can be found by taking the limit of
equation 2 as time goes to infinity.
( ) | |∑ [ ]
( [ ]) (4)
Which for shorting voltage, :
| |∑ [ ]
(5) The 63% point of the response curve can be defined as the time where:
( ) (6)
Substituting equation 5 into equation 2 and simplifying gives:
∑
[ ]( [ ])
∑
[ ]
(7)
Thus, Vmax can be expressed as a function of the initial charge voltage and the overall
capacitance of the probe. T63% on the other hand, can be expressed independently of charge
the capacitive plates, the distance between them, and the dielectric constant of the material. These observations supported the decision to use these two features for the sensor.
Data Description and Analysis
Software developed in Matlab(Mathworks, Inc: Natick, MA) first breaks down the dielectric relaxation signals received as a tab delimited file from the acquisition system. The software implements a rank 3 median filter to the raw voltage signal and extracts the selected features (T63% and Vmax) for analysis.
To demonstrate an application of dielectric absorption to sensor technologies, data was collected on precise volumes of soybean oil (Fischer Science: 8001-22-7) in order to generate an SVM calibration file. The 10.16 cm square PTFE sheet was placed on the base capacitive plate. Samples of soybean oil were pipetted onto the center of the sheet using an Eppendorf micropipette. The circular PTFE sheet was placed over the oil droplet and the oil was allowed to spread between the sheets. The cylindrical plate was placed concentrically over the circular sheet and the faraday cage was assembled around the probe. Data collection parameters were set in the GUI as follows: charge voltage (10v), charge time (65sec), short time (10ms), collection time (65sec). All data presented in this paper used the same
parameter settings. The PTFE sheets were cleaned with soap and water and dabbed dry with a kim-wipe between samples.
collection procedure was repeated twice more; once for SVM parameter optimization and once for the SVM test.
Support Vector Machine
A support vector machine is a very powerful tool for pattern recognition and data classification in computers.24,25 SVMs were selected for data analysis because they can learn relationships very quickly and accurately from few samples and because they have few parameters to optimize. In this study, the SVMlight implementation26,27 of Vapnick’s SVM28 was employed using Matlab. This package allows the user to train an SVM and to test it using features from data it has not been trained on. The radial basis function kernel was employed in regression mode for this experiment with an empirically optimized hyperplane complexity parameter of 4.2.
The application of an SVM to this experiment involved regression of volumes of soybean oil based upon their respective T63% and Vmax values. After the SVM was trained on
1.3 Results
The processor of the PIC18F4550 provides high-speed transfer rates and mathematical functions in working with 16-bit data. Each microcontroller is operating at 24.00 MHz in this system. At this clock speed, the system hardware is capable of sampling at a rate of
approximately 2.2 KHz. Each
successive sample includes reading the ADC five times and loading it into an array, sending the median of the array via I2C, and sending that value to the computer via USB. The hardware sample rate can be increased to 11 KHz if the median filter is removed but the sample rate limitation in this system is not the hardware, but the USB data receiving software.
Based upon experimental testing, the Human Interface Device USB template used in development of the GUI can only receive values from a peripheral device at a maximum rate of 125 Hz (Fig. 6). This limitation introduces some ambiguity in the time scale of the data
and accurate for analysis methods to work properly. In order to ensure operation in the range of reliability, values are sent to the computer at a rate of once every 10 ms (100 Hz) which provides manageable data file sizes and is still an order of magnitude greater than Nyquist rate for the signal being sampled.
The data collection system was tested successfully on a variety of commercial capacitors with differing dielectric materials. The absorption response of a ceramic,
electrolytic and a paper-in-oil capacitor is depicted in (Fig. 6). The difference in responses of these capacitors can be observed without difficulty. The decaying voltage on the paper-in-oil
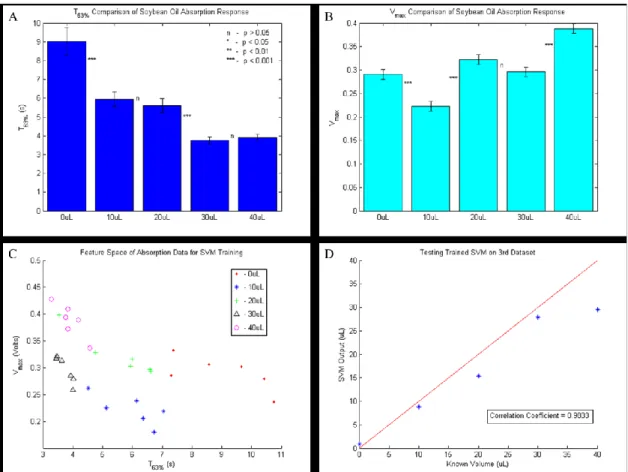
Fig. 7. (A&B)Summary of means of (A) T63% and (B) Vmax sample data collected for training the
support vector machine. The error bars represent standard error. Results of two-tail t-tests are displayed for comparison of nearest volumes. (C) SVM training data presented in feature space (D) Results from testing the trained SVM using inputs: T63% and Vmax features from a new dataset. Each input feature was
capacitor is attributed to a less than ideal series resistance or “leakage” of the dielectric material.
The dielectric absorption data collected for training the SVM was separated into T63%
and Vmax features. A summary of the means of the features at each volume in a sample
dataset can be seen in (Fig. 7 A&B). The results of two-tail t-tests performed between neighboring volumes are also displayed. In this dataset, the null hypothesis was rejected for most neighboring volume feature means but could not be rejected for three of them. For example, according to the t-test between the T63% values of the 10μL and 20μL samples the
difference between the mean T63% values is not statistically significant. However, it should
be noted that the result of the t-test between the Vmax values of the 10μL and 20μL samples
yields a p-value less than 0.001. Thus, in this dataset, where one feature fails to reliably discriminate between samples, the other can accomplish the task easily.
The SVM training dataset is represented in feature space in (Fig. 7C). Each point represents an average of 10 individual data collection cycles. The data is observed to generally cluster by volume with some cross-over between clusters. A support vector machine is ideally suited for separating the clusters for classification by features.
After training, the SVM was tested using features from a separate dataset. The results of this test can be seen in (Fig. 7D). The correlation coefficient between the SVM output vector of estimatedvolumes and the known volumes of the test data was calculated to be 0.9833. This means that the SVM was able to successfully classify volumes of soybean oil based on their T63% and Vmax input features even at low sample sizes (<50μL). This SVM was
1.4 Discussion
Through the use of a SVM, a soybean oil volume sensor was successfully demonstrated based on the concepts of dielectric absorption and relaxation. This result suggests that DC dielectric absorption signals provide enough information about bulk material characteristics to classify samples in sensor applications. One particular advantage that this DC dielectric relaxation response sensor has over sinusoidal systems is overall simplicity of signal acquisition and analysis.
By generating a SVM training dataset using samples of algae and their respective lipid contents, the system described in this manuscript could be purposed as a device for rapid field sample measurements of lipid concentration in algae farms. Algal oil content could also be cost-effectively tracked daily for selecting the maximal yield harvest time. The device could be calibrated to specific sample populations of algae to maximize accuracy.
A similar process can be implemented in the creation of sensors for many applications. Possibilities may include a tool for improvement and testing of industrial capacitors, detection of concealed materials within objects, or even a food diagnostic tool for relative determinations of fat content.
The I2C network on the system hardware allows for individual microcontrollers to operate in parallel which is an important feature at this stage for future design
place of SVMs is another area for future research including but not limited to artificial neural networks (ANNs).
1.5 Conclusion
This paper describes hardware and software methods for measuring low frequency dielectric absorption properties of materials. A parallel plate probe design is detailed and demonstrated in the application of collecting data from varying small sample volumes of soybean oil. The Vmax and T63% features of the relaxation signal were shown to contain
CHAPTER 2: A CYCLIC STRAIN BIOREACTOR FOR MECHANICAL ENHANCEMENT AND ASSESSMENT OF SELF-ORGANIZED MYOCARDIAL
PATCHES2
2.1 Introduction
In 2008, approximately 1 out of 6 deaths in the United States was caused by coronary heart disease.29 The human heart is a complex organ that requires near perfect timing and operation of many intricate parts in order to function properly. The myocardium consists of three major types of cardiac muscle fibers: atrial muscle, ventricular muscle, and excitatory and conductive muscle. The fibers are arranged in two distinct latticeworks generally referred to in the literature as the atrial and ventricular syncytia.30 Under normal conditions, the excitatory heart contraction signal is generated at the sinoatrial (SA) node and spreads diffusely through the atrial syncytium causing atrial contraction. The excitatory signal reconvenes at the atrioventricular (AV) node from which it spreads throughout the
ventricular syncytium and causes the systolic stroke of the heart pump. Fibrillations in this stepwise rhythm are commonly caused by ischemic conditions of sections of the syncytia where coronary arteries are narrowed or blocked.
While heart has been shown to contain populations of stem cells31–35, the average rate
_____________________________________
2This chapter was recently submitted to IEEE Transactions on Biomedical Circuits and
Systems. The citation is as follows:
of regeneration is estimated to be less than 1% turnover annually36. This inadequate regeneration means that the key to the most effective treatment of myocardial infarction remains in limiting tissue damage by minimizing the time of the arterial clog.
Thrombolytics, blood thinners, vascular stents and bypass surgery are all effective treatments of the clogged arteries but the necrotic myocardial tissue is most often permanently damaged. Ventricular assist devices can be used to aid the heart pump but the gradual build-up of non-contractile scar tissue will eventually lead to heart failure.37 Currently, heart transplantation is the only standard clinical practice in place to treat infarcted tissue.32 Stem cell transplantation is a logical research endeavor32 but clinical trials of non-scaffold cell injection have not yet led to significant recovery of cardiac function.37 Other experimental approaches include heart geometry modifications with biomaterial restraints38–42, in-situ injectable scaffolds with cardiac cells43–47, and cardiac muscle patches cultured in-vitro and implanted on the epicardial surface of the heart48–53.54
The gold standard in myocardial tissue engineering is to create clinically relevant autologous grafts for damaged tissue replacement.37,55,56 In order for an engineered patch to successfully replace a section of the myocardium, it must be approximately 1cm thick, conduct electrical signals, and produce contractive forces similar to adult phenotype
tissue.37,57 Vascularization is necessary when developing tissues thicker than ~200μm;58 so in
Mechanical stimulus has been shown to enhance the function of myocardial patches63–67 but has not been exhaustively explored. A review of the literature has led the authors to determine that the field has matured to a point where it would benefit from the development of more capable instrumentation.68 The work presented here centers on the effects of cyclic mechanical strain on self-assembled patches of cardiac tissue developed in-vitro without the use of a scaffold.
2.2 Methods
Theory of Bioreactor Operation
Strain is applied to the cardiac muscle constructs using a very low friction and low hysteresis linear voice coil actuator (VCA) apparatus similar to one described elsewhere.69 The principle of our VCA system is depicted in figure 1A. Lorentz forces are generated orthogonal to the direction of the static magnetic field and to the direction of charge flow through a suspended wire.70 The force magnitude is proportional to the total length of wire (l), the magnetic field strength (B), and the electrical current (i) as is represented by the following cross product:
Coiling the wire increases the total length within the magnetic field. The two sides of the coil are suspended in opposite static magnetic field directions to accomplish a unilateral net force direction. Thus, the magnetic field strength and the length of wire are set initially and maintained constant which makes current the only variable governing the Lorentz force magnitude and direction.
Lorentz force which allows for precise linear control of the coil position by modulating electrical current.
Figure 1B shows a SolidWorks representation of a frictionless sensor we modified from a previous design71 to monitor position in this system. Two infrared light sources are directed at two detectors of the relevant wavelength. An interrupter attached to the VCA armature moves within the sensor space proportionally to the movement of the end effector. Position is accurately tracked by observing the differential activations of the two detectors.
Bioreactor Mechanical Development
The SolidWorks design and assembly as well as an image of the VCA bioreactor are presented in figure 2. The mechanical design was originally developed in SolidWorks in order to preserve time and materials by most effectively eliminating clearance errors prior to construction. After the software design phase, rapid manufacturing techniques were
employed to generate the physical bioreactor.
The baseplate was laser cut from a 0.75cm thick piece of stock acrylic. During laser cut manufacturing, holes were placed in appropriate locations for mounting the electronics, the VCA armature, and the magnet housing. Additionally, a circle was cut near the end effector for snug placement of a standard 35mm culture plate.
The VCA armature was designed to elastically deform in such a way that allows very near uniaxial movement at the end effector. The action of the resulting mechanism is similar to a spring loaded four-bar linkage. The armature design includes an appropriately sized slot for the coil bobbin to snap in place. A SW displacement study was executed to test
clearances and to set the proportional movement of the beam interrupter to the end effector (figure 2A). The bobbin and the armature were 3D printed out of ABS plastic and mounted to the acrylic baseplate. A 150 turn coil of 36-AWG wire was wound around the bobbin and then snapped into the armature slot.
Figure 2. (A) SolidWorks motion study for the design of the flexible frame (B) Assembly of the VCA mechanical design (C) Image of complete bioreactor hardware (D) Inverted view of SolidWorks Assembly
Electronics
The schematic, printed circuit board design, and final image of the electronics developed for this system are shown in figure 3. The circuit is part of an inter-integrated circuit (I2C) digital network where it can be connected to other bioreactors, sensors, and a previously described custom data acquisition (DAQ) module.72 The DAQ bidirectionally communicates via USB with a computer running a program written in VisualBasic 2010 for setting stimulation parameters. The DAQ acts as the I2C master device and can
PIC18F4550 microcontroller is used for digital communication, armature position monitoring, and stimulus generation.
The VCA is driven using a digital H-Bridge circuit composed of N-Ch (Digikey: IRLZ44) and P-Ch (IRF4905) MOSFETS. The microcontroller setting of the pins labeled A, B, C, and D in the figure 3 schematic controls the direction of current through the coil and therefore direction of armature movement. The magnitude of the coil current is controlled by a 16-bit digital to analog converter (Digikey: DAC8411) attached to the base pin of a NPN power transistor (Digikey: TIP3055).
Figure 3. (Top) Circuit schematic of the VCA system (Bottom Left) PCB designed using ExpressPCB freeware (Bottom Right) Populated PCB
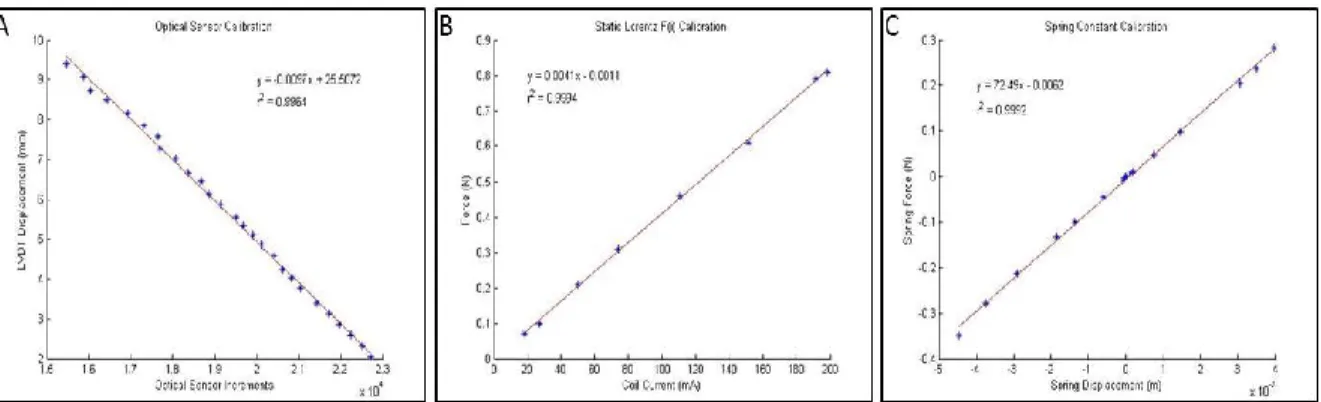
Calibrations
In order to relate the positional sensor signal with physical length, sensor increments were correlated with the displacements of a linearly variable differential transformer
(Schaevitz Sensors: DC-SE1000). The resultant linear relationship from this calibration dataset yielded an R2 value of 0.996 and a slope magnitude of 0.0097 which gives a sensor resolution of just under 1μm (figure 4A).
r2 value was 0.9994 and the slope was .0041 yielding a relationship of approximately 4mN
per mA.
In each static condition, the spring force exactly balances the Lorentz force which means that information from the first two calibrations can be used to calculate the spring constant of the VCA armature (figure 4C). The VCA was allowed to move freely and the position sensor was monitored as coil current was gradually increased. The spring force to spring displacement relationship has an r2 value of 0.9992 and slope of 72.49 which by Hooke’s law is also the spring constant. Knowledge of the spring constant will be necessary when the system is used to measure cardiac patch twitch forces. Multiplying the spring constant by the positional sensor precision yields a force resolution in this system of
approximately 70μN. This resolution could be optimized by minimizing the spring constant and also by increasing the proportional movement of the beam interrupter to the end effector.
Figure 4. (A) Calibration of the position sensor against the linearly variable differential transformer (LVDT) (B) Calibration of the Lorentz force generated as coil current is varied.
(C) Armature spring constant calculation using the calibrations of A and B.
Isolation of neonatal cardiac myocytes
transferred to a secondary phosphate buffer solution for additional mincing. Tissues were minced into 1 mm2 fragments and transferred to a dissociation solution (DS) consisting of 0.32 mg/mL collagenase type 2-filtered (Worthington Biochemical Corporation, Lakewood, NJ) and 0.6 mg/mL pancreatin in phosphate buffer. The minced tissues and 15mL of DS were placed in an orbital shaker for 30 minutes at 37°C and 60 rpm to initiate serial digestion. Once the 1st digestion was completed, the supernatant was collected in 3mL of horse serum in order to neutralize the enzyme and placed in a centrifuge at 1000rpm for 5 minutes at 4°C.
The cell pellet was re-suspended in 5mL of horse serum and kept in an incubator at 37°C
supplied with 5% CO2. Fresh DS was added to the partially digested tissue and the procedure
for the digestion was repeated 2 to 3 times. The cells acquired during the serial digestion were pooled, centrifuged and suspended in culture medium (CM). Cell viability was determined by Trypan blue (4%) staining according to the manufacturer’s protocol.
Preparation of the plates
35mm tissue culture plates were coated with 2mL of SYLGARD (PDMS, type 184 silicone elastomer) (Dow Chemical Corporation, Midland, MI). The plates were air dried for 2 weeks to allow the silicone coating to form properly and sterilized with 80% ethanol before use. 4 minutien pins (Fine Science Tools, Foster City, CA) 0.1mm in diameter, were placed in the culture plate to form a 20mm X 20mm square.
Formation of the fibrin gel and cell plating
Fibrin gel was formed by adding 1mL of CM containing 10U/mL thrombin to the coated surface of each culture plate. Afterwards, 500μL of saline containing 20mg/mL
to promote the formation of the gel within 45 minutes. Primary cardiac cells were diluted in CM at 2 million cells/mL and plated in 2mL of CM for each plate after the gel was fully formed.
The cells were cultured in an incubator at 37°C supplied with 5% CO2 and underwent
media changes every other day. The cardiac tissues were maintained for 7 to 10 days then loaded into the bioreactor for mechanical stimulation.
Attachment of cardiac tissue onto bioreactor
The fibrin gel tissue constructs were cultured in individual 35mm culture plates until the self-organization process was concluded. After the tissues constructs were fully formed, each specimen was loaded onto the bioreactor individually (figure 5B). First, the 35mm plate was placed into the bioreactor well. Second, two adjacent minutien pins were removed to allow stretching of the tissue construct. Third, the hooks attached to the bioreactor are placed into the tissue construct on the side where the pins were removed.
The hooks are composed of 20 gauge braided copper wire, soldered to 26 gauge enamel covered solid copper wire, which came into direct contact with the tissue at three equidistant locations. The attachment hooks were sterilized with 80% ethanol before and after use.
Mechanical stimulation protocol
Figure 5. Patch formation process and setup of the bioreactor for the engineered tissues. (A) Schematic showing the overview of the method used to construct the cardiac tissues. PP: plate preparation, PF: patch formation, BA: bioreactor attachment to tissue construct. (B) Setup of the culture plate in the bioreactor and close picture showing the attachment between the device and the tissue construct. CL: coil leads, PM: permanent magnet, AS: armature sensor, P: power LED, F: forward movement LED, R: reverse movement LED, CP: culture plate, AH: attachment Hooks, TC: tissue construct, MP: minutien pins.
2.3 Results
Because all of the data in this paper were collected using a single bioreactor, the culture time among the tissues varied between 2 to 3 days. In order to ensure that the tissue constructs suffered little to no damage, slight modifications had to be made to the attachment hooks. Initially, the hooks were made with 22 gauge solid tin wire; however, this resulted in tearing of the tissues. Once compatibility of the bioreactor with the tissue constructs was confirmed documentable results were obtained.
2.4 Discussion
The experiments described in this manuscript were devised to evaluate the compatibility of the bioreactors with our engineered cardiac patch constructs. During the initial testing phase we focused on fabricating practical attachments to affix to the bioreactor and connect to the tissues. The main challenge we encountered was the loading and
unloading of the tissues onto the bioreactor without incurring physical damage to the tissues. Once a functional attachment method was formulated, we focused on obtaining data that showed the effect of short term stretching on the cardiac constructs. In the future it may be pertinent to develop a more durable and serviceable attachment as well as develop a bioreactor into which multiple specimens can be loaded.
In addition to applying strain protocols, the elements in place in this bioreactor system are theoretically capable of mechanical assessment of engineered tissue samples. The ability to directly measure twitch force and tensile strength, as well as to generate stress-strain curves could make this device extremely versatile. As engineered tissues on this scale are extremely delicate, minimal sample manipulation and reattachments of instrumentation are desirable.
2.5 Conclusion
CHAPTER 3: PROGRAMMABLE MECHANOBIOREACTOR FOR EXPLORATION OF THE EFFECTS OF PERIODIC STIMULUS ON MSC
DIFFERENTIATION3
3.1 Introduction/Background
Bone and cartilage defects, either individually or in combination, result from a wide variety of congenital anomalies, traumatic injury, and cancer extirpation. These defects are generally treated with autologous grafts that require a secondary surgical site, and can be associated with significant donor-site morbidity. The capacity of tissue engineering to provide solutions to these challenges is significant. The availability and versatility of
mammalian MSCs for potential applications in tissue engineering and regenerative medicine has immense potential.73–75
The factors regulating cell fate of MSCs are widely varied and are not yet fully characterized or understood. Mature human cells generally produce a maximum of ~30% of the proteins the genome is capable of.30 Cell differentiation is therefore commonly accepted in the literature as the selective repression of specific groups of genes, regardless of the mechanism of influence. Research suggests that active mechanical stimulation will play an important role in the differentiation and organization of MSCs into mature, functional tissues.76–82 For example, tensile strain of substrates seeded with MSCs has been shown to
_____________________________________
3This chapter was submitted to Tissue Engineering. The citation is as follows:
induce an osteogenic lineage as indicated by significant increases of BMP2 levels.78 Comparatively, cyclic compressive strain has been associated with increased TGF-β1 synthesis in a study of rabbit MSCs which indicates chondrogenesis.83
Mechanotransduction of biological cells is a complex integration of signals including integrin binding, signaling molecules, stretch sensitive ion channels, and cytoskeletal
deformation.84 Choreographing specific mechanical influences to selectively guide cell fate will thus necessarily include a large amount of research into scaffold design, ECM
composition, and active mechanical stimulus. The state of research into the mechanobiological influence on MSC fate has been recently reviewed in detail.80 Pulsed ultrasound has been shown to promote healing of skeletal injuries possibly due to effects on cellular proliferation and differentiation.85–92 Other mechanical stimuli such as forces from accelerations and vibrations have been shown to elicit effects on osteogenesis93–
99 and angiogenesis100 in tissues, as well as changes in cellular metabolism101 and ECM
composition.102–104 Mechanical strain protocols have been applied to 2D cell cultures primarily by stretching, compressing, or bending biocompatible elastic substrates.105–109 Other methods have included hydrostatic or direct contact pressure and fluid shear.108
A review of the literature yields independent studies where specific MSC fates were achieved with cyclic mechanical stimulus. Hydrostatic pressure applied as a 1Hz sinusoid to hMSC cultures has been demonstrated to enhance chondrogenesis.83,110,111 Other studies have shown that higher stimulation frequencies of MSCs have yielded osteogenesis.98,112 To the knowledge of the authors, the MSC differentiation response from vibrational frequency and waveform power spectrum has been scarcely explored beyond individually focused
benefit greatly from a series of controlled experiments into the vibrational frequency dependence of MSC differentiation in both in-vitro and in-situ cultures. Based on these findings in the literature, we have hypothesized that the combination of compressive, tensile and shear forces from an applied vibratory stimulus will generate bone formation at higher frequencies and a cartilage phenotype at lower frequencies.
3.2 Methods
Bioreactor Frame Construction
A mechanical drawing of the bioreactor system and a picture of it in use are shown in Figure 1. The frame was constructed primarily of laser cut 0.635cm black acrylic and was solvent welded using dichloromethane. The assembly consists of a stationary stage and a translatable stage spaced 2.5cm apart and mounted to a baseplate (33.0cm x 7.6cm).
The reciprocating stage of the mechanobioreactor consists of an acrylic platform (7.6cm x 12.7cm) suspended by four lengths of alloy 402 stainless steel wire (7.6cm long x .051cm diam). Linear translation is achieved similarly to a dual four bar linkage driven by an electromechanical voice coil actuator (VCA). The movable stage can be translated
nylon thumbscrews. A thin strip of acrylic (not shown in figure) is used to attach the VCA to the movable stage to serve as a flexible drive linkage.
The horizontal motion of the culture plate driven by the VCA causes fluid motion back and forth across the cells in culture at the bottom of each well. In this configuration it is the fluid motion that transduces mechanical shear forces to the cells in culture. In other
configurations113 the VCA can directly apply mechanical strain to engineered tissues, or to the substrate material upon which the tissues are cultured. The degree of flexibility in how this device may be configured and attached to culture vessels, synthetic substrates, or directly to tissues themselves allows it to be employed more widely in tissue engineering research than mechanisms that are specifically designed to drive only fluid flow or mechanical strain of uniform substrate materials.
Electronics and Voice Coil Actuator
The instrumentation of the voice coil linear actuator, the embedded electronics113 and the computer intermediary board72 are described elsewhere. Briefly, the researcher selects stimulation protocol parameters on a computer user interface written for this purpose in Visual Basic 2010. The parameters are sent via USB to an intermediary control board where they are distributed to the appropriate bioreactor within the incubator via I2C digital
communication.
The voice coil actuator operates by Lorentz forces generated within an electric coil in a direction orthogonal to a static magnetic field.70 The coil is mounted within a compliant mechanism spring with very low hysteresis and low spring constant such that by varying the direction and magnitude of the current in the coil, the linear position can be controlled over a displacement of ~ +/- 2 mm from the neutral position. The VCA position is tracked with sub-micron precision using an optoelectronic differential displacement sensor fitted with an optical beam interrupter.71 The embedded microcontroller monitors the position of the actuator and controls the current through the coil in accordance with the programmed stimulus protocol.
Oscillatory Behavior
The dynamic mechanical behavior of this system can be modeled using the equations of motion describing an ordinary harmonic oscillator:
relationships that allow it to be expressed in terms of the natural frequency, and the damping ratio, :
√
√
which can be expressed as:
As depicted in the above equations, the natural resonance of the system is a function of both the oscillating mass and the spring constant. The range of under-damped natural resonance frequencies in the experiments presented here was measured with the optical displacement sensor and an oscilloscope to be between 5 and 7 Hz.
Adjustable Damping Mechanism
therefore the translation stage. The opposing magnetic field is proportional to the velocity of motion of the permanent magnet with respect to the non-magnetic conductor. This results in a zero-hysteresis and nearly ideal linear damper, and thus is often employed as a damper in high-precision mechanisms. For example, functionally identical damping mechanisms are readily visible at the end of "magnetic damping triple beam balances", usually in the form of a thin aluminum blade passing between two permanent magnets at the distal end of the triple beam assembly.
The nonmagnetic conductor is a machined block of aluminum 5.08cm x 5.08cm x 1.27cm with a press fit aluminum cylinder 2.54cm x 1.59cm diam. The aluminum cylinder slides vertically into an appropriately machined Delrin cylinder (3.81cm x 2.54cm diam) and is held in place with a nylon (10-32) screw. This arrangement allows the damping ratio to be adjusted manually to tune the dynamics of the system: the closer the aluminum block is to the magnet, the higher the damping ratio. The use of very powerful grade N42 rare earth
Figure 2. Demonstration of the damping mechanism. All signals are oscilloscope readings of the optoelectronic displacement sensor. (Top) Without damper (Bottom) With damper
The efficacy of the adjustable damper mechanism can be quantified in each position by calculating the damping ratio of the harmonic system. Since the system is underdamped, the damping ratio can be determined from the amplitudes of two successive peaks, and
using the logarithmic decrement method114:
√ (
(
))
Waveform Generation
A graphical user interface was created in VisualBasic 2010 for selection of wave form parameters. A sinusoidal vector is created on the embedded PIC18F4550
microcontroller using the following equation:
( )
The linear displacement of the platform from the zero position is represented by (y) and is measured by optical displacement sensor increments (~1 micron). The Boolean selection of the sine waveform, the amplitude (A) in increments of 10 microns and the frequency in hertz (f) are sent to the bioreactor microcontroller via the electronics described above. Before beginning the protocol, the sinusoid is calculated on the microcontroller for one complete period using a time increment of: in order to yield exactly 1000 steps per sine wave. The sine wave is repeated successively for the duration of the stimulus. Frequency is then set by establishing the update period for the sinusoidal function such that the waveform
amplitude is updated at 1000 times the desired frequency of the output sinusoid.
Stimulation Protocol
To avoid over-stressing the cells and thereby disrupting the cell cycle, the stimulation protocol was set to allow 15 minutes of rest between each 1 minute stimulus duration. Two bioreactors were set up in parallel, one with 1Hz stimulus and the other with 100Hz.
Waveform amplitudes were adjusted to apply similar levels of energy at each frequency.
Umbilical Cord Harvest
transport solution (PBS supplemented 300 U/mL penicillin, 300 µg/mL streptomycin) Approximately 6 cm sections were cut and washed to remove residual blood. The UC epithelium and vessels were removed and discarded, and the Wharton’s Jelly was cut into 1mm2-sized pieces and placed in Dulbecco Modified Eagle Medium (DMEM/F12)
supplemented with 10% MSC-FBS, 50 µg/mL gentamicin, 100 U/mL penicillin, 100 µg/mL streptomycin, 55 µM β-Mercaptoethanol, and 1 mM Sodium Pyruvate. Growth medium was replaced every 3 to 4 days.
Porcine umbilical cord (pUC)-derived MSCs were obtained from pigs at the NC State Swine Education Unit. Cords were processed as described for human cords with small variation. To prevent contamination, cords were dipped briefly in betadine followed by 70% ethanol before dissection as described for human cells. Isolated Wharton’s Jelly was cut into 1mm2-sized pieces and placed in DMEM Supplemented with 15% FBS, 50 µg/mL
gentamicin, 100 U/mL penicillin, 100 µg/mL streptomycin, and 0.25 µg/mL amphotericin B). Growth media was replaced every 2 or 3 days.
Flow Cytometry
at 4°C in the dark until analysis. Cells were analyzed using a Beckman-Coulter (Dako) CyAn ADP and Summit 4.3 software. The results of this process can be seen in (Figure 3).
Figure 3. Characterization of human and porcine MSCs at confluence (left). Results of flow cytometry (right)
Osteogenesis
Either hUC or pUCMSCs were seeded at 2 x10⁴ cell/cm2and incubated in-MEM supplemented with 10% FBS, 2 mM glutamine, 100 U/mL/100 µg/mL
Penicillin/Streptomycin, 10 mM b-glycerophosphate, 0.1 µm dexamethasone, and 50 µM ascorbic acid. Medium was replaced every 2 days. Osteoblastogenic differentiation was assayed at 21 days by Alizarin Red staining.
Chondrogenesis
UCMSCs (human or porcine) were seeded at a density of 4x10⁵cells/cm2an incubated in (DMEM)–high glucose supplemented with ITS-1, 0.1 mM ascorbic acid, 10-7M
ng/mL insulin-like growth factor (IGF)D and 40 µg/mL L-proline. Chondrogenic differentiation was assayed at 21 days by alcian blue staining.116
Vibration
UC-MSC were seeded in regular growth media, at either 2 x10⁴ cell/cm2 (for 100 Hz ) or 4x10⁵cells/cm2 ( for 1 Hz). Cells were allowed to attach for 24 hours and then transfer to vibratory bioreactor program for either 100 Hz or 1 Hz vibration. Cultures were subjected to vibration cycles, as described above, for 15 hours/day for a period of 10 days. Regular growth media was changed every 3 days.
Differentiation Analysis
At 21 days post induction, cells were fixed in 10% buffered formalin for 30 minutes and rinsed with distilled water. To detect calcium deposits in osteogenic induction, cells were stained with 2% alizarin red S solution, pH 4.2, for 10 minutes; in chondro-induced cells the presence of glycosaminoglycans and mucopolysaccharides was demonstrated by staining with 0.1 mg/ml Alcian Blue 8 GX for 20 minutes. Excess dye was removed by careful washes with distilled water. Staining cultures were analyzed under light microscopy, using a Nikon Eclipse Ti-S inverted microscope.
3.3 Results
The bioreactor developed for these experiments successfully generated the desired waveform parameters. The 100Hz and 1Hz stimuli were experimentally measured to be exactly 100.0Hz and 1.0 Hz respectively with zero frequency drift after 2 days of operation.
to controls. Relative to the respective controls, the results of the human and porcine studies were similar. The positive control wells were chemically induced to promote osteogenesis or chondrogenesis. Alizarin red staining of the osteogenesis positive control showed a high calcium content as expected. Correspondingly, Alcian blue staining of the chondrogenesis positive control showed high levels of GAGs as expected. The negative control wells tended toward osteogenesis in this study with very little cartilage present after 10 days.
The samples driven at 100Hz showed denser calcium deposits than negative controls in both human and porcine studies as well as very low levels of GAGs. The samples driven at 1Hz demonstrated substantially higher GAG content than the negative controls and lower calcium content than the 100Hz samples.
Figure 5. pUCMSC preliminary results (Top) Stained for calcium using Alazarin red (Bottom) Stained for GAGs using Alcian blue
Figure 6. mRNA preliminary results (Top) hUCMSC (Bottom) pUCMSC
3.4 Discussion
The data generated in this study demonstrate that vibratory signals can be used to stimulate both human and porcine UC MSCs toward specific phenotypes. If these vibratory signals can eventually be delivered in vivo, and at specific sites, the clinical value would be significant. At lower frequencies, the phenotype appears to be cartilage and at higher frequencies, the phenotype appears to be bone. This preliminary data qualitatively agrees with the differentiation results of individualized studies in the literature in that 1Hz cyclic stimulus enhances chondrogenesis83,110 and higher frequency stimuli enhance
tracking comprehensive gene expression profiles. Additionally, the studies that indicated chondrogenesis differentiation of MSCs applied only compressive loads to the samples. The assessment from the alcian blue and alizarin red staining was reiterated quantitatively by measuring BMP2 and COL2/COL1 mRNA in the samples following the stimulus. This result supplies compelling evidence that MSC differentiation is sensitive to vibrational frequency.
This manuscript has established bioreactor methods that will enable further investigation into the differentiation response of MSCs to vibrational frequency and to determine the thresholds for cartilage and bone formation. In the near future, we plan to develop an implantable bioreactor that will be tested in a subcutaneous porcine model. The stimulation paradigm of the implantable bioreactor will be informed by the results of in-vitro studies conducted with the system presented here.
3.5 Conclusion