TABLE OF CONTENTS
Page No.
LIST OF FIGURES... iv
LIST OF TABLES... vi
LIST OF ABBREVIATIONS... vii
ACKNOWLEDGMENTS... viii
1 INTRODUCTION... 1
2 LITERATURE REVIEW... 2
2.1 Ozonation By-products - General... 2
2.2 Chemistry of Ozonation By-product Formation... 2
2.2.1 Reaction Mechanisms... 3
2.2.2 By-products Formed... 5
2.3 Concerns for Ozonation By-products... 6
2.3.1 Health Effects of Ozonation By-products... 6
2.3.2 Health Effects of Halogenated Ozonation By-products... 7
2.3.3 Regrowth Potential...•... 7
2.4 Observed Levels of Aldehydes... 8
2.5 Effect of Water Quality Characteristics on Aldehyde Levels... 9 *'
3 MATERIALS AND METHODS... 11
3.1 Glassware... 11
3.2 Real Water Collection... 11
3.3 XAD-8 Extraction... 11
3.4 Reconstitution of Model Waters... 13
3.5 Ozonation... 13
3.6 Experimental Procedure... 15
3.6.1 Bulk Water Study... 16
3.6.2 Model Water Study... 16
3.7 Ozonation By-Product Analyses... 17
3.7.1 Aldehydes... 17
3.7.2 Assimilable Organic Carbon... 23
3.8 Other Analytes... 23
4. RESULTS AND DISCUSSION... 25
4.1 Raw Water Quality... 25
4.2 Bulk Water Ozonation... 25
Ul
4.2.2 Aldehyde Production... 26
4.3 Model Water Ozonation... 28
4.3.1 Comparison with Bulk Water Results... 29
4.3.2 Parametric Studies... 31
4.3.2.1 Effect of Ozone:TOC ratio... 31
4.3.2.2 Effect of TOC... 34
4.3.2.3 Effect of pH... 36
4.3.2.4 Effect of Alkalinity... 38
4.3.2.5 Effect of Bromide... 38
4.4 Assimilable Organic Carbon Results... 39
4.5 Bromate... 41
5. CONCLUSIONS AND RESEARCH NEEDS... 42
5.1 Conclusions... 42
5.2 Research Needs... 43
REFERENCES... 45
APPENDIX A Aldehyde Method and Analysis Procedure... 49
LIST OF FIGURES
Figure Page No.
2.1 Direct Reaction of Ozone... 3
2.2 Indirect (Radical) Reaction of Ozone... 4
2.3 Effects of pH, Alkalinity, and Ozone Dosage on the Formation
of Aldehydes from Ozonations of NOM Fractions at 5 mg/L NVDOC... 9
3.1 Schematic of XAD-8 Setup... 12
3.2 Ozone Reactor Schematic... 14
3.3 Ozone Transfer Calculated By Integration of PCI Monitor Readings... 15
3.4 Aldehyde Derivitization and Extraction Method... 19
3.5 Sample Chromatogram for Aldehyde Analysis... 20
3.6 Sample Calibration Curve for Formaldehyde... 21
4.1 Aldehyde Formation in Ozonated Bulk Waters... 28
4.2 Normalized Aldehyde Formation in Ozonated Bulk Waters... 28
4.3 Formaldehyde Yield in Ozonated Waters; Ozone:TOC = Img/mg... 31
4.4 Effect of Ozone :TOC Ratio on Aldehyde Formation
from Myrtle Beach Extract... 32
4.5 EffectofOzone:TOC Ratio on Aldehyde Formation from Palm Beach Extract... 32
4.6 Effect of Ozone:TOC Ratio on Aldehyde Formation from Hackensack Extract... 33
4.7 EffectofOzone:TOC Ratio on Aldehyde Formation from Colorado River Extract... 33
4.9 Effect of TOC Concentration on Aldehyde Formation
from Myrtle Beach Extract... 35
4.10 Effect of Ozonation pH on Aldehyde Formation
from Myrtle Beach Extract... 36
4.11 Effect of Ozonation pH on Aldehyde Formation: Comparison of
Batch and Semi-Batch Experiments for Myrtle Beach Extract... 37
4.12 Effect of Alkalinity on Aldehyde Formation for Myrtle Beach Extract... 38
4.13 Effect of Bromide on Aldehyde Formation - Myrtle Beach Extract... 39
VI
LIST OF TABLES
Table Page No.
3.1 Organic Carbon Concentration of XAD-8 Extracts... 12
3.2 Range of Conditions for Parametric Extract Study... 17
3.3 Gas Chromatograph Method for Aldehyde Analysis... 18
3.4 Standards Used for Aldehyde Analysis... 22
4.1 Raw Water Quality Characteristics... 25
4.2 Bulk Water Ozonation Results... 26
4.3 Bulk Water Aldehyde Formation, OzoneiTOC = 1 mg/mg... 27
4.4 Normalized Bulk Water Aldehyde Formation, Ozone:TOC = 1 mg/mg.... 27
4.5 Aldehyde Formation in Ozonated Model Waters... 30
4.6 Normalized Aldehyde Yield in Ozonated Model Waters... 30
Vll
LIST OF ABBREVIATIONS
AOC AWWA
AWWARF
BDOC BDL
BOM DBAA
DBP
GC HAAs
lARC MDL
MTBE MW N/A
NOM
NVDOC
03:T0C
OPW
PFBHA-HCL THMs
TKN
TOC
USEPA
UV
XAD-8
Assimilable Organic Carbon
American Water Works Association
American Water Works Association Research Foundation Biodegradable Organic Carbon
Below Detection Limit
Biodegradable Organic Material
Dibromoacetic acid Disinfection By-product Gas Chromatograph
Haloacetic acids
International Agency for Research on Cancer
Method Detection Limit Methyl-t-butyl Ether Molecular Weight
Not Analyzed or Not Available Natural Organic Matter
Non-volatile Dissolved Organic Carbon Ozone to TOC Ratio (mg ozone / mg TOC)
Organic-Pure Water
0-(2,3,4,5,6-Pentafluorobenzyl)hydroxalamine Hydrochloride
Trihalomethanes
Total Kjeldahl Nitrogen Total Organic Carbon
United States Environmental Protection Agency Ultraviolet
ACKNOWLEDGMENTS
I would like to thank my advisor. Professor Philip Singer, for his teaching, his insight,
and his guidance during my time at UNC-Chapel Hill. I would also like to thank
Professor Francis DiGiano and Professor WiUiam Glaze for serving on my Master's
committee.
Special thanks must go to those with whom I had the pleasure of working on this
sometimes-long research project. My sincere gratitude goes to Gretchen Cowman, Greg
Harrington, Lori Harrington, and Maria Smith. Great thanks also go to Howard
Weinberg, who taught me everything I know about gas chromatography and the aldehyde
analytical method.
I would like to thank the American Water Works Association Research Foundation for
funding this study, and the utilities who assisted in collecting samples for these studies.
Finally, I would like to thank Dr. Eugene Rice at USEPA in Cincinnati OH for
CHAPTER 1
INTRODUCTION
Ozone is gaining in popularity as an oxidant and disinfectant for drinking water supplies
in the United States. It is already widely used in Europe, where it is also frequently used
to destroy micropoUutants in water. This rise in popularity can be associated with
concerns over the health effects of chlorination by-products. These concerns have been
codified into the Disinfectants and Disinfection By-products (D/DBP) Rule which
regulate two classes of chlorination by-products, trihalomethanes (THMs) and haloacetic
acids (HAAs). While these regulations will encourage utilities to examine alternative
disinfectants such as ozone, there is a significant gap in our knowledge of the ozonation
by-products. Without research on ozonation by-products, many feel that we may simply
trade a "known" risk (chlorination DBFs) for an "unknown" risk (ozonation DBFs).
This study was designed to explore the formation of aldehydes, a primary class of by¬
products formed when treating drinking waters with ozone. This study examines the
formation of aldehydes in four ozonated waters under different conditions. To perform
most of the experiments, model waters were used in which organic extracts from four
drinking water sources were reconstituted at uniform water quality conditions.
It is intended that the data and conclusions in this report will help to provide information
on the ozonation conditions that create aldehydes. Additional work was also conducted
to address the role of ozone in creating biodegradable organic matter (BOM) in drinking
waters. This study is part of a larger project sponsored by the American Water Works
Association Research Foundation (AWWARF). Future related work will investigate
aldehydes as precursors to halogenated by-products upon subsequent chlorination or
chloramination. Additionally, characterization of the organic material in the source
waters used will help to explain why different types of natural organic material react to
form different levels of disinfection by-products.
This study attempts to furnish information to further shrink the knowledge gap on
ozonation by-products. This should lead to a better understanding of the implications that
CHAPTER 2 LITERATURE REVIEW
2.1 Ozonation By-products - General
Ozone is a powerful oxidant and disinfectant gaining wider acceptance in the United
States for use in drinking water treatment. It is being considered both for use as a primary disinfectant, and as an oxidant capable of removing taste and odor compounds.
As a primary disinfectant, ozone treatment is followed by secondary disinfection, usually with chlorine or chloramines. In general, ozonation is an effective method for lowering the amotint of halogenated by-products (e.g. trihalomethanes, haloacetic acids) formed in drinking water (Jacangelo et al., 1989). One of the driving forces for ozone use in the U.S. is the desire to decrease levels of these halogenated by-products (Singer, 1990). Ozone, however, produces its own by-products when it reacts with the organic material in water. These ozonation by-products are less understood than the chlorination by¬
products. This report addresses the formation of one class of ozonation by-products, the
aldehydes.
Ozone will react with the natural organic matter (NOM) found in all lake, stream, and groimdwaters to form aldehydes. The concern over aldehyde formation is threefold. First, there are concerns about the health effects of aldehydes. Formaldehyde is a
common chemical which has known adverse effects on the respiratory system, and is
suspected to be a human carcinogen. The second concern is that these aldehydes will act as precursors leading to formation of potentially harmful chemicals upon chlorination or chloramination. Many of the chlorinated organics are thought to be carcinogenic. The third concern is over the effect of ozonation on microbial growth in treatment plants and
distribution systems. Ozone is known to produce high levels of biodegradable organic
matter (BOM) and the concern is for problems such as biological fouling and microbial
regrowth following ozonation.
This chapter discusses some of the chemistry underlying the formation of ozonation by¬
products, details the concerns over the by-products, and examines the levels of ^dehydes
observed by other researchers.
2.2 Chemistry of Ozonation By-product Formation
by-products. The notable by-products are organic acids, aldehydes, and hydrogen
peroxide (Singer, 1993). In these reactions, ozone will act either as molecular ozone (the
direct reaction) or through hydroxyl radicals formed by the decomposition of ozone
(indirect reaction). Hoigne (1988) has elucidated the differences between these two
mechanisms, and the conditions under which each operates.
2.2.1 Reaction Mechanisms
In general, molecular ozone will cleave double bonds in organic material, forming an
ozonide, which reacts further to form ketones, aldehydes, and hydroxyhydroperoxides,
some of which will continue to react. This direct reaction pathway is favored under
conditions of low pH and in the presence of radical scavengers such as carbonate and
bicarbonate. The indirect (radical) reaction pathway is favored at high pH, low
concentrations of radical scavengers, and by the addition of an initiator, e.g. ultraviolet
(UV) radiation or hydrogen peroxide. The indirect reaction is a less substrate-specific
oxidation reaction, which often results in formation of superoxide ('02") or a peroxy
radical (ROO*), which react further forming peroxides, aldehydes, and various acids.
Example mechanisms for the direct and indirect reactions are shown in Figures 2.1 and
2.2, respectively.
\
C^C
^ o.
^R'
RX=o + H02.ca
}Ce^o/\e. -tonulfc
c c
ͣ
0
H3COH
r«\elVWr»o\
R,C
9. "^H
w^^.
OH
00
ͣ
p^odvJctͣs
Figure 2.2 Indirect (Radical) Reaction of Ozone. After Staehelin and Hoigne (1985).
Hureiki and co-workers (1993) found that when ozonating amino acids, aldehydes are
preferentially formed by the direct molecular reaction. Aldehydes have also been
observed as by-products of chlorination (Tatsumi et al. 1993), and as a product of natural
metabolic processes (Zhou, 1993).
Aldehydes are not entirely stable, however, and can also act as precursor material for
other disinfection by-products. Researchers have observed that acetaldehyde will react
with free chlorine to form chloral hydrate. (McKnight and Reckhow, 1992). McKnight
and Reckhow also examined relative rates of reaction with chlorine and chloramine for
various ozonation by-products. They found that the reaction rates for the chlorination and
chloramination were, from fastest to slowest:
Keto-acids » Keto-aldehydes > Aldehydes
Fastest Slowest
This means that the ketoacids produced from ozonation will react most quickly with
chlorine in a drinking water plant. Accordiag to this logic, aldehydes (the
2.2.2. By-products Formed
The major compounds identified from the ozonation of drinking water are aldehydes,
from the low-molecular weight formaldehyde (MW=30) up to very high molecular
weight tetradecanal (MW=212) (Glaze et al., 1989), along with aldoacids, ketoacids, and carboxylic acids. Most researchers have found that aldehyde and organic acid levels well
exceed the formation of other by-products. Of the aldehydes measured, LeLacheur et al. (1991) found that formaldehyde, acetaldehyde, glyoxal, and methyl glyoxal comprised
80-85% by weight of the total aldehyde concentration. For this reason, most studies have focused on these four main aldehydes. Some recent reports, however, suggest that other compounds may form in greater quantities. Xie and Reckhow (1992) found that ketoacid
formation was higher than aldehyde formation. Using higher ozone doses than most
studies, Edwards and Benjamin (1992) foimd that oxalate levels exceeded all other by¬ products following ozonation. Murphy et al. (1993) found levels of organic acids two to three times higher (by weight) than aldehydes. Organic peroxides and epoxides may also
be formed through ozonation of natural organic matter, but little data exists on the occurrence of these compounds (Glaze, 1986). Other by-products will undoubtedly be
found in the future, as analytical methods improve.
In waters containing bromide, there is great concern for the formation of bromate following ozonation. Bromate is listed as a probable human carcinogen by the USEPA
(Bull and Kopfler, 1991). Numerous studies have found bromate after applying ozone to
waters containing bromide (e.g., MWD/JMM 1989; Krasner et al., 1993a). Other brominated organics that have also been found following ozonation of bromide-containing waters include dibromoacetic acid, dibromoacetonifrile, and bromoform
(Siddiqui and Amy 1993).
Additionally, there are a number of chlorinated disinfection by-products whose
production is enhanced by pretreatment with ozone. Researchers have detected increases
in chloral hydrate (McKnight and Reckhow, 1992), cyanogen chloride (Krasner et al.,
1991b), trichloropropanone (Tan and Amy, 1991), frichloroacetone (Reckhow and Singer, 1984), and chloropicrin (Hoigne and Bader, 1988) when pre-ozonation is utilized in a conventional chlorination or chloramination treatment train. While not actually
health effects. The carcinogenicity of several of the chlorination by-products has driven
researchers to focus upon the chronic effects of exposure to disinfection by-products. A
secondary, and more operational concern is over the potential for microbial regrowth due
to the biodegradability of organic material following ozonation.
2.3.1 Health Effects of Ozonation By-products
For aldehydes, there is an implication, but no clear evidence of carcinogenicity at the
levels expected to occur in drinking water (Bull and Kopfler, 1991). Of the aldehydes,
formaldehyde and acetaldehyde are the primary constituents in ozone-treated water, with
glyoxal and methyl glyoxal also formed to a lesser extent (Krasner et al., 1993). Of these
compounds, formaldehyde has shown some evidence of human carcinogenicity, but this
data is based primarily upon inhalation studies and is obtained at doses higher than would
be encountered in drinking water (lARC, 1987). Acetaldehyde has been shown to be
carcinogenic in animal studies, and glyoxal and methyl glyoxal have shown some
indication of mutagenicity in microbial and some animal studies (Bull and Kopfler,
1991).
The International Agency for Research on Cancer (lARC) and the US Environmental
Protection Agency (USEPA) both rate chemicals as to their carcinogenic potential. lARC
rates formaldehyde in Group 2A - "Limited Evidence of Human Carcinogenicity".
USEPA calls formaldehyde a Group B1 - "Probable Carcinogen" (Bull and Kopfler,1991). Acetaldehyde is rated by lARC as Group 2B - "Inadequate Evidence of Human
Carcinogenicity, Sufficient Evidence of Animal Carcinogenicity". Glyoxal is not ratedand Methyl Glyoxal is rated as Group 3 - "Not Classifiable".
In a summary of health effects of disinfection by-products in drinking water. Bull and
Kopfler (1991) concluded that:
"On the basis of current evidence it is difficult to conclude that either
formaldehyde or acetaldehyde poses a carcinogenic risk when consumed in drinking water.. .. Even if they were to be considered carcinogens, the
potency of aldehydes is sufficiently low not to seriously limit the use of
A number of ozonation by-products have yet to be identified. Glaze (1986) notes that
hydroperoxides, currently difficult to measure, may be of health concern.
2.3.2 Health Effects of Halogenated Ozonation By-productsOf the other ozonation by-products, bromate is the only one formed during ozonation to
have shown detrimental health effects significant enough to warrant individual regulation.
The USEPA will regulate bromate levels at 10 \igfL in the upcoming D/DBP rule.
Additionally, dibromoacetic acid, which can form from ozonation, will also be regulated
in the D/DBP rule as one of the five regulated HAAs (AWWA, 1993).
Significant concern exists regarding the formation of chlorinated organics as a result of
ozonation and subsequent chlorination or chloramination. While ozonation has been
found to decrease levels of trihalomethane formation in drinking water plants, noted
increases in cyanogen chloride, chloral hydrate, and some of the haloketones are a cause
for concern (McKnight and Reckhow,1992; Krasner et al., 1991b). All of these
compounds are suspected of having adverse health effects. In terms of relative risk,
aldehydes and other ozonation by-products may pose a greater risk as precursors to more
harmful halogenated compoimds than they pose on their own.
2.3.3 Regrowth Potential
Other concerns about ozonation by-products are not based directly upon health effects.
These concerns center about the fact that ozonation will alter the natural organic material
in water. Ozonated organic material tends to be much more biodegradable than the parent
natural organic material in the source water, and can cause microbial regrowth problems
later in the treatment plant or in the distribution system. Additionally, many of the
identified ozonation by-products are themselves biodegradable, e.g. aldehydes and
ketoacids. In a survey of 18 operating U.S. ozone plants in 1990, two plants reported
enhanced growth or regrowth of microorganisms in the distribution system (Tate, 1991).
For this reason, many researchers are suggesting biological filtration following ozonation
to remove some of the biodegradable material. In doing so, such treatment will also
reduce the potential for enhanced formation of halogenated DBFs following chlorination
or chloramination (Murphy et al., 1993).
A number of researchers have focused on measurable parameters, such as the
Biodegradable Organic Carbon (BDOC) or Assimilable Organic Carbon (AOC)
good overview of these and other methods for measuring biodegradable organic matter
(BOM) and bacterial growth potential. These two measures are becoming relatively
standard procedures, and while they are good measures of relative biodegradability, they
are not in themselves sufficient to determine whether or not a treatment plant will have a
regrowth problem.
Some researchers have concentrated upon finding chemical surrogates for these measures
of biodegradability. Due to the microbiological nature of the BDOC and AOC
measurements, they both take several days and a great deal of effort to perform an
analysis. Chemical surrogates have been suggested for fast, easy measures of relative
biodegradability. Xie and Reckhow (1992) found that ketoacid concentration provided a
good correlation to AOC for a single water source. Amy et al. (1992), using several
different water sources, found that aldehydes did not provide a good correlation to
BDOC.
2.4 Observed Levels of Aldehydes
As mentioned previously, background aldehyde levels in raw drinking water are common
due to natural and anthropogenic phenomena. These levels, usually less than 5 \ig/L, are
generally much lower than those produced by ozone treatment. Background levels of
formaldehyde, and occasionally acetaldehyde, often a result of wastewater discharges,
have been detected by several researchers. In an extreme case, Tatsumi et al., (1993)
found background aldehyde levels of 20-30 ng/L in parts of the Yodo River, a water
source for the city of Osaka, Japan.
In most cases, however, ozone treatment represents the main potential source of
aldehydes in drinking water. A number of studies, e.g. Schalekamp (1986), MWD/JMM
(1989) and Weinberg et al. (1993), have explored aldehyde formation in ozonated
drinking waters. In one survey of disinfection by-products, formaldehyde levels in the
clearwell of three ozonation plants ranged from 7.5 to 21 \igfL. These levels decreased to
< 1 \ig/L to 3.2 \xgfL at the plant effluent (MWD/JMM, 1989). Interestingly, a number
of plants that did not use ozone also had formaldehyde levels in this range at the plant
effluent. This can be due either to formaldehyde produced by chlorination or to the
presence of formaldehyde in the influent to the plants.
aldehyde concentrations ranging from 14-147 \igfL, and formaldehyde production from
0.3 to 13 |ag/mg TOC at the outlet of the ozone contactors. Aldehydes are universally
found in the effluent of ozonation contactors. Many of the studies exploring the levels of
aldehydes formed have also concentrated on using biological filters to remove these
aldehydes following ozonation (Miltner et al. 1992; Weinberg etal. 1993).
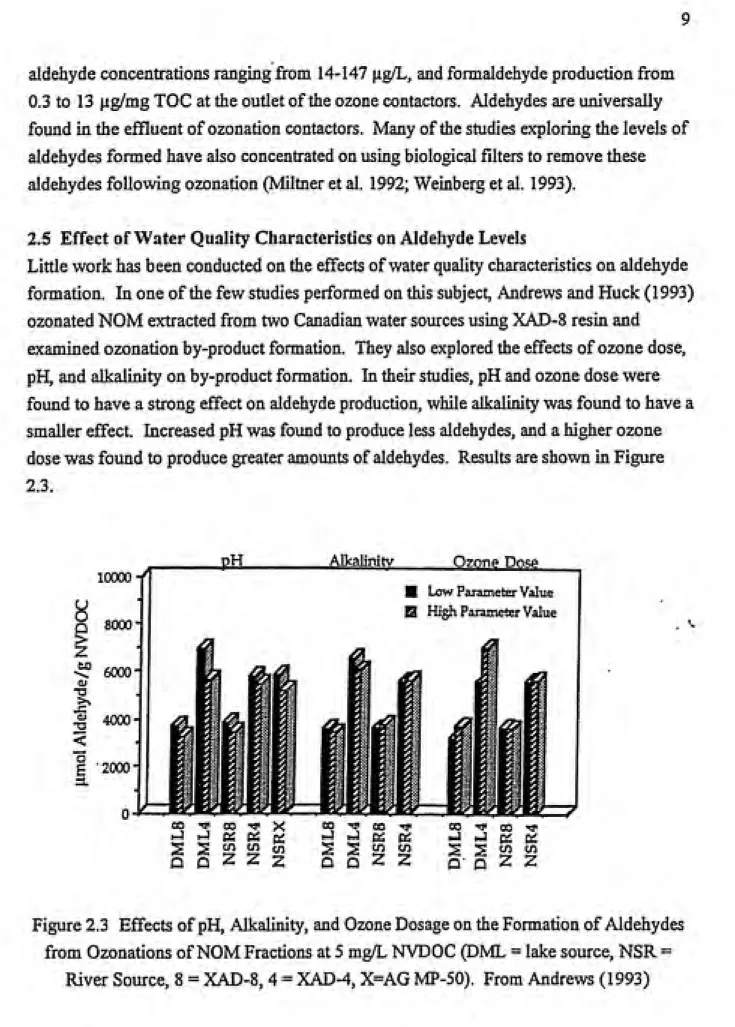
2.5 Effect of Water Quality Characteristics on Aldehyde Levels
Little work has been conducted on the effects of water quality characteristics on aldehyde
formation. In one of the few studies performed on this subject, Andrews and Huck (1993)
ozonated NOM extracted from two Canadian water sources using XAD-8 resin and
examined ozonation by-product formation. They also explored the effects of ozone dose,
pH, and alkalinity on by-product formation. In tteir studies, pH and ozone dose were
found to have a strong effect on aldehyde production, while alkalinity was found to have a
smaller effect. Increased pH was found to produce less aldehydes, and a higher ozone
dose was found to produce greater amounts of aldehydes. Results are shown in Figure
2.3.
10000
Alkalinity Ozone Dose
Low Parameter Value
High Parameter Value
8000-^
6000-Si 4000
00 ͣ* 00 TJ* X 00 ͣ* 00 ͣ^
>-l hJ K « pS J .-1 K {^
^ >• CD CT) CD p, ? en tn
D D /i Z 2 D D /i ^
00 Tf 00 '*
id '-' P^ cti S S « V5
O O 2 2
Figure 2.3 Effects of pH, Alkalinity, and Ozone Dosage on the Formation of Aldehydes
from Ozonations of NOM Fractions at 5 mg/L NVDOC (DML = lake source, NSR =
Of particular note is the large difference in aldehyde formation between the two waters
tested. It is well-known that water quality characteristics are crucial in determining the amount of by-products that will form, but the nature of this relationship is largely
unknown.
11
CHAPTER 3
MATERIALS AND METHODS
3.1 Glassware
Forty ml glass vials used for aldehyde analysis were detergent-washed in tap water, soaked in a chromic acid bath for at least 30 min., and subsequently rinsed with tap water, rinsed with distilled, deionized water, and oven-dried at 85°C. Glassware for general laboratory use was detergent-washed in tap water, soaked in a 10% nitric acid bath overnight, rinsed with distilled, deionized water, and oven-dried at 85°C. The ozone reactor was rinsed several times with organic-pure water (Dracor Lie, Durham, NC)
between ozonations.
3.2 Real Water Collection
The utilities selected for this study all have fbll-scale or pilot-scale ozonation plants utilizing the source water collected. The utilities selected were Hackensack, NJ, Myrtle
Beach, SC, Pahn Beach County, FL, and Metropolitan Water District of Southern
California. Real water samples refer to samples of untreated water collected from each of the utilities. Such samples will be hereafter referred to as bulk water samples.
Bulk water samples were collected from each utility at a single sample point. Untreated
water was filtered through a 1.0 ^m honeycomb filter and collected in five gallon
polyethylene containers. The containers were then shipped in coolers by overnight carrier to the laboratory at UNC-Chapel Hill. Once received in Chapel Hill, the bulk waters were
stored in a 5°C refrigerator until use.
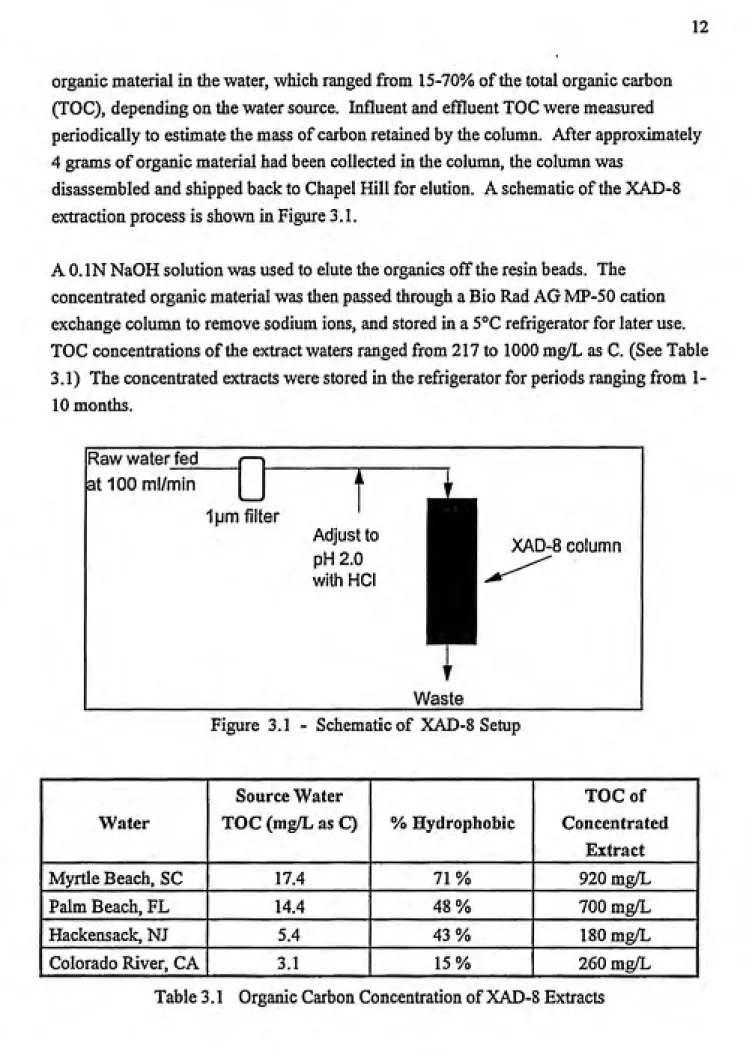
3.3 XAD-8 Extraction
Extraction of organic material by XAD-8 resin is a common method for isolating humic and fulvic material from water. XAD-8 extracts of hydrophobic organic material were obtained from raw water at each plant, according to the method of Thurman and Malcolm, (1981). A 3.5 cm diameter, 1.0 m long column packed with 3 liters of Amberlite XAD-8
resin beads (Rohm & Haas, Philadelphia, PA) was shipped to each utility. The column
was connected to a raw water feed line following passage through a 1.0 ^m honeycomb filter to remove particulates. Raw water was fed at 100 ml/min. onto the column, for times ranging from several days to several weeks, dependmg on the water source. A 1 .ON solution of hydrochloric acid was fed prior to the column to ensure that influent water to
organic material in the water, which ranged from 15-70% of the total organic carbon
(TOC), depending on the water source. Influent and effluent TOC were measured periodically to estunate the mass of carbon retained by the column. After approximately
4 grams of organic material had been collected in the column, the column was
disassembled and shipped back to Chapel Hill for elution. A schematic of the XAD-8
extraction process is shown in Figure 3.1.
A 0. IN NaOH solution was used to elute the organics off the resin beads. The concentrated organic material was then passed through a Bio Rad AG MP-50 cation
exchange column to remove sodium ions, and stored in a 5°C refrigerator for later use. TOC concentrations of the extract waters ranged from 217 to 1000 mg/L as C. (See Table
3.1) The concentrated extracts were stored m the refrigerator for periods ranging from
1-10 months.
at 100 ml/min Raw water fed
1|jm filter
Adjust to pH2.0 with HOI
XAD-8 column
Waste
Figure 3.1 - Schematic of XAD-8 Setup
Water
Source Water
TOC (mg/L as C) % Hydrophobic
TOC of 1
Concentrated 1 Extract
1 Myrtle Beach, SC
17.4 71%920 mg/L 1
1 Palm Beach, FL
14.4 48%700 mg/L 1
1 Hackensack, NJ
5.4 43%180 mg/L 1
1 Colorado River, CA
3.1 15%260 mg/L 1
13
3.4 Reconstitution of Model Waters
Model waters were reconstituted by diluting the extract material in organic-pure water to
the desired TOC concentration. A l.OM NaHC03 solution was added for alkalinity
(0.002M NaHC03) and pH was adjusted to 7.0 with H2SO4 or NaOH.3.5 Ozonation
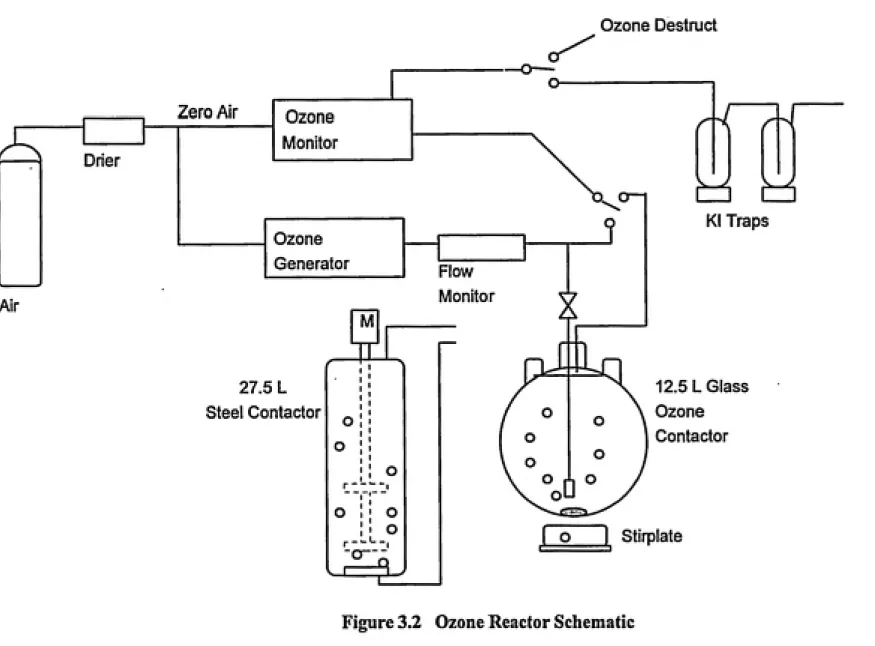
Ozonation was performed on a semi-batch basis by bubbling ozone through a stirred
reaction vessel (Figure 3.2). Ozone was generated from breathing quality air (National
Welders Supply Corp., Charlotte, NC) with a Grace LG-2-L1 ozone generator (Union
Carbide, South Plainfield, NJ). Ozone dose was calculated by two methods: potassium
iodide (KI) traps, and the use of an ozone monitor. Calibration difficulties made the
ozone monitor less reliable, so it was used only as an operational tool; the KI traps were used to calculate the actual applied ozone dose.For the KI method, feed-gas and off-gas were measured by bubbling ozone-enriched air
through two 500-ml gas washing bottles connected in series, each containing 20 g/L
potassium iodide (KI). This solution was subsequently titrated with O.IN sodium
thiosulfate (Na2S203), according to Standard Method 422 (APHA, AWWA, WEF,
1985). The amount of ozone transferred was calculated as the difference between the
feed-gas and off-gas concentrations, divided by the solution volume.
As an operational tool, ozone in the feed-gas and off-gas was also measured by a PCI
model HC-1 ozone monitor (PCI Ozone Corp., West Caldwell, NJ). The desired ozone
dose was achieved by integrating the amount of ozone transferred into the reactor every30 seconds, and shutting off the ozone when a sufficient amount had been transferred. A
visual example of the way in which transferred ozone doses were calculated using the
monitor is shown in Figure 3.3. The integration procedure was programmed into a hand¬
held calculator to allow immediate calculation of the transferred ozone dose.
Experiments were begun with a 27-liter stainless steel cylindrical reactor. This reactor
was subsequently replaced with a 12.5-liter glass spherical reactor when it wasdetermined that less water was needed for analysis. The ozone transfer efficiency was
approximately 40% in the stainless steel reactor and 35% in the glass reactor. Most
ozonations required between 8 and 15 minutes to achieve the desired dose. The ozonated
^
DrierAir
Zero Air Ozone Monitor
Ozone
Generator
M
27.5 L Steel Contactor
o
o
5-Flow
Monitor
o o—1
r<
X^
H
Kl Traps
12.5 L Glass Ozone Contactor
I o 1 Stirplate
15
residual ozone to dissipate. After one hour, there was no detectable ozone residual in the
aqueous samples.
The ozonation procedure and apparatus was checked by performing a series of mass
balance tests. Ozone demand-free water was pH-adjusted to below pH 3.0 and ozonated in the reactor. The feed-gas and off-gas measurements were used to calculate the amount
of ozone transferred to the water. This calculated ozone dose was compared to the
dissolved ozone residual measured by UV-258 absorbance in the water. The system provided good agreement between the calculated ozone transferred and the actual residual measured. This agreement assured that the ozonation system was intact and leak-free, and that the calculation methods were accurate.
mg/L Ozone
35.0 T
30.0 -: 25.0-20.0 15.0 10.0
5.0 1
0.0
Feed-gas concentration
TR/.NSFERRED OZONE in mg
(Feed gas
L
Off c as inte jrated over time)
Off-gas concentration
8 8 8
o
8 oo
iri
o
o o
<b
o
Time (min)
Figure 3.3 Ozone Transfer Calculated by Integration of PCI Monitor Readings
Ozone residual was measured by the indigo colorimetric method, Standard Method 4500
(APHA, AWWA, WEF, 1989). Indigo concentrations were measured at 600nm on a
Cary Model 219 spectrophotometer (Varian Assoc. Inc., Palo Alto, CA). Residual ozone was also measured in organic-pure water by measuring the absorbance at 258 nm and
using an extinction coefficient of 2950 M'^cm'l.
3.6 Experimental Procedure
The experiments were divided into two groups:
Bulk Water Study (Myrtle Beach, Palm Beach, Hackensack)
In all, 28 separate ozonations were conducted. The experimental procedure for each of
these studies is described in the following sections:
3.6.1 Bulk Water Study
For the bulk water studies, raw water was ozonated at ambient pH at a 1:1 03:T0C ratio.
For instance, Palm Beach water, with a TOC of 14.4 mg/L as C, received approximately14.4 mg O3/L. Samples for ozonation by-products were collected before and after ozonation.
3.6.2 Model Water Study
In the first part of the model water study, the concentrated extract was reconstituted to a
vmiform set of conditions:
4.0 mg/L TOC
100 mg/L Alkalinity as CaC03
pH7.0
and ozonated at three ozone-to-TOC ratios: 0.5:1, 1:1, 2:1, on a mg ozone / mg TOC
basis. The purpose of these uniform conditions was to compare different organic material
and different ozone doses under the same water quality conditions. Samples forozonation by-products were collected before and after ozonation.
The second part of the model water study was to take one hydrophobic extract, firom
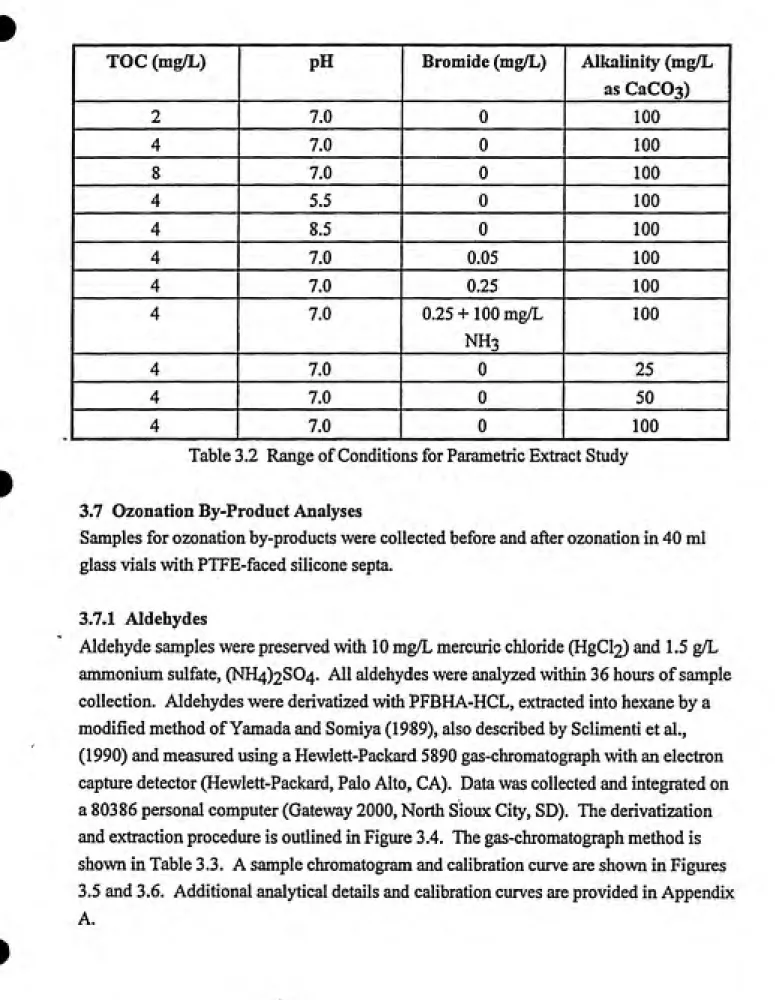
Myrtle Beach, and to examine the effects of four water quality parameters on ozonationby-product formation: TOC, pH, Bromide, and Alkalinity. These parameters are known
to vary widely across different source waters, and it was desired to test a range of conditions for aldehyde formation.The matrix of conditions shown in Table 3.2 was used to reconstitute the extract for these
experiments. All waters were ozonated at a 1:1 ozone-to-TOC ratio. The variations in
the parameters were selected to represent a low, middle, and high value for drinking
17
1 TOC (mg/L)
pH Bromide (mg/L) Alkalinity (mg/Las CaCOs)
2 7.0 0 100
1 "^
7.0 0 1008 7.0 0 100
4 5.5 0 100
4 8.5 0 100
4 7.0 0.05 100
4 7.0 0.25
100 1
4 7.0 0.25+ 100 mg/L
NH3
100
4 7.0 0 25
4 7.0 0 50
4 7.0 0
100 1
Table 3.2 Range of Conditions for Parametric Extract Study
3.7 Ozonation By-Product Analyses
Samples for ozonation by-products were collected before and after ozonation in 40 ml
glass vials with PTFE-faced silicone septa.
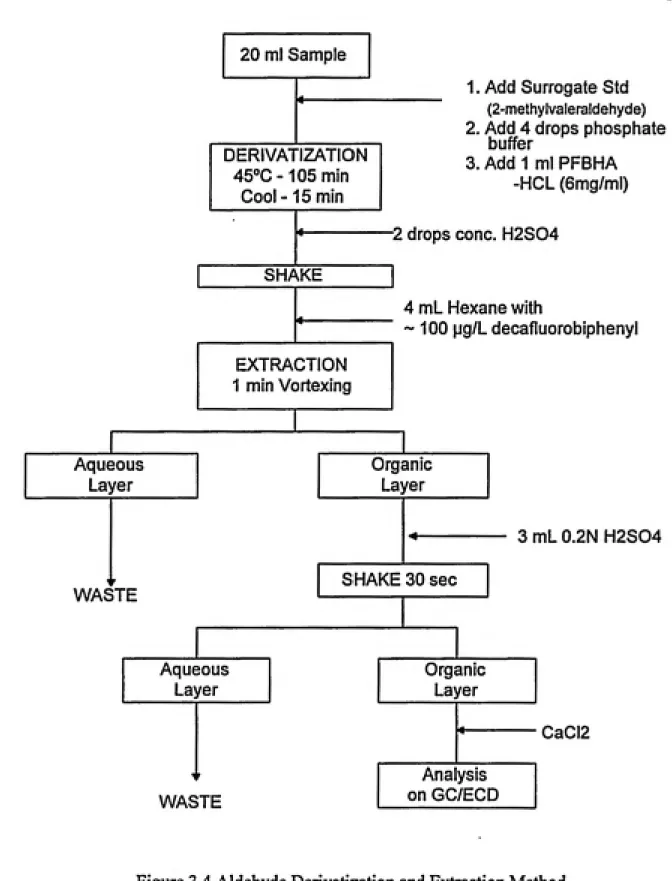
3.7.1 Aldehydes
Aldehyde samples were preserved with 10 mg/L mercuric chloride (HgCl2) and 1.5 g/L
ammonium sulfate, (NH4)2S04. All aldehydes were analyzed within 36 hours of sample
collection. Aldehydes were derivatized with PFBHA-HCL, extracted into hexane by a
modified method of Yamada and Somiya (1989), also described by Sclimenti et al.,
(1990) and measured using a Hewlett-Packard 5890 gas-chromatograph with an electron
capture detector (Hewlett-Packard, Palo Alto, CA). Data was collected and integrated on
a 80386 personal computer (Gateway 2000, North Sioux City, SD). The derivatization
and extraction procedure is outlined in Figure 3.4. The gas-chromatograph method is
shown in Table 3.3. A sample chromatogram and calibration curve are shown in Figures
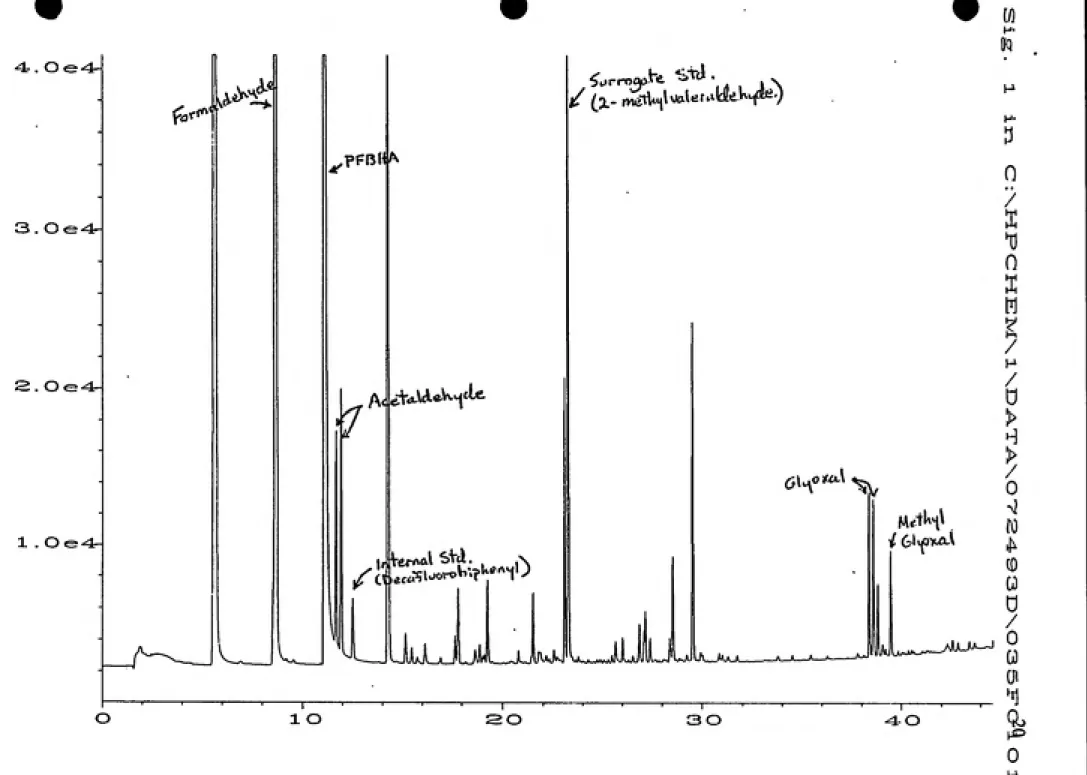
3.5 and 3.6. Additional analytical details and calibration curves are provided in Appendix
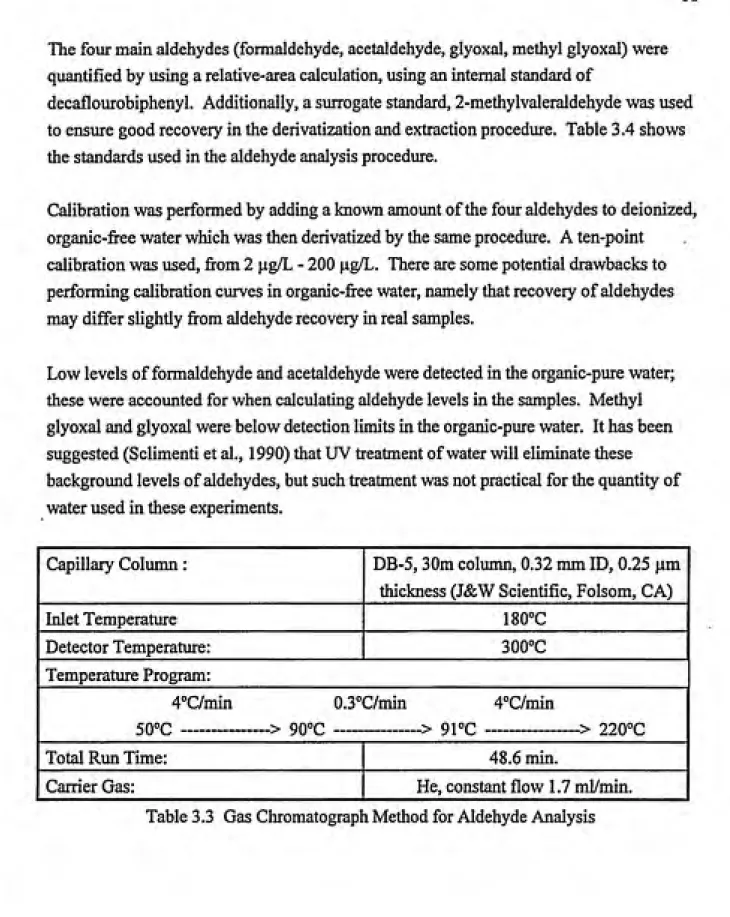
The four main aldehydes (formaldehyde, acetaldehyde, glyoxal, methyl glyoxal) were quantified by using a relative-area calculation, using an internal standard of
decaflourobiphenyl. Additionally, a surrogate standard, 2-methylvaleraldehyde was used to ensure good recovery in the derivatization and extraction procedure. Table 3.4 shows the standards used in the aldehyde analysis procedure.
Calibration was performed by adding a known amount of the four aldehydes to deionized,
organic-free water which was then derivatized by the same procedure. A ten-point
calibration was used, from 2 |i.g/L - 200 ng/L. There are some potential drawbacks to
performing calibration curves in organic-free water, namely that recovery of aldehydes
may differ slightly from aldehyde recovery in real samples.
Low levels of formaldehyde and acetaldehyde were detected in the organic-pure water; these were accounted for when calculating aldehyde levels in the samples. Methyl glyoxal and glyoxal were below detection limits in the organic-pure water. It has been suggested (Sclimenti et al., 1990) that UV treatment of water will eliminate these background levels of aldehydes, but such treatment was not practical for the quantity of water used in these experiments.
Capillary Column: DB-5, 30m column, 0.32 mm ID, 0.25 |im thickness (J&W Scientific, Folsom, CA)
Inlet Temperature 180°C
Detector Temperature: 300°C
Temperature Program: |
4°C/min
50°C
---0.3°C/min 4°C/min
__> Qo°r__________> Qi°c__________> 220°r
1 Total Run Time:
48.6 min. |
1 Carrier Gas:
He, constant flow 1.7 ml/min. |
19
Aqueous Layer
WASTE
20 ml Sample
DERIVATIZATION 45''C-105min
Cool -15 min
1. Add Surrogate Std
(2-methylvaleraldehyde) 2. Add 4 drops phosphate
buffer
3. Add 1 ml PFBHA
-HCL (6mg/ml) -2 drops cone. H2S04
SHAKE
4 mL Hexane with
~ 100 pg/L decafluorobiphenyl
EXTRACTION
1 min Vortexing
Organic Layer
3 mL 0.2N H2S04
SHAKE 30 sec
Aqueous Layer
Organic
Layer
WASTE
Ana
CaCI2
ysis on GC/ECD
3.0e-4^
S.Oe-4^
1 .Oe-4^
O
f«^<^<^
,pFRlf^
A< et*\A*W^«U
•f;l«s;Lti-;,u..,o
Jiij-j
J
-^^jukkIJ
1 o 30 30
64<"^^ ^5V
...^..-^-^Al,^^
40
0
'/
n
/
/ d > >
/
/
0 ^l W
^
(D
Q
d
/ /
0 CO Gi
0
ͣ
'!iBR5Wiw)w?'?.w«!|
21
CO
450 T
400
350 +
300
g 250 +
<
oj 200 + >
0) 150
100 --50
0*^
Calibration Curve Formaldehyde
24-JUI-93
>
f ^ = O.'^'^S
20 40 60 80 100 120 140
Spiked Concentration (ug/L)
160
Name Formula Source Purity Mol.
Weight
Density
Formaldehyde HCHO Aldrich
Lot 03609AZ
37% 30.03 1.083 g/ml
Acetaldehyde CH3CHO Aldrich
Lot 05203BZ
99% 44.05 0.825 g/ml
Glyoxal OHCCHO Aldrich
Lot 00422KX
40% 58.04 1.253 g/ml
Methyl
1 Glyoxal
CH3COCHO Aldrich
Lot09615DY
40% 72.06 1.178 g/ml
2-methyl
1 valeraldehyde
C3H7CHCH3
CHO
Aldrich
Xot 02008LV
98% 100.16
0.808 g/ml 1
Decafluorobi
phenyl
C6F5C6F5 Aldrich
Lot 0992DX
99% 334.11 solid
Table 3.4 - Standards Used for Aldehyde Analysis
Method detection limits (MDLs) were calculated by Standard Method 1010 (APHA, AWWA, WEF, 1989), in which seven samples are taken, and the detection limit is defined as:
MDL = t(s)
where t = 3.143 (student t-value for 6 degrees of freedom and 99% confidence level)
s = standard deviation of seven replicate analyses
Method detection limits for this analysis were calculated at approximately 1-2 |J.g/L above background levels. Note that formaldehyde and acetaldehyde were found in the organic-pure water blanks, and were subtracted out as background from each sample.
All samples were collected in triplicate, and analyzed in triplicate. Any one of the triplicates was considered an outlier and eliminated if the relative area varied by more than 10% above or below the average of the three samples. A sample that met the criteria for elimination for any one of the four aldehydes was eliminated for all four of the
23
average, no points would be eliminated, and the average of the three would be used to
calculate the concentration.
3.7.2 Assimilable Organic Carbon
Assimilable Organic Carbon (AOC) concentration was determined by the method of van der Kooij, as described in Huck (1990) using PI7 and NOX strains. The analyses were performed by Dr. Eugene Rice of the U.S. Environmental Protection Agency in
Cincinnati, OH. The samples were collected in 1-liter glass-stoppered autoclaved bottles containing HgCl2 to kill any bacteria present in the sample. They were shipped in a cooler via overnight carrier to the USEPA laboratory.
The method of van der Kooij involves seeding a known culture of PI 7 cells with the water to be tested and recording the maximum number of colony-forming units (cfu) up to 20 days (Huck 1990). The resulting count is correlated to a known concentration of acetate needed to produce the same level of growth. Thus, one can express AOC as "micrograms of acetate-carbon equivalents per liter", or "^g acetate C eq/L". The same procedure is also performed with NOX cells using oxalate as the correlation compound. The results are fi-equently expressed as PI7 AOC and NOX AOC. It has also been found that the sum of these two numbers correlates well with the BDOC measurement (Rice,
personal communication), and thus some results are expressed as PI7 + NOX AOC. For ozonated samples, the NOX AOC tends to exceed the P17 AOC by nearly an order of magnitude.
3.8 Other Analytes
Bromate was measured according to EPA Method 300.0 (Pfaff et al., 1989) using a Dionex Ion Chromatograph (Dionex Corp., Sunnyvale, CA).
Total Organic Carbon was measured using an Oceanographies International Model 700 TOC analyzer (Oceanographies International Corp., College Station, TX). The
instrument used a UV-persulfate method. Standard Method 53IOC (APHA, AWWA, WEF, 1989) to measure TOC concentration.
25
CHAPTER 4
RESULTS AND DISCUSSION
4.1 Raw water quality
Raw water quality characteristics for the bulk and model waters tested are shown in Table
4.1. Alkalinity and hardness were obtained from plant records for the date collected.
Bromide, TOC, and UV-254 were measured by others on the project team. TKN was
measured by the Orange Water and Sewer Authority (OWASA) in Chapel Hill. The TOC
concentrations varied from 3.1 mg/L as carbon for Colorado River water up to 17.4 mg/L
for water from Myrtle Beach, SC. Palm Beach County water had the highest bromide
level with 156 ng/L, and also had a high TKN concentration and alkalinity. Overall, the
alkalinity of the raw waters ranged from 21 mg/L to 256 mg/L as CaC03.
Source Date
Collected
TOC
(mg/L)
TKN
(mg/L)
Br-(Jtg/L)
UV-254
(cm-1)
pH ALKas
CaC03 (mg/L)
Hardness as
CaC03 (mg/L) Hackensack, NJ
[Oradell Reservoir
06/25/92 5.4 0.72 90 0.105 7.5 84 113
Palm Beach
County, FL
[Floridian Aquifer
08/04/92 14.4 1.38 156 0.378 7.1 256 278
Myrtle Beach, SC Intracoastal
jWaterway
05/23/92 17.4 0.50 45 0.647 6.8 21 33
Colorado River 9/1/93 3.1 0.24 n/a n/a 8.2 125
317 1
n/a -Not analyzed
Table 4.1- Raw Water Quality Characteristics
4.2 Bulk Water Ozonation 4.2.1 General Parameters
Ozonation of all waters were performed on a semi-batch basis using an air-fed ozone
generator. Ozonation of bulk waters, at a dose of 1 mg 03/mg C, decreased TOC
concentration and UV-254 absorbance. Pre- and post-ozonation data for the bulk waters
are shown in Table 4.2. TOC concentrations were decreased by 18-33% and UV-254
Sample 1 Location
Ozone Dose
TOC (mg/L) UV 254 (cm-1) pH Alkalinity
(mg/L) 1
(mg/L) INTT. FINAL INIT. FINAL INIT. FINAL INIT. FINAL
1 Hackensack 5.5 4.2 2.8 0.105 0.031 7.7 n/a n/a n/a 1
1 Palm Beach 14.3 13.8 11.3 0.378 0.126 8.0 8.2 190 245
1 Myrtle Beach 28.5 15.6 12.9 0.647 0.239 7.4 6.6 70
40 1
Note: Colorado River bulk water was not analyzed for ozonation by-products
n/a - not analyzed
Table 4.2 - Bulk Water Ozonation Results
4.2.2 Aldehyde Production
The bulk waters were ozonated at a 1:1 ozone-to-TOC ratio, and were analyzed for
aldehydes and AOC. The results for the four aldehydes measured (formaldehyde,
acetaldehyde, glyoxal, methyl glyoxal) are listed in Table 4.3 and displayed in Figure 4.1.
As was detailed earlier, this project measured the four aldehydes of greatest
concentration: formaldehyde, acetaldehyde, glyoxal, and methyl glyoxal. Of these four,
formaldehyde was consistently produced in excess of the other aldehydes. This
corroborates the findings of Weinberg et al, (1993); Krasner et al, (1993b), and other
researchers. In this study, formaldehyde accounted for approximately 60-85% of the four
aldehydes measured, by weight. If the concentrations are converted to ^M,
formaldehyde, because of its lower molecular weight, accounted for 80-90% of the four
aldehydes measured. Because formaldehyde concentration often drives the total aldehyde
concentration, a number of the comparisons to follow will focus only upon formaldehyde
formed, so as to simplify comparisons between various treatment and water quality
parameters.
As is shown in Table 4.3 and Figure 4.1, Myrtle Beach water produced significantly more
aldehydes than the other waters, producing 568 [ig/L of formaldehyde, as compared to 79
[ig/L for Palm Beach and 58 ng/L for Hackensack. Part of this is due to the fact that
Myrtle Beach water had the highest TOC concentration, and thus received the highest
ozone dose. The ozone dose applied to Myrtle Beach bulk water was even higher than the
desired 1:1 ozone-to-TOC ratio (28.5 mg/L of ozone). This could provide an explanation
27
A common method used for comparing waters of different TOC is to normalize the data
by reporting the amount of aldehydes produced per mg TOC. The results of this
calculation are shown in Table 4.4 and displayed in Figure 4.2.
Source Water
TOC
(mg/L)
Formaldehyde (Jig/L)
Acetaldehyde (Jig/L)
Glyoxal (fig/L)
Methyl Glyoxal
(^g/L)
1 Hackensack
4.2 58.4 8.7 15.6 17.41 Palm Beach
13.8 79.3 12.2 22.6 28.3Myrtle
1 Beach
15.6 567.6 28.8 166.454 1
Table 4.3 Bulk Water Aldehyde Formation, Ozone:TOC = 1 mg/mg.
Source Water
TOC
(mg/L)
Formaldehyde (^g/mgTOC)
Acetaldehyde (Hg/mgTOC)
Glyoxal (fig/mgTOC)
Methyl Glyoxal
(Hg/mgTOC)
1 Hackensack
4.2 13.9 2.1 3.74.1
1 Palm Beach
13.8 5.7 0.9 1.6 2.0Myrtle
1 Beach 15.6 36.4 1.8
10.7
3.5 1
Table 4.4 Normalized Bulk Water Aldehyde Formation, Ozone:TOC = 1 mg/mg.
Even when a comparison is made on this normalized basis. Myrtle Beach still produced
much more aldehydes than the other waters. Myrtle Beach produced 39.4 ng
formaldehyde/mg TOC, Hackensack produced 10.7 ^g formaldehyde/mg TOC, and Palm
Beach produced 4.5 |ig formaldehyde/mg TOC. Even if one takes into account the fact
that Myrtle Beach received a nearly a 2:1 ozone dose, the aldehyde formation is still
much higher than for the other waters. This shows that the bulk waters do not produce
similar amounts of aldehydes upon ozonation. The three waters are very different in
i
600 T
500
•-400
--300 -ͣ
ft
I
I 200
100
--B Formaldehyde
Acetaldehyde
ͣ
Glyoxal
H Methyl Glyoxal
Hackensack Palm Beach Myrtle Beach
Figure 4.1 Aldehyde Formation in Ozonated Bulk Waters
40 J
35 -ͣ
30
H Formaldehyde ^Acetaldehyde
ͣ
Glyoxal
H Methyl Glyoxal
Hackensack Palm Beach Myrtle Beach
Figure 4.2 Normalized Aldehyde Formation m Ozonated Bulk Waters
4.3 Model Water Ozonation
The objective of the model water treatment experiments was to keep the pH, alkalinity,
bromide and ammonia levels, and TOC concentration constant across all the waters tested.
29
aldehyde formation in different waters with different water quality characteristics. In
this way, only the specific characteristics of the organic extracts would be responsible for
variations in by-product formation. Analyses of the extracted organic material are
currently being performed to try to establish a link between the by-product formation
potential and various characteristics of the hydrophobic extracts. Some of the
characteristics being examined are elemental composition, and structural and functional
group features. These characteristics will be reported in later papers and reports.4.3.1 Comparison with Bulk Water Results
Aldehyde formation in ozonated model waters is shown in Table 4.5. Aldehyde
formation levels normalized for TOC are shown in Table 4.6. A comparison offormaldehyde formation in bulk and model waters (normalized for TOC) is shown in
Figure 4.3. For some locations, e.g. Myrtle Beach, the bulk water produced similar
concentrations of formaldehyde (on a |j,g per mg TOC basis) as the model water
containing the extract, while for other locations, e.g. Hackensack and Pahn Beach, the
model water containing the extract produced substantially higher levels of formaldehyde.
This is not surprising because Myrtle Beach had the highest percentage of hydrophobic
organics using the XAD-8 extraction method; 70% of the TOC was extracted by the
XAD-8 resin. Thus the organics in the Myrtle Beach model water more closely
approximate those in the bulk water than any of the other waters tested. However, it is
significant that the hydrophobic organic extracts in Palm Beach and Hackensack waters
appear to have a higher aldehyde formation potential than the hydrophilic organics.In the present study, the hydrophobic extracts from Palm Beach and Hackensack appear
to be responsible for all of the aldehyde formation m the bulk water. The formaldehyde
yield for each model water is more than twice the yield for the bulk water. Since the bulk
waters are each approximately 50% hydrophobic, this means that all of the formaldehyde
production can be accounted for by the hydrophobic material. A similar examination of
two waters by Andrews and Huck (1993) showed that XAD-8 extracts of two waters did
not account for more than half of the aldehyde formation in the bulk waters. This seems
to conflict with the results shown here.
While the levels of formaldehyde produced from bulk and extract waters were very
different, the ranking of the waters in terms of aldehyde formation potential was the same.
30
primarily in the nature of the organic material comprising the TOC. Of the extracts.
Myrtle Beach and Hackensack extract material produced roughly the same amount of
aldehydes, while Palm Beach extract produced significantly less. Of special note is
Colorado River extract. This extract produced a very large amount of aldehydes upon
ozonation, approximately 71 ng per mg TOC, nearly three times higher than all of the
other hydrophobic extracts. However, hydrophobic organics comprise only 15 % of
Colorado River water, so expected aldehyde formation in the bulk water should not be
nearly so high. Aldehydes were not measured in ozonated Colorado River bulk water.
1 Source of
Extract
TOC
mg/L
Ozone dose
mg/L
Formaldehyde fig/L
Acetaldehyde Glyoxal Hg/L
Methyl Glyoxal 1
fig/L
1 Hackensack 4.1 4.2 123.8 16.1 29.0 29.4
1 Palm Beach 3.9 3.9 58.8 9.0 15.1 18.8
1 Myrtle Beach 3.5 4.3 137.3 7.5 48.5 7.4
1 Colorado
1 River 4.8 3.9 337.8* 21.9 2.2
77.0 1
* result beyond calibration curve, extrapolated from nearest point.
Table 4.5 - Aldehyde Formation m Ozonated Model Waters
1 Source of
Extract
TOC
(mg/L)
Ozone
dose
(mg/L)
Formaldehyde
fig/mgTOC
Acetaldehyde fig/mgTOC
Glyoxal fig/mg TOC
Methyl Glyoxal 1
Hg/mg TOC
Hackensack 4.1 4.2 30.2 3.9 7.1 7.2
Palm Beach 3.9 3.9 15.1 2.3 3.9 4.8
Myrtle Beach 3.5 4.3 39.2 2.1 13.9 2.1
Colorado
1 River 4.8 3.9 70.4* 4.6 0.5
16.0 1
* result beyond calibration curve, extrapolated from nearest point.
31
o
o
H
s
50 Y
45 ͣͣ
40 ••
35
--30
25
20
15
70.9
I Bulk Water
i Extract Water
Hackensack Palm Beach Myrtle Beach Colorado R.
Figure 4.3 - Formaldehyde Yield in Ozonated Waters; Ozone:TOC = 1 mg/mg
4.3.2 Parametric Studies
The model water studies were designed to compare aldehyde production as a function of
different treatment and water quality parameters. The parameters explored were ozone
dose (expressed as ozone:TOC ratio on a mg 03/mg C basis), TOC concentration, pH,
alkalinity, and bromide concentration. The ozonated water from these parametric studies
was subsequently chlorinated and chloraminated to determine the impact of ozone on
halogenated by-product formation. The latter is the subject of another report (Smith,
1993).
4.3.2.1 Effect of Ozone:TOC Ratio
Model waters were reconstituted from hydrophobic extract material at 4 mg/L TOC, 100
mg/L alkalinity as CaC03, and pH 7.0. The model waters were then dosed at ozone:TOC
ratios of 0.5, 1.0, and 2.0. Results of these tests are shown for the four model waters in
Figures 4.4, 4.5, 4.6, and 4.7. Data from which the figures were constructed are presented
in Appendix B. The effect of increasing the ozone:TOC ratio from 0.5 to 1.0 was to
increase the production of aldehydes. Three of the waters, however, did not produce
higher aldehyde levels at the 2:1 ozone dose. This suggests the involvement of competing
reactions, or perhaps destruction of aldehydes by ozone, at these higher ozone doses.
32
production levels are very different for each of the extracts, with Colorado River extract
producing significantly more aldehydes than the other extracts. The four model waters are summarized on the same scale in Figure 4.8.
140 T
120 ͣͣ
i 100
-0
o 80 ͣ
-ͣa 60 ͣͣ
40 ͣ
-H Formaldehyde ^ Acetaldehyde
ͣ
Glyoxal
il Methyl Glyoxal
0.5 1
Ozone:TOC Ratio (mg 03/mg Q
Figure 4.4 Effect of Ozone:TOG Ratio on Aldehyde Formation
from Myrtle Beach Extract
i
60 T
50 ͣͣ
40 ͣ
-I 30 +
S 20
o
U
S Formaldehyde ^ Acetaldehyde
ͣ
Glyoxal
H Methyl Glyoxal
Ozone:TOC Ratio (mg 03/mg Q
33
200
180
160
-I-t 140
a.
120 ͣͣ
S 100 ͣ
-2 S
u
a o
W
Formaldehyde
^Acetaldehyde
ͣ
Glyoxal
13 Methyl Glyoxal
0.5 2 *^
Ozone:TOC Ratio (mg 03/mg Q
Figure 4.6. Effect of Ozone:TOC Ratio on Aldehyde Formation
from Hackensack Extract
350 T
300 ͣ
-250 ͣ
-200
•-i
a
o
ͣ
5 150 ͣͣ
g
u
a o 100 ͣ
-0.5
Ozone:TOC Ratio (mg 03/mg Q
B Formaldehyde
^Acetaldehyde
ͣ
Glyoxal
H Methyl Glyoxal
Figure 4.7 Effect of Ozone:TOC Ratio on Aldehyde Formation
i
350 T
300 •ͣ
B
•I 250
2
I 200
a o
U
0.5
ͣ
Colorado R.
- Myrtle Bekh
-A—Hackensack
-M— Palm Beach
3 100
Ozoiie:TOC Ratio (mg 03/mg Q
Figure 4.8 Effect of Ozone:TOC Ratio on Formaldehyde Formation
for All Four Extract Waters
4.3.2.2 Effect of TOC
The effect of TOC concentration on aldehyde formation was studied using only the
Myrtle Beach extract at pH 7.0 and 100 mg/L alkalinity. The results for aldehyde
production are shown in Figure 4.9. For a 1:1 ozone-to TOC ratio, a linear increase in
formaldehyde concentration occurred as TOC concentration was mcreased. Ozonation at
a TOC concentration of 2 mg/L produced 18 ug/L formaldehyde, whereas doubling the
TOC concentration to 4 mg/L doubled the formaldehyde production to 40 |ig/L
formaldehyde. Further increasing TOC to 8.0 mg/L once again roughly doubled the
formaldehyde production to 92 |ig/L. This effect was also seen with glyoxal and methyl
glyoxal. Acetaldehyde production also increased as TOC concentration was increased,
35
100
90
80
i 70
c
o
2
a
u
a
o
60
50
40
30
20
10
0
® Formaldehyde
^Acetaldehyde
ͣ
Glyoxal
i3 Methyl Glyoxal
TOC (mg/L as Q
Figure 4.9 Effect of TOC concentration on Aldehyde Formation from Myrtle Beach
Extract, Ozone:TOC = Img/mg.
Due to the linear effect of TOC concentration on aldehyde formation, the by-product formation can be normalized into a |ig yield of aldehydes per mg TOC, as is frequently
done in the literature. Results of these calculations were shown in Tables 4.4 and 4.6, and
Figures 4.2 and 4.3. However, while the relationship appears to be firm for the extracts in this study, other researchers have not observed a similar linear relationship.
Xiong et al. (1992) and Andrews (1993) both explored the effects of TOC concentration on waters reconstituted from fulvic acid extracts. Both found that the ug by-product/mg
TOC did not remain constant as the TOC increased. In fact, both saw a significant
decrease in the by-product yield at high concentrations. For example, Andrews found that
a 300% increase in TOC concentration caused only a 40% increase in aldehyde
concentration, a 65% decrease in the |ig aldehyde/mg TOC yield. Data from the present
study show a relatively uniform by-product yield. The TOC concentrations used in this study were low (2-8 mg/L) compared to the studies by Xiong et al. (5.5-15 mg/L) and Andrews (3-20 mg/L). Additionally, Andrews' work was conducted at a 3:1 ozone to TOC ratio. It has been speculated that high concentrations of organic material in water can act to quench ozone, thus inhibiting further reactions. Because of the differences in experimental conditions, however, the inhibitory effects that the other investigators
4.3.2.3 Effect of pH
Myrtle Beach model water at 4.0 mg/L TOC and 100 mg/L alkalinity was ozonated at a
1:1 ozone-to-TOC ratio at three pH values: 5.5, 7.0, and 8.5. The aldehyde results areshown in Figure 4.10. There was a clear decline in the amount of aldehydes produced at
higher pH. Formaldehyde production at pH 8.5 was one-half of the production at pH 5.5.
The other aldehydes showed a similar decline with pH, with the exception of
acetaldehyde, which was found at low levels at all pH values.
70 T
HFonnaldehyde
^Acetaldehyde
ͣ
Glyoxal
H Methyl Glyoxal g 40
9 20
Ozonation pH
Figure 4.10 Effect of Ozonation pH on Aldehyde Formation - Myrtle Beach Extract
There was some concern about the methods employed for this set of experiments.Because of the semi-batch nature of the experiments, the ozonations at low pH took
significantly longer than the ozonations at high pH. Ozone is much more stable in acidic
solutions and, as a result, in the semi-batch ozonations, there was slower transfer from the
gas to the liquid phase under acidic conditions. The net result of this was that ozonations
at pH 5.5 took approximately twice as long to achieve the desired dose as did the
ozonations at pH 8.5.
To test whether this difference in ozonation time was important, another set of
experiments was conducted on a batch basis, where ozone from a prepared stock solution
was added to the model Myrtle Beach waters at various pH values. Because these
37
essentially instantaneous. The results for both the batch and semi-batch experiments are
shown in Figure 4.11. Once again, elevated pH tended to produce less formaldehyde.
Interestingly, if one compares the batch and semi-batch data, the batch data produces
lower levels of formaldehyde in all cases. The other aldehydes showed similar trends.
i
70 T
60 ͣͣ
•I 50
g 40
e
o
u
% 20 30 ͣ
-10 •ͣ o
to
1
Semi-Batcht m
^Batch
m
ͣ
n
+ m
-[•
ͣ
J---1---—1---1---—1---1—---1---1---1
5.5 6.5 7 7.5
Ozonation pH
8.5
Figure 4.11 Effect of Ozonation pH on Formaldehyde Formation: Comparison of Batch
and Semi-Batch Experunents for Myrtle Beach Extract.
This pH effect has also been observed by other researchers. Andrews (1993) found that
increasing the ozonation pH from 6 to 8 resulted in approximately 15-20% less aldehyde
formation in reconstituted fulvic acid solutions. Andrews also observed this effect, but to
a smaller degree, in ozonations of bulk waters.
Decreased aldehyde production at high pH may indicate that the dnect reaction of ozone
is more likely to form aldehydes than the indirect (radical) pathway. This corresponds
with work by Hureiki et al. (1993) who found that when ozonating amino acids,
aldehydes were preferentially formed by the direct molecular reaction. An alternative
explanation would be that some of the aldehydes produced were subsequently destroyed
via the hydroxyl radical pathway, which is more prevalent at higher pH. Aldehydes are
known to degrade in the presence of hydroxyl radicals and their rates have been measured
conclusions can be made as to the reasons for decreased aldehyde production at higher
pH. Future work may help to explain these results.4.3.2.4. Effect of Alkalinity
The alkalinity was varied from 20-100 mg/L as CaC03 (0.4-2.0 mM NaHCOs) at pH 7.0
to explore its effect on aldehyde production. Since bicarbonate and carbonate are known
scavengers of hydroxyl radicals, it was suspected that if aldehydes are formed (or
destroyed) by a hydroxyl radical process, changing the alkalinity may have an effect on
aldehyde concentration. Myrtle Beach model water at 4 mg/L TOC was ozonated at a 1:1
ozone-to-TOC ratio. The results of these tests are shown in Figure 4.12. There was no
observed effect of alkalinity on aldehyde formation at these levels.
H Formaldehyde SAcetaldehyde
ͣ
Glyoxal
d Methyl Glyoxal
40 ͣ
-20 ͣͣ
20 50
Alkalnity (mg/L as CaC03)
100
Figure 4.12 Effect of Alkalinity on Aldehyde Formation for Myrtle Beach Extract
Andrews (1993) performed similar experiments on reconstituted XAD-8 extract solutions
and found a slight decrease in aldehyde formation at 200 mg/L alkalinity, compared to a 0
mg/L alkalinity case. The levels were, on average, approximately 10% lower for the high
alkalinity case.
4.3.2.5 Effect of Bromide
' «r--"'-gS'gM'!|jfe-f:
39
reaction that would tie up any HOBr produced from the ozonation of Br'. This would thereby prevent further reactions of bromide and ozone. The model water was
reconstituted to 4 mg/L TOC, 100 mg/L alkalinity, pH 7.0, and was ozonated at a 1:1 ozone-to-TOC ratio. The results are shown in Figure 4.13. The variations in bromide
concentration had no effect on the aldehydes formed. It was assumed that ozone would
preferentially react with the bromide in the water, thus diminishing the formation of aldehydes, but this was not the case. Aldehyde formation did not change appreciably at
the different bromide levels, and (as will be shown later) little bromate was formed.
i
o
u
c
e
50 T
H Formaldehyde @ Acetaldehyde
ͣ
Glyoxal
H Methyl Glyoxal
50 250 250 + 1 mg/L
NHS
Bromide Added (jigfL)
Figure 4.13 Effect of Bromide on Aldehyde Formation - Myrtle Beach Extract
4.4 Assimilable Organic Carbon Results
Most samples analyzed for aldehydes were also analyzed for assimilable organic carbon
(AOC). This is due to the concern for biodegradation and biological regrowth following
useful surrogate for the more complex and time-consuming AOC analysis. Of particular
note is that the regression for Hackensack is quite different than the regression lines for
Myrtle Beach and Palm Beach, both of which are very similar.
Sample Formaldehyde lig/L
P17 AOC
fig C-eq/L
NOX AOC
fig C-eq/L
P17+NOXAOC 1
fig C-eq/L
MBXOO DDL 19 283 302
MBX0.5 31.8 120 1052 1172
MBXOl 137.3 154 3655 3809
MBX02 123.3 76 2759 2835
HXOO 9.4 258 372 630
HX0.5 40.2 244 569 813
HXOl 123.8 237 1379 1616
HX02 185.6 463 1931 2394
PBXOO 3.1 83 172 255
PBX0.5 12.6 98 372 470
PBXOl 58.8 105 1793 1898
PBX02 56.7 80 1414
1494 1
BDL = Below Detection Limit
Table 4.7 Selected Values for Formaldehyde and AOC Production. MBX = Myrtle
Beach Extract; HX = Hackensack Extract; PBX = Palm Beach Extract.
200 y
i 180
ͣ
-I 160 -.
•uͣ§ 140 ͣͣ
120
100
•-80 ͣͣ
60 ͣͣ
40 ͣͣ
20 ͣ
-0
e
ii u
e
o
U
u
•9
O)
"3
o
Hackensack
R-sqr = 0.989
e Beach
Palm Beach
R-sqr = 0.968
---1---1-1500 2000 2500
AOC (jig C-eq/L)
4000
..'. .^ -: ͣ 41
Other researchers have also investigated the use of chemical surrogates for regrowth measurements. Xie and Reckhow (1992) found that ketoacid concentration provided a good correlation to AOC for a single water. Amy et al. (1992) mvestigated the use of
aldehydes as a surrogate for BDOC, but did not fmd a good correlation.
4.5 Bromate
Bromate is a known ozonation by-product that forms in waters containing bromide ion. The bulk waters studied contained low levels of bromide ion, with the exception of Palm
Beach, and some extract studies were conducted in which bromide was added. Brornate was only found at significant levels during the ozonation of Palm Beach bulk water,
where 78 |xg/L was formed. All other ozonations of bulk and model waters resulted in bromate levels below the detection limit (<10 |ig/L), including the extract water studies where bromide was added at levels up to 250 |xg/L. The most likely reason that bromate
did not form is due to the conditions of ozonation. It has been shown that bromate is
more likely to form when an ozone residual in the system persists (Krasner et al., 1991a). For the present study, the semi-batch nature of the ozonation meant that there was rarely, if ever, an ozone residual in the reactor. This lack of residual probably explains why little bromate was observed in the ozonated waters, even when 250 \igfL of bromide was added