by Vickie Brown November 23, 2005
A Master's paper submitted to the faculty of the University of North Carolina at Chapel Hill in partial fulfillment of the requirements for the degree of Master of Public Health in
Abstract Purpose
This paper examines the evolving policy of publicly reported hospital infection rates as an indicator of provider quality.
Policy
The purpose of health care provider quality report cards is to provide consumers and large purchaser groups with information regarding the quality of patient care.
.
Policy makers believe that publicly reporting quality indicators will improve thej--delivery of care, reduce medical errors, decrease costs, improve patient outcomes, and allow consumers informed choice. Recently, hospital infection rates have been identified as an important indicator of quality that should be included in the healthcare provider quality report card. As of November 2005 twelve states have passed legislation related to the public reporting of hospital infection rates. This legislative action has taken place in the absence of an infection surveillance and reporting system that allows for accurate and reliable comparisons of individual
L
hospitals within states and across regions. Current surveillance systems that areLiterature review
A search of the scientific literature found no publications in peer-reviewed journals that demonstrate the effects of publicly released hospital infection rates
on individual consumer choice, large healthcare purchaser groups, provider market share, and provider performance. However, the effect of healthcare provider report cards has been studied. This review found these report cards have had very little influence on the healthcare market and provider selection and may
actually have unforeseen, negative consequences such as increasing health +-- 4---disparities. They have been shown to increase quality improvement activities,
especially in low-scoring hospitals. Conclusion
Despite the lack of evidence that publicly reported hospital infection rates will improve health outcomes or, in general, that healthcare report cards have improved patient outcomes, the movement to publicly release hospital infection rates has proceeded. It is imperative that further legislative action be delayed
L
The rising cost ofhealthcare in the U.S. and the consumer's assumption of a greater share of their healthcare costs have driven policy makers, purchasers, and providers to identify methods for assessing the quality of care and providing this information to the consumer. The health care provider quality report card is based upon the assumption that publicly reporting measures ofhealthcare processes and outcomes will serve as an incentive for providers to improve the delivery of care as well as assist the consumer in choosing their provider. Increased quality should lead to a reduction of medical errors, reduce costs, and ultimately improve patient outcomes. Recently, consumers have sought to obtain information about hospital infection rates as another measure of the quality of care. Consumers feel they have a right to know this information and employers who pay for healthcare plans seek to use the information for their purchasing decisions. This evolving public policy is strongly supported by large consumer and healthcare organizations as well as politicians in all levels of government.
Key Stakeholders Consumers Union
The Consumers Union's (CU) featured campaign, Stop Hospital Infections. aims to help consumers find the best quality of care by publicly
to the public reporting of hospital infection rates with many based on the CU
model (CU, 2005). As ofNovember 2005, seven states require infection rates to
be reported.
Association for Professionals in Infection Control and Epidemiology
The Association for Professionals in Infection Control and Epidemiology
(API C) supports the use of infection data to improve infection prevention
programs in healthcare facilities but recognizes that there currently is no
standardized surveillance system to compare infection data among hospitals
(APIC, 2005). APIC convened a consensus conference in February 2005 to bring
together key stakeholders and is working towards establishing national standards
.for infection reporting through a partnership with the National Quality Forum.
National Quality Fontm
The National Quality Forum (NQF), a public-private partnership that
includes government, healthcare, consumer, and employer organizations, has as
its mission to improve American healthcare through endorsement of
consensus-based national standards for measurement and public reporting ofhealthcare
performance data (NQF, 2005). This positions NQF to lead the development of
national performance measurements for hospital infection rates.
Society for Healthcare Epidemiology of America
The Society for Healthcare Epidemiology of America (SHEA) advocates
for reporting systems to select as indicators existing outcome measures such as
surgical wound infections and device-related infections (i.e., central
catheter-associated bloodstream infection and ventilator-catheter-associated pneumonia) that
f.-incorporate some risk -adjustment. However, SHEA states that there is currently no widely agreed upon, scientifically validated method for risk adjustment of hospital-acquired infection indicators (Wong, Rupp, Menne!, Perl, Bradley, Ramsey eta!., 2005).
Healthcare Infection Control Practices Advisory Committee
The Centers for Disease Control and Prevention's (CDC) Healthcare Infection Control Practices Advisory Committee (HICP AC) believes there is
insufficient evidence on the merits and limitations of a hospital-acquired
t-infections reporting system and therefore HICP AC neither recommends for oragainst mandatory public reporting of infection rates. HICP AC recommends that reporting systems incorporate both process and outcome measures and that the outcome measures are risk-adjusted(McKibben, Horan, Tokars, Fowler, Carda, Pearson, et a!., 2005).
American Hospital Association
Centers for Medicare and Medicaid Services
The Centers for Medicare and Medicaid Services (CMS), the largest payer ofhealthcare in America, supports the use of publicly released quality indicators. CMS is collaborating with the Agency for Healthcare Research and Quality (AHRQ), AHA, NQF, the Consumer-Purchaser Disclosure Group, and other national organizations to collect and report quality measures. This consortium of national organizations, referred to as the Hospital Quality Alliance, currently
collects and reports infection prevention process data. Outcome measures such as i---hospital infection rates are under consideration (CMS, 2005).
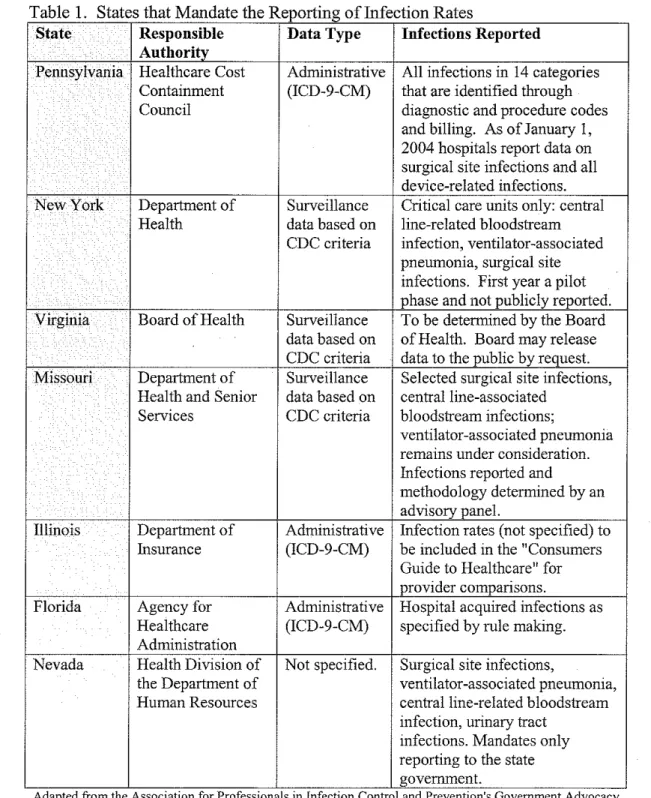
Current Legislation States Legislatures
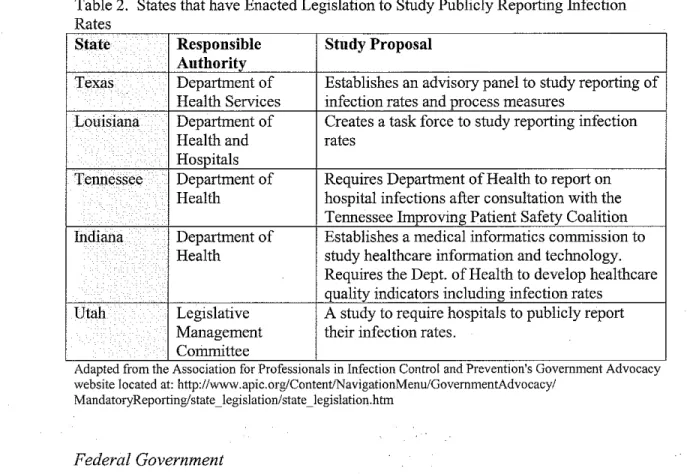
reported and data sources. Table 2 represents those states that have enacted bills
to conduct a study to determine the feasibility, costs, risks, and benefits of the
public reporting of hospital infections but do not mandate reporting.
Table I States that Mandate the Reporting of Infection Rates
State Responsible Data Type Infections Reported
Authority
Pennsylvania Healthcare Cost Administrative All infections in 14 categories Containment (ICD-9-CM) that are identified through
Council diagnostic and procedure codes
and billing. As ofJanuary 1, 2004 hospitals report data on surgical site infections and all device-related infections. New York Department of Surveillance Critical care units only: central
Health data based on line-related bloodstream CDC criteria infection, ventilator-associated
pneumonia, surgical site
I infections. First year a pilot phase and not publicly reported. Virginia Board of Health Surveillance To be determined by the Board
data based on of Health. Board may release CDC criteria data to the public by request. Missouri Department of Surveillance Selected surgical site infections,
Health and Senior data based on central line-associated Services CDC criteria bloodstream infections;
ventilator-associated pneumonia remains under consideration. Infections reported and
methodology determined by an advisory panel.
Illinois Department of Administrative Infection rates (not specified) to Insurance (ICD-9-CM) be included in the "Consumers
Guide to Healthcare" for provider comparisons.
Florida Agency for Administrative Hospital acquired infections as Health care (ICD-9-CM) specified by rule making. Administration
Nevada Health Division of Not specified. Surgical site infections,
the Department of ventilator-associated pneumonia, Human Resources central line-related bloodstream
infection, urinary tract infections. Mandates only reporting to the state government.
Adapted from the Association for Professwnals m InfectiOn Control and Preventmn s Government Advocacy
website located at: http://www.apic.org/Content/NavigationMenu/GovernmentAdvocacy/
MandatoryReporting/state _legislation/state _legislation.htm
Table 2. States that have Enacted Legislation to Study Publicly Reporting fufection Rates
State Responsible Stndy Proposal
Authority
Texas Department of Establishes an advisory panel to study reporting of Health Services infection rates and process measures
Louisiana Department of Creates a task force to study reporting infection Health and rates
Hospitals
Tennessee Department of Requires Department of Health to report on . Health hospital infections after consultation with the
Tennessee Improving Patient Safety Coalition fudiana Department of Establishes a medical informatics commission to
Health study healthcare information and technology. Requires the Dept. of Health to develop healthcare quality indicators including infection rates
Utah Legislative A study to require hospitals to publicly report Management their infection rates.
Committee
'
Adapted from the Assocmtwn for Professionals m InfectiOn Control and PreventiOns Government Advocacy website located at: http://www.apic.org/Content/NavigationMenu/GovemmentAdvocacy/
MandatoryReporting/ state _legislation/ state _I egislation.htm
Federal Government
While states have been quick to act upon mandating the reporting of
hospital-acquired infections, the federal government has been relatively slow.
Currently, federal activity is limited to a House Committee on Energy and
Commerce investigation. To date, the investigation has consisted of expert
interviews and a recent survey sent to nine large U.S. hospitals regarding
surveillance and reporting of hospital-acquired infections.
Hospital-acquired Infections as an fudicator of Quality
For a measure to be considered an indicator ofhealthcare provider quality,
it should be evidence-based and linked to improved patient outcomes. The
potential use of hospital-acquired infections as quality indicators has been
investigated. The Quality fudicator Study Group (1995), a collaboration of
commonly reported infections; pneumonia, urinary tract infection, surgical site infection, and bacteremia on several factors important for selecting indicator events. The investigators reviewed the existing literature for quality indicators and conducted expert interviews to determine how best to evaluate indicators. Using a scale of 1 + (least favorable) to 4+ (most favorable), they rated each type of infection on clarity of case definition, ease of specimen collection, ease of surveillance, impact on morbidity and mortality, potential for interventions to reduce rates, ease of stratification, and availability of denominator by devices. Only urinary tract and bacteremia were given a 4+ for clarity of case definition, an extremely important factor when selecting indicators. When rated for importance of the event on morbidity and mortality, urinary tract infection received only a 2+ and I+, respectively, while bacteremia received a 4+ for both outcomes. If the goal of a good indicator is to improve patient outcomes,
bacteremia may be the best infection-related quality indicator. Wenzel and Edmond (2001) estimated that hospital-acquired bacteremias rank within the fourth to thirteen cause of death in the United States.
Sedman et a!. (2005) investigated the patient safety indicators (PSI) developed by the Agency for Healthcare Research and Quality when applied to the National Association of Children's Hospitals and Related Institutions
Issues in Surveillance Methodology
The difficulty in providing meaningful hospital-acquired infection data is reflected in the current patchwork of state laws. As can be seen, some states use administrative data derived from mortality, morbidity, procedural, and billing codes while other states rely upon data collected by trained infection control professionals who review medical records using case definitions developed by the CDC. Policy makers need to recognize both the merits and the limitations of surveillance systems when developing a methodology for reporting of hospital infection rates.
Administrative data
underreported among diskectomy patients with the weighted sensitivity, specificity, and positive and negative predictive values for reported conditions being 35%, 98%, 82%, and 84%, respectively. The weighted sensitivity was variable depending upon the complication with only reoperation,
bacteremia/sepsis, postoperative infection, and deep vein thrombosis reported with at least 60% sensitivity. Results showed that hospitals that would have been publicly labeled as having more complications than expected, reported
complications twice as thoroughly as hospitals that would have been labeled as having fewer complications than expected.
Wright, Huskins, Dokholyan, Goldmann, and Platt (2003) assessed the use of administrative databases to conduct surveillance for long-term central venous catheter (CVC) infections. Using a retrospective cohort design, the study
population consisted of all members of a health maintenance organization and two teaching hospitals in Boston. Claims databases were searched for 10 Current Procedural Terminology (CPT) codes, 2 ICD-9-CM codes, and internal charge codes indicating central venous catheter insertion. Lists were compared with each other and with medical records for correlation and accuracy. The results showed wide variation in the eve insertions identified in each database and they
concluded that current administrative databases are not sufficient to be used for electronic surveillance of eve-associated complications.
NNISSystem
hospital-acquired infections. Using CDC-designated definitions of infection, trained infection control professionals manually review patient records and determine the presence or absence of a hospital-acquired infection. Participation in NNIS is limited to hospitals with 100 or more beds that have at least 1 full-time equivalent (FTE) infection control professional for the first 100 occupied beds and 1 FTE for each additional250 beds (Richards, 2001). Approximately 300 U.S. hospitals submit their infection data to the CDC who then pools the data and provides device-associated infection rates (i.e., central venous catheter, ventilator, urinary catheter) that incorporates risk adjustment based upon type ofiCU and device days. Selected surgical procedure rates are also provided that are risk-adjusted (NNIS, 2004). l'.'NIS data do not represent a true cohort study population and participating hospitals are not randomly selected.
A validation study of the application ofNNIS definitions for infection was conducted by Emori, Edwards, and Culver (1998) using patients in the intensive care units of nine NNIS hospitals. Phase one ofthe study compared the results of chart review for hospital-acquired infections conducted by trained external data collectors to the case findings ofthe local infection control professionals. In phase two, a sample of discrepant reported infections was reviewed by CDC epidemiologists. The researchers found that for bloodstream infection, pneumonia, surgical-site infection, urinary tract infection, and other sites, the
'
NNIS infection rates have been used for benchmarking by individual provider hospitals and for research purposes. It has provided a structure for infection surveillance that reduces the incidence of hospital-acquired infections (CDC, 2000). Infection surveillance with feedback to clinicians is an essential component of infection prevention programs that has been shown to reduce hospital-acquired infections by 32% (Haley, Culver, White, Morgan, Emori, et a!., 1985).
Laboratory-based Surveillance L
Laboratory-based surveillance systems are used to identify those patients most likely to have a hospital-acquired infection. In lieu of reviewing all patient medical records, only the medical records of patients who have a positive
laboratory culture are retrospectively reviewed to determine if the patient had a hospital-acquired infection. In a study by Laxson, Blaser, and Parkhurst (1984) a randomized retrospective review of 575 medical-surgical patient charts revealed 70 hospital-acquired infections in 41 patients. Review of microbiology records
L
indicated positive cultures for 71% of the patients with hospital-acquired infections. In addition, a random selection of I 00 positive cultures was
surveillance in identifying hospital-acquired infection (Blake, Cheatle, Mack, 1980).
Data Mining
Recently, some hospitals have transitioned from using administrative databases or traditional chart review by trained infection control professionals to the use of electronic data mining. Data mining uses computer technology to integrate laboratory and patient profiles to identify infections and detect infection trends. Preliminary evidence has demonstrated the effectiveness of a data mining program in the early detection and control of infection outbreaks, (Church,
Woodruff, 2004), (Halloran, 2003), (Gustafson, Gray, 2005), (Church, 2005). In a study conducted in 2 neonatal intensive care units to evaluate the use of computerized surveillance to detect hospital-acquired pneumonia, the computer-based surveillance system had a sensitivity of71 %, specificity 99.8%, positive predictive value 7.9%, and a negative predictive value of>99% (Haas, Mendonca, Ross, Friedmann, Larson, 2005).
The Effects of Publicly Reported Healthcare Quality Indicators
Effect on Patient Outcomes
The first venture into publicly releasing hospital specific outcome data was the Healthcare Financing Administration's (HCFA) 1987 release of hospital mortality rates. When Berwick and Wald (1990) surveyed a national sample of 195 hospitals to determine their reactions to the H CF A release of mortality rates, they found that all respondents shared a negative view of the accuracy, usefulness, and interpretability of the mortality data. Only 31% of respondents reported using the data for internal purposes and 20% reported that the data release had caused problems for the hospital.
ln 1990, the New York Department of Health was ordered by the courts to release surgeon and hospital specific data on CABG mortality to Newsday. A review of the first five years experience byChassin, Hannan, and DeBuono (1996), found that there was no movement of patients away from hospitals with high mortality rates or movement of patients to hospitals with low mortality rates.
They also did not find any evidence of physicians avoiding surgery on high-risk
L
.
patients in order to keep their mortality rates low. After the first three years, therewas a 41% decline in risk-adjusted CABG operative mortality. Chassin et al. (1996) also reported that low-volume, high mortality surgeons either voluntarily stopped performing CABG surgery or had their hospital privileges restricted.
decline, 35% in 1992 and 42% in 1994 (both relative to 1990), in mortality despite the absence of a statewide outcome-reporting program.
From 1991 through 1999, a voluntary partnership ofbusinesses, hospitals, and physicians was formed in Cleveland. Called the Cleveland Health Quality Choice (CHQC), their objective was to institute a "healthcare market reform program that would reliably and objectively measure and compare outcomes and patient satisfaction", (Baker, Einstadter, Thomas, Husak, Gordon, Cebul, 2002). Baker et a!. stated that the CHQC received national attention because of its rigorous methodology for data collection, analysis, and reporting. CHQC publicly released risk-adjusted in-hospital mortality rates for six medical
conditions: acute myocardial infarction, congestive heart failure, gastrointestinal hemorrhage, chronic obstructive pulmonary disease, pneumonia, and strok<:. These reports were published in the main local newspaper and made available in pharmacies and over the Internet. While this program was operational, a dramatic decline of in-hospital mortality was observed. However, when Baker eta!.
examined mortality trends for 1991-1997 using risk-adjusted in-hospital mortality and early post-discharge mortality (between discharge and 30 days after
admission), they found that deaths shifted from in-hospital to the period
Market Share
One possible effect ofhealthcare report cards is a shift in market share to the providers with the best scores. Baker et al. (2003) examined the Cleveland experiment to determine ifpublicly reporting quality data affected market share. In this study they reviewed hospitals' market share and risk-adjusted mortality from 1991-1997 for hospitals participating in CHQC. CHQC identified several hospitals with consistently higher than expected mortality. The five hospitals
with the highest mortality tended to lose market share (mean change -0.6%, 95% !---CI -1.9-0.6) but this change was not significant. They also found that the only
high-mortality hospital with a large decline in market share had a declining volume for 2 years before being identified in the report. They found no evidence · that hospitals identified as high-mortality hospitals lost significant market share or
· that hospitals with better than expected mortality gained market share. The authors stated that their findings suggested that purchasers did not use the information from CHQC for selective contracting and did not create financial incentives for their employees to use hospitals with the best performance. The authors note that the CHQC report was complex which may have limited its use and that given the emergent characteristics of the conditions monitored, patients may have had little or no choice but to go to the nearest hospital.
Romano and Zhou (2004) studied all patients admitted to nonfederal hospitals designated as outside the normal range in reports for CABG mortality in New York, acute myocardial infarction mortality in California, and
volume shifts were modest and transient with any statistically significant change attributed to the report card disappearing within 3 months of release of the data. This study also demonstrated that patient volume changes might be limited to relatively advantaged populations (white, other races excluding Blacks and Hispanics) and those with Medicare coverage.
Mukarnel and Mushlin (1998) analyzed market share in New York State after publication ofthe cardiac surgery mortality report. They found that
hospitals and physicians whose patients had better outcomes experienced higher rates of growth in market share, however, the association tended to decline over time.
Hibbard, Stockard, and Tusler (2005) found no significant changes in market share in their investigation of the impact of a hospital safety public report card for twenty-four Wisconsin hospitals.
Avoidance of High-Risk Patients
disease, congestive heart failure, and previous PCI. Patients in New York were slightly older and had a higher frequency of hypertension. Unadjusted, in-hospital mortality rates for New York was significantly lower than in Michigan (0.83% vs. 1.54%, p < 0.0001). However, after adjustment for comorbidities, there were no significant differences in in-hospital mortality rates between the two groups. The authors proposed that the differences in case mix could be explained by physicians in New York not intervening on higher-risk patients out of fear of increasing their publicly reported mortality rates.
Additional evidence of physicians potentially avoiding high-risk patients is provided in a study conducted by Narins, Dozier, Ling, and Zareba (2005). In a survey of 186 interventiona1 cardiologists practicing in New York (120
respondents, 65% response rate), 79% agreed or strongly agreed that publication of mortality statistics had influenced their decision regarding whether to perform angioplasty on individual patients. Among respondents, 83% agreed or strongly agreed that patients who might benefit from angioplasty may not receive the procedure as a result of the public reporting of physician-specific mortality rates.
The role of health provider report cards and health disparities has been studied. Werner, Asch, and Polsky (2005), investigated the impact of New York's CABG report card on racial and ethnic disparities in cardiac care. Citing research that demonstrated physicians perceive racial and ethnic minorities as less likely to
L
21
not providing CABG surgery for patients with acute myocardial infarction.
Before the report card's release in New York, white patients received CABG more often than black patients (3.6% vs. 0.9%) but not Hispanic patients (2.9%). After release of the report card, the difference in CABG use between whites, blacks, and Hispanics increased (8%, 3%, 4.8% respectively). After adjustment for trends in comparison states, racial and ethnic disparities in CABG use increased by 2.0 percentage points (95% CI 0.7- 3.4, p = 0.006) in white versus black
patients and by 3.4 percentage points (95% CI 0.8- 5.9, p = 0.01) in white versus
Hispanic patients. It took nine years for disparities in New York to return to the levels they were at before the report card was released.
Use by Employers
One of the most frequently cited reasons for public reporting ofhealthcare quality is to assist employers with their healthcare benefits purchasing decisions. It is assumed that businesses will use the information and their purchasing power will improve healthcare quality through competition. Hibbard, Jewett, Legnini, and Tulser (1997) investigated how large purchasers use performance measures and what type of performance information they use. Selecting four regions of the U.S. where data were available, California, New York State, Pennsylvania, and the Cleveland metropolitan area, they examined large employers use of clinical outcomes data from hospitals, Health Plan Employer Data and Information Set (HEDIS) health plan reports, and consumer satisfaction data. Thirty three
purchaser representatives were interviewed who were together responsible for 1.8 million covered lives. The researchers found that an average of 78% of
'
t-L
i-l
b
i
purchasers were aware ofHEDIS data and 75% reported that consumer satisfaction data were available. For hospitals outcomes data, purchaser
awareness ranged from 25% to 71%. Among those who reported that HEDIS data were available to them, 54% reported using HEDIS for choosing a plan. Of the HEDIS users, 85% also used consumer satisfaction data. The results for hospital outcomes data were not as positive. Of those who were aware of the data, only 25% said they used the information. Some of the reasons given for not using the hospital outcomes data were concerns about the measurement methodology and whether the data are timely and valid, some expected the managed care plans to monitor hospital quality, and the information was not packaged for their needs. Consumer satisfaction was listed as the most influential measure in their decision-making.
Longo (2004) surveyed 154 Boone County, Missouri businesses regarding their use ofhealthcare consumer reports. This study found that the majority of employers indicated that the healthcare provider report card would not have a direct effect on their healthcare purchasing decisions, however they felt the reports were worthwhile. They also indicated that they preferred consumer reports that compared local healthcare institutions rather than needing to review national averages to locate the information.
Use by Consumers
I
,---Perhaps the most frequently stated reason for performance report cards is to assist the individual consumer in selecting their healthcare provider.
report cards. Schneider and Epstein (1998) surveyed 474 (70%) of 673 eligible patients who had undergone CABG surgery during the previous year at one of four hospitals listed in the Pennsylvania Consumer Guide to CABG. They found that only 12% of patients knew of the report and less than 1% knew the correct rating of their surgeon or hospital and reported that it had a moderate or major impact on their selection of provider.
Marshall, Shekelle, Leatherman, and Brook (2000) summarized the empirical evidence concerning public disclosure of performance data to identify the potential gains and areas needing further research. Their study was limited to reporting systems in the U.S. and to peer reviewed articles published between January 1986 and October 1999. Of21 totalpublications identified, seven provided evidence regarding the use of performance data by consumers. Only one study (Mukamel, Mushlin, 1998) suggested that public disclosure had an effect on consumer decision-making by changes in market share.
Hibbard, Stockard, and Tusler (2005) studied the impact of the Wisconsin
L
hospital performance report card, QualityCounts, a report card that was designedfor easy consumer use and disseminated widely in the community. They found that only 4% of consumers who were exposed to the report card immediately after its release used it to recommend or choose a hospital and only 10% reported having done so in the next two years.
Additional evidence that individual consumers generally do not use
designed by the Kaiser Foundation and the Agency for Healthcare Policy and Research (Robinson, Brody, 1997). The survey found that consumers value quality but quality indicators are likely to be only one of several factors considered in their decision-making. Of those surveyed, 39% reported seeing quality information comparing health plans and of those, only about one-third said they used the information to make decisions. Other sources used by consumers to make healthcare choices included their family, friends, and physicians.
Effects on Hospital Quality Improvement Efforts
There is evidence that healthcare provider quality report cards increase hospitals quality improvement efforts. Williams, Schmaltz, Morton, Koss, Loeb (2005) examined U.S. hospitals' performance on 18 quality indicators for acute myocardial infarction, heart failure, and pneumonia that were reported to the Joint Commission on Accreditation ofHealthcare Organizations (JCAHO). JCAHO provides public access to hospitals performance scores via Quality Check, an Internet report card. This study's findings revealed a significant improvement in the performance of hospitals over a 2-yearperiod for 15 of 18 measures and no measure showed a significant deterioration.
'
consisted of 46 hospitals that received no report. The researchers found that when the hospitals were assessed for quality improvement activities specific to the areas included in the reports, the public-report hospitals reported a significantly higher number of quality improvement activities than did the private-report and the no-report. Low-scoring public-report hospitals showed the highest level of quality improvement activities. In a follow-up study, Hibbard, Stockard, Tulsler (2005) assessed the hospitals' performance scores two years following the release of QualityCounts. They found that among hospitals with low scores in obstetric care at the baseline period, those that had their performance publicly reported were significantly more likely to have improved their scores than those in the private report and no report groups.
all the conditions than did for-profit hospitals, and there were significant regional differences in scores for all three conditions, with the Midwest and Northeast outperforming the West and South. There was no consistent association between performance and the size of the hospital except for pneumonia with the smallest hospitals having the highest scores. They also found that a high quality score for acute myocardial infarction closely predicted a high quality of care for congestive heart failure but not for pneumonia. The authors concluded that these data do not provide support for "good" hospitals being easy to identify or consistent in their performance across conditions and that evaluations of hospitals performance will most likely need to be based on a large number of conditions.
k-Conclusions and Recommendations
In order to provide the public with meaningful information and to protect hospitals from misrepresentation, policy makers should refrain from any
additional legislative activity until the development of a dependable hospital-acquired infection surveillance and reporting system. The current state by state reporting systems for hospital-acquired infections will lead only to confuse and misguide the consumer, a much greater disservice than no reporting system at all. An infection surveillance and reporting system must incorporate national
performance standards that provide data collection and risk adjustment
adjustment of patient characteristics. Additional research is needed to determine the cost effectiveness, sensitivity, and specificity of computer-based systems and their role in the public reporting of hospital-acquired infection rates for provider comparisons. In addition, further research is needed to determine if publicly reported infection rates could possibly lead to patients at high-risk of infection-related complications not being offered medical interventions as was
demonstrated in the studies by Moscucci eta! (2005) and Narins et al (2005). Risk factors for infection such as diabetes and immune deficiency are well recognized so the potential for such unintended, negative consequences exist.
socio-economics are significant determinants of provider choice, regardless of the performance indicator or grade of the provider.
References
Association for Professionals in Infection Control and Epidemiology. (2005). Government Advocacy. Retrieved October 5, 2005 from
http://www.apic.org/Content/N avigationMenu/GovernmentAdvocacy/Man datoryReporting/ Abouttheissue/ about_ the_ issue.htm
Baker, D.W., Einstader, D., Thomas, C.L., Husak, S.S., Gordon, N.H., Cebul, R.D. (2002). Mortality trends during a program that publicly reported hospital performance. Medical Care, 40, 879-890.
Baker, D.W., Einstader, D., Thomas, C.L., Husak, S.S., Gordon, N.H., Cebul, R.D. (2003). The effect of publicly reporting hospital performance on market share and risk-adjusted mortality at high-mortality hospitals. Medical Care, 41,729-740.
Berwick, D.M., Wald, D.L. (1990). Hospital leaders' opinions of the HCFA mortality data. The Journal of the American Medical Association, 263, 247-249.
Centers for Disease Control and Prevention, (2000). Monitoring hospital-acquired infections to promote patient safety--United States, 1990-1999.
AfAfhVR,49, 149-153.
Centers for Medicare and Medicaid Services (2005). Hospital Quality Initiative. Retrieved September 5, 2005 from
http://www.cms.hhs.gov/quality/hospitall
Chassin, M.R., Hannan, E.,L., DeBuono, B.A. (1996). Benefits and hazards of reporting medical outcomes publicly. The New England Journal of ·
Afedicine, 334, 394-398.
Church, N., (2005). Cluster of coagulase negative staph associated with central line care in ICU. Poster session presented at the annual meeting of the Association for Professionals in Infection Control and Epidemiology. June. Baltimore, Maryland.
Church, N., Woodruff, E., (2004). Investigation of a cluster of community-acquired MRSA in Portland, Oregon: possible genetic similarity and risk factor for transmission. Poster session presented at the annual meeting of the Society for Healthcare Epidemiology of America. April. Philadelphia, Pennsylvania.
.,---
t-l
Consumers Union (2005). Stop Hospital Infections.org. Retrieved October 2, 2005 from
http://cu.convio.net/site/PageServer?pagename=SHI_petitionyourhospital &JServSessionidrO 12=cu5kmnax 11.app7 a
Emori, T.G., Edwards, J.R., Culver, D.H., eta!. (1998) Accuracy of reporting nosocomial infections in intensive care unit patients to the national nosocomial infections surveillance system: a pilot study. Infection Control and Hospital Epidemiology. 19, 308-316.
Foster, N., Vice-President of the American Hospital Association, (2005).
Mandatory public reporting: Will the public benefit. Presented February 7, 2005 at the Mandatory Public Reporting Consensus Conference. Atlanta, Georgia.
Ghali, W.A., Ash, A.S., Hall, R.E., Moskowitz, M.A. (1997) Statewide quality improvement initiatives and mortality after cardiac surgery. The Journal of the American Medical Association, 277, 379-382.
Haley, R.W., Culver, D.H., White, J.W., Morgan, W.M., Emori, T.G., Munn, V.P., Hooton, T.M. (1985). The efficacy of infection surveillance and control programs in preventing nosocomial infections in US hospitals. American Journal of Epidemiology, 121, 182-205.
Hallohran, J. (2003). Rapid mitigation of pseudomonas aeruginosa outbreak identified by data mining surveillance. Poster session presented at the annual meeting of the Association for Professionals in Infection Control and Epidemiology. June. San Antonio, Texas.
Hass, J.P., Mendonca, E.A., Ross, B., Friedman, C., Larson, E. (2005). Use of computerized surveillance to detect nosocomial pneumonia in neonatal intensive care unit patients. American Journal of Infection Control, 33, 439-443.
Hibbard, J.H., Harris-Kojetin, L., Mullin, J., Lubalin, J.L., Garfinkel, S. (2000). Increasing the impact of health plan report cards by addressing consumers' concerns. Health Affairs, 19, 138-143.
Hibbard, J., Stockard, J., Tusler, M. (2005). Hospital performance reports: Impact on quality, market share, and reputation. Datawatch, July/August, 1150-1160.
Hibbard, J.H., Stockard, J., Tusler, M. (2003). Does publicizing hospital performance stimulate quality improvement efforts? Health Affairs, 22, 84-94.
Institute of Medicine (1999). To err is human: Building a safer health system. Retrieved October 5, 2005 from http://www.iom.edu/file.asp?id=4117.
Jha, A.K., Zhonghe, L., Orav, E.J., Epstein, A.M. (2005). Care in U.S. hospitals-the quality alliance program. The New England Journal of Medicine, 353, 265-274.
Laxon, L.B., Blaser, M.J., Parkhurst, S.M. (1984). Surveillance for the detection of nosocomial infections and the potential for nosocomial outbreaks. I. Microbiology culture surveillance is an effective method for detecting nosocomial infection. American Journal of Infection Control, 12,318-324.
Marshall, M., Shekelle, P., Leatherman, S., Brook, R. (2000). The public release
of performance data: What do we expect to gain? A review of the
evidence. Journal of the American Medical Association, 283, 1866-187 4.
McKibben, L., Horan, T., Tokars, J.I., Fowler, G., Cardo, D.M., Pearson, M. L.,
Brennan, P.J., and the Healthcare Infection Control Practices Advisory
Committee (2005). Guidance on public reporting of hospital-acquired
infections: Recommendations of the Healthcare Infection Control
Practices Advisory Committee. American Journal of Infection Control, 33, 217-226.
Moscussi, M., Eagle, K.A., Share, D., Smith, D., De Franco, A. C., O'Domlell, M.,
et a!. (2005). Public reporting and case selection for percutaneous
coronary interventions: An analysis from two large multicenter
percutaneous coronary intervention databases. Journal of the American College of Cardiology, 45, 1759-1765.
Mukamel, D., Mushlin, A. (1998). Quality of care information makes a
difference: An analysis of market share and price changes after publication
Narins, C.R., Dozier, A.M., Ling, F.S., Zareba, W. (2005). The influence of public reporting of outcome data on medical decision making by physicians. Archives of Internal Medicine, 165, 83-87.
National Quality Forum (2005). About the National Quality Forum. Retrieved October 2, 2005 from http://www.qualityforum.org/aboutlhome.htm.
NNIS (2004). National Nosocomial Infections Surveillance (NNIS) System Report, data summary from January 1992 through June 2004, issued October 2004. American Journal of Infection Control, 32,470-485.
Richards, C., Emori, T., Edwards, J., Fridkin, S., Tolson, J., Gaynes, R., The National Nosocomial Infections Surveillance (NNIS) System (2001). American Journal of Infection Control, 29, 400-403.
Robinson, S, Brodie, M. (1997). Understanding the quality challenge for health consumers: the Kaiser/AHCPR Survey. Joint Commission Journal of Quality Improvement, 23, 239-244.
Romano, P.S., Zhou, H. (2004). Do well publicized risk-adjusted outcomes
reports affect hospital volume? Medical Care, 42, 367-377.
Schauffler, H., Mordavsky, J. (2001 ). Consumer reports in health care: Do they
make a difference? Annual Review of Public Health, 22, 69-89.
Schneider, E.C., Epstein, A.M. (1998). Use of public performance reports: A
survey of patients undergoing cardiac surgery. The Journal of the American Medical Association, 279, 1638-1642.
Sedman, A., Harris II, M., Schulz, K., Schwalenstocker, E., Remus, D., Scanlon,
M., Rahl, V. (2005). Relevance of the Agency for Healthcare Research
and Quality safety indicators for children's hospitals. Pediatrics, 115, 135-145.
The Quality Indicator Study Group (1995). An approach to the evaluation of
quality indicators of the outcome of care in hospitalized patients, with a
focus on nosocomial infection indicators. Infection Control and Hospital Epidemiology, 16, 308-316.
Wenzel, R.P., Edmond, M.B. (2001). The impact of hospital-acquired
bloodstream infections. Emerging Infectious Diseases, 7, 174-177.
h
Werner, R.M., Asch, D.A., Polsky, D. (2005). The unintended consequences of coronary artery bypass graft report cards. Circulation, Ill, 1257-1263.
Williams, S., Schmaltz, S., Morton, D., Koss, R., Loeb, J., (2005). Quality of care in U.S. hospitals as reflected by standardized measures, 2002-2004. The New England Journal of Medicine, 353, 255-264.
Wong, E.S., Rupp, M.E., Mermel, L., Perl, T.M., Bradley, S., Ramsey, K.M., Ostrowsky, B., Valenti, A.J., Jernigan, J.A., Voss, A., Tapper, M.L. (2005). Public disclosure of hospital-acquired infections: The role of the Society for Healthcare Epidemiology of America. Infection Control and Hospital Epidemiology, 26, 210-212.