1 Obesity-Associated Chemotherapy Resistance in Triple-Negative Breast Cancer:
The Role of Leptin-Induced Tumor-Initiating Cell Enrichment
Joseph Gung
Honors Thesis Department of Nutrition
Gillings School of Global Public Health University of North Carolina at Chapel Hill
Approved by:
___________________________________ Dr. Stephen D. Hursting (Advisor)
2 Abstract
Background
Leptin, a protein hormone produced by adipose tissue, is a known regulator of satiety and is also associated with inflammation, cell proliferation and differentiation. Excess adiposity, in cases of obesity, is associated with increased leptin levels, an increase in the expression of
tumor-initiating cell (TIC) associated genes, as well as worse outcomes for triple-negative breast cancer (TNBC). In this study we characterize the impact of obesity-associated leptin signaling on TIC enrichment as well as determine the role of leptin on signaling on obesity-associated
chemotherapy resistance.
Methods
The in vitro effects of leptin on TIC enrichment were examined by mammosphere formation assay. Met-M-Wnt cells treated with vehicle (sterile H2O) or leptin for 7 days, and the number of mammospheres was quantified. Leptin receptor, Lepr, expression in the E-Wnt, Met-M-Wnt, and MDA-MB-231 cell lines after leptin treatment was determined by quantitative RT-PCR. The role that leptin signaling has in any significant phenotypic differences between control and DIO conditions was investigated using stable knockdown of Lepr in the Met-M-Wnt cells using shRNA. Cell viability in E-Wnt, Met-M-Wnt, and MDA-MB-231 cells in response to docetaxel was assessed using MTT assays to define chemo-sensitivity. To investigate the effects of in vivo leptin signaling on chemotherapy resistance, both E-Wnt cells with Lepr knockdown and
scrambled shRNA transfected cells (Ewnt-L and Ewnt-S) were transplanted into the mammary fat pads of C57BL/6 mice. The mice were randomized to a control (10% kcal from fat) or diet-induced obesity (DIO, 60% kcal from fat) diet for 15 weeks and were further randomized to vehicle (saline) or docetaxel (20 mg/kg/week x 3 doses) treatment groups. Tumor growth rates and final tumor volume were determined.
Results
Increased leptin treatment significantly increased mammosphere formation in Met-M-Wnt cells (P<0.05) but not leptin receptor expression in these cells or E-Wnt or MDA-MB-231 cells. Stable Lepr shRNA transfection in the Met-M-Wnt cells significantly reduced Lepr expression (P<0.001). In the in vivo study, tumor growth rate in EWnt-L, but not EWnt-S tumors, was significantly reduced in DIO mice after docetaxel treatment (P<0.05). Growth rate in both tumors was significantly decreased with docetaxel treatment in the control mice (P<0.05).
Conclusions
3 Table of Contents
1. Introduction 5
a. Breast Cancer Prevalence and Significance 5
b. Impact of Obesity and TNBC 5
c. Breast Tumor-Initiating Cells and Obesity 6
d. Leptin and TIC Link 7
2. Goal and Hypotheses 8
3. Methods 9
a. Cell Lines 9
b. Mammosphere Assays 9
c. Leptin Effect on Lepr Expression 9
d. Met-M-Wnt Leptin Receptor Knockdown 10
e. Characterization of Docetaxel Response 10
f. Animal Study 10
g. Statistical Analysis 11
4. Results 12
a. Aim 1 12
i. Mammosphere Assay 12
ii. Leptin Receptor Expression 13
iii. shRNA Lepr Knockdowns 16
iv. Knockdown Twist2 Expression 16
b. Aim 2 17
i. Docetaxel Response 17
ii. E-Wnt Docetaxel Response with DIO Serum 18
iii. Animal Study 19
1. Tumor Growth Rate 19
2. Final Tumor Volume 21
5. Discussion 22
6. Conclusion 25
7. Future Directions 26
4 Acknowledgements
I would like to thank Dr. Stephen Hursting for the opportunity to conduct the research necessary to complete this thesis in a welcoming and productive laboratory. I would also like to thank Dr. Laura W. Bowers for her guidance and patience as a mentor because this project would not have
5 Introduction
Breast Cancer Prevalence and Significance
Breast cancer is the most prevalent form of cancer for females and in 2014, there was an estimated 3,327,552 women living with breast cancer in the United States. According to the National Cancer Institute (NCI) in 2017, an estimated 40,610 deaths were attributed to breast cancer [1]. The NCI estimates that one in eight women born in the United States will develop breast cancer [1], and millions of breast cancer patients may be adversely impacted by the effects of some form of the disease. Furthermore, 15-25% of breast cancers are found to be
triple-negative breast cancer (TNBC) which is a subtype of tumors that tests triple-negative for estrogen receptors (ER-), progesterone receptors (PR-), and HER (HER2-) [2]. The highly aggressive nature and metastatic properties of TNBC coupled with the few treatment options outside of traditional chemotherapy correlates with a higher mortality rate than other subtypes of breast cancer [3].
Impacts of Obesity and TNBC
Obesity is currently a significant global health problem and more than 35% of Americans are categorized as obese with a body mass index (BMI) of ≥30 kg/m2 [4, 5]. Obesity is
6 disease outcome in patients that received neoadjuvant cytotoxic chemotherapy, including taxanes and anthracyclines [10]. These findings suggest that obesity may promote resistance to multiple types of chemotherapy via a common mechanism. Consequently, it is important that we improve our understanding of the mechanism(s) mediating the obesity-chemotherapy resistance link, with a particular focus on TNBC, as the treatment options for this highly aggressive breast cancer subtype are limited to cytotoxic chemotherapies.
Breast Tumor-Initiating Cells and Obesity
One factor that is thought to promote chemotherapy resistance is an enrichment in the tumor-initiating cell (TIC) population. TICs are a subpopulation of cancer cells located within a tumor with stem cell-like properties, including the capacity for self-renewal and multipotent differentiation. According to the TIC model, these cells are the primary drivers of chemotherapy resistance, and this hypothesis has been supported in breast cancer patients by associations between TIC enrichment and poor patient prognosis [11]. Therefore, an improved understanding of how obesity-induced TIC enrichment affects chemotherapy response in obese TNBC patients may inform the development of a more effective treatment regimen for these patients.
7 Leptin and TIC Link
Leptin is a hormone produced by adipocytes that is primarily known as a regulator of satiety. However, it is also produced by breast cancer cells and regulates inflammation, cell differentiation, and proliferation. Leptin therefore may mediate obesity-induced breast cancer progression through multiple mechanisms [13]. Excess adiposity in obese patients is correlated with increased leptin levels. Obesity has also been linked to a worse prognosis for all subtypes of breast cancer, including the highly aggressive TNBC subtype. Leptin signaling may contribute to this link, as obesity has been shown to promote tumor growth and TIC enrichment in
transplanted tumors, but only when leptin signaling is present [14]. Increased levels of systemic leptin and tumor leptin and leptin receptor expression have been associated with worse breast cancer prognosis [15-18]. It has been shown that silencing the leptin receptor in MDA-MB-231, a human breast cancer cell line, reduced the metastatic properties of the tumor cells by exhibiting a mesenchymal-to-epithelial transition [19]. Therefore, it is likely that leptin is a key contributor to obesity-associated chemotherapy resistance in TNBC via its promotion of TIC enrichment.
Using in vitro models of basal-like and claudin-low breast cancer along with an orthotopic transplant mouse model of basal-like breast cancer, we tested the hypothesis that increased leptin signaling mediates obesity-associated TNBC development by promoting TIC enrichment.
8 Goal and Hypothesis
The primary goal of the current study was to determine whether obesity-associated leptin signaling contributes to chemotherapy resistance in TNBC via TIC enrichment. This was
accomplished through two separate specific aims.
The first aim was to characterize the impact obesity-associated leptin signaling on TIC enrichment in TNBC in vitro using two murine (E-Wnt and Met-M-Wnt) and one human (MDA-MB-231) breast cancer cell line. We hypothesized that obesity-associated leptin signaling will enhance markers of TIC enrichment and leptin receptor expression in these cell lines.
The second aim was to determine the role played by leptin signaling in obesity-associated chemotherapy resistance. This aim was addressed via in vitro characterization of the E-Wnt, Met-M-Wnt, and MDA-MB-231 cells’ response to docetaxel as well as an animal study
9 Methods
Cell Lines
Two triple-negative mouse mammary tumor cell lines isolated from the MMTV-Wnt-1 mouse model, E-Wnt (basal-like) and Met-M-Wnt (metastatic, claudin-low), along with human MDA-MB-231 (claudin-low) breast cancer cells were used in the in vitro studies. The cell lines were maintained in RPMI 1640 media (GIBCO LifeTechnologies) supplemented with 10% fetal bovine serum, 10mM HEPES buffer, and 2 mM L-glutamine (complete media). All experiments wereperformed on cells maintained at <30 passages and within 10 passages of cell lineremoval from liquid nitrogen storage.
Mammosphere Assays
Met-M-Wnt cells were plated for mammosphere assays at a density of 1 x 10⁴ cells/well in ultra-low attachment 6-well plates. Cells were treated with vehicle (sterile H2O) or leptin (100, 200, and 400 ng/mL) for 7 days. The number of mammospheres was quantified at the end of the treatment period using an EVOS FL Auto 2 Cell Imaging System (Invitrogen).
Leptin Effect on E-Wnt, Met-M-Wnt, and MDA-MB-231 Lepr Expression
10 triplicate by quantitative RT-PCR on a ViiATM7 RT-PCR (Applied Biosystems) to determine relative expression of the leptin receptor.
Met-M-Wnt Leptin Receptor Knockdown
Lepr shRNA or scrambled shRNA plasmids (Santa Cruz Biotechnologies) were transfected into Met-M-Wnt cells using FuGENE 6 (Promega) to generate stable leptin receptor knockdown and control Met-M-Wnt cell lines. Total RNA was isolated from cell lines using the process
described above and quantitative RT-PCR was used to determine relative expression of Lepr. Two stably transfected lines (ObR-3 and ObR-8) were selected based on relative expression of leptin receptor to the cells transfected with the scrambled plasmid (Con-5). The parental Met-M-Wnt line used to generate these 3 lines was also utilized for comparison in the in vitro
experiments.
Characterization of E-Wnt, Met-M-Wnt, MDA-MB-231 Docetaxel Response
Following a 48-hr treatment with vehicle (EtOH) or docetaxel (doses: 50 nM, 100nM, 500 nM, 1 M, and 2 M), cell viability in E-Wnt, Met-M-Wnt, and MDA-MB-231 cells was assessed using
MTT assays to define chemo-sensitivity and determine optimal docetaxel dose and treatment time for each cell line.
Animal Study
11 (EWnt-S, 9th mammary fat pad) and E-Wnt cells stably transfected with a Lepr shRNA plasmid (EWnt-L, 4th mammary fat pad), both generated previously for a prior study [20]. The mice in each diet group were further randomized to vehicle (saline) or docetaxel (20 mg/kg/week x 3 doses) treatment groups. Each mouse was started on injections when it had at least 1 tumor of 200 mm3. Each mouse was euthanized when it had at least 1 tumor of >1.5 cm diameter. Following euthanasia, tumor diameters in each of 3 dimensions (D1, D2 and D3) were measured ex vivo with digital calipers. The ellipsoid equation was used to determine volume: 1/6(D1 x D2 x D3). Growth rate was calculated by subtracting the estimated tumor volume at the start of injections (estimated using the 2 dimensions measured at last palpation: 1/6(D1 x D2 x D2), where D2 is the smaller dimension) from final tumor volume and dividing this difference by the number of days between the first injection and euthanization: (Final tumor volume – Tumor volume at injection start)/Number of days
Statistical Analysis
12 Results
Aim 1
Mammosphere Assay Counts
The in vitro effect of leptin (100, 200, and 400 ng/mL, final concentrations) on mammary TIC enrichment was examined in the mouse triple-negative mammary tumor cell line (Met-M-Wnt) by assessing mammosphere formation. Leptin, compared with vehicle, increased Met-M-Wnt cell mammosphere formation significantly at 200 ng/mL (P<0.05) and non-significantly at the 400 ng/mL dose (Figure 1). Our lab previously found that increased leptin dose similarly increased the number of mammospheres in murine (E-Wnt) and human (MDA-MB-231) triple-negative mammary tumor cell lines. Furthermore, silencing Lepr expression via shRNA in E-Wnt cells significantly reduced mammosphere count, which suggests that leptin signaling mediates mammosphere formation in this cell line [20].
13 Leptin Receptor Expression
Leptin treatment did not significantly change leptin receptor expression across all triple-negative mammary tumor cell lines assessed: E-Wnt, Met-M-Wnt, and MDA-231 (Figures 2-4).
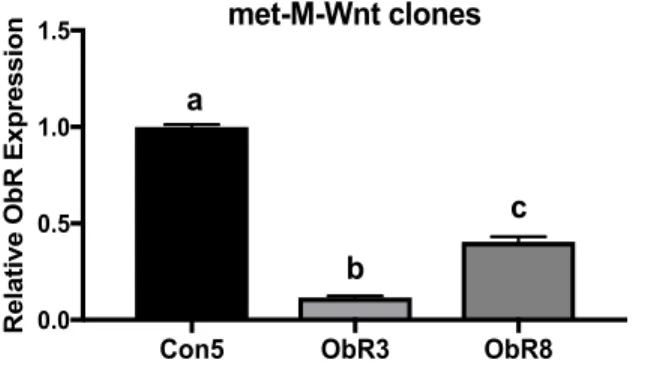
16 shRNA Lepr Silenced Knockdowns
Lepr expression was measured in two stably transfected Lepr knockdown Met-M-Wnt lines (ObR3 and ObR8) relative to Met-M-Wnt cells stably transfected with a scrambled shRNA plasmid (Con5). Lepr expression in ObR3 and ObR8 was significantly reduced to 0.118±0.0124 and 0.406±0.0442, respectively, relative to the Con5 cells (P<0.0001).
Figure 5. Met-M-Wnt relative Lepr (ObR) expression following Lepr knockdown by shRNA.
No significant decrease was observed in met-M-Wnt Twist2 expression with Lepr knockdown, though it was reduced in ObR3 cells by approximately 50% relative to Con5 (Figure 6). No significant differences between Met-M-Wnt clones were noted in expression of other TIC/EMT-associated genes measured: Akt3, Foxc2, Sox2, and Vim (data not shown).
Con5 ObR3 ObR8
0.0 0.5 1.0
1.5 met-M-Wnt clones
18 Aim 2
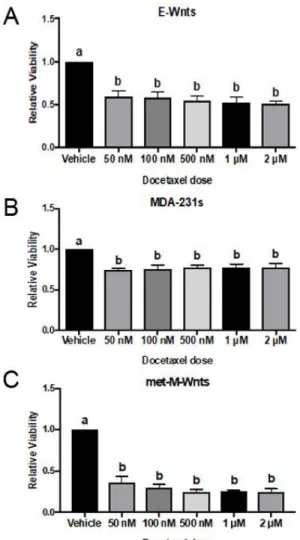
Docetaxel Response
A significant decrease in cell viability was observed for a 50 nM dose of docetaxel in all cell lines assessed. Larger doses of docetaxel do not significantly reduce cell viability further in these cells (Figure 7).
19 E-Wnt Docetaxel Response with DIO Serum
To examine the association between leptin signaling and docetaxel response in vitro, the E-Wnt cell line was exposed to serum from DIO or control mice that was collected as part of a previous study [20]. There was a significant difference between the DIO and control serum-treated cells in response to docetaxel at both the 50 nM and 500 nM doses (P<0.05; Figure 8). However, since DIO serum contains other obesity-associated factors, a causal relationship cannot be established between leptin and docetaxel response from this data.
20 E-Wnt Animal Data
Our laboratory previously generated leptin receptor knockdown E-Wnt cells using shRNA to silence LepR expression. Knockdown for EWnt-L2 was determined to be 0.376 relative to the EWnt cells transfected with a scrambled shRNA sequence (EWnt-S) (P<0.001; Figure 9).
Figure 9. Lepr expression in E-Wnt shRNA Lepr knockdown cells
Tumor Growth Rate
To establish the relationship between leptin signaling and chemotherapy resistance, 1 stably transfected Lepr knockdown E-Wnt cell line (EWnt-L2 designated EWnt-L during transplantation) and the E-Wnt cell line stably transfected with scrambled plasmid (EWnt-S) were injected into the 4th and 9th mammary fat pads, respectively, and docetaxel treatment started in each mouse when 1 tumor 200 mm3. Body weight of the DIO mice was significantly greater than controls during weeks 2-14 on diet (data not shown).
21 increase in systemic leptin (P<0.05; Figure 10B). These findings suggest that leptin signaling mediates obesity-induced docetaxel resistance in the E-Wnt cell line.
Figure 10. Tumor growth rate in (A) DIO and (B) Control mice following the start of vehicle or docetaxel injections.
Final Tumor Volume
In the DIO mice, there was no significant difference in the EWnt-S or EWnt-L final tumor
23 Discussion
Despite the well-established association between obesity and overall worse outcomes for TNBC, the mechanisms that mediate this link are not fully known. These findings suggest that a leptin-dependent mechanism(s) could lead to increased tumor growth and chemotherapy resistance, possibly via TIC enrichment. Specifically, we report that (a) mammosphere counts increased as leptin dose increased for the Met-M-Wnt cell line, (b) leptin exposure does not increase leptin receptor expression in two murine triple-negative cell lines (E-Wnt and Met-M-Wnt) and 1 human line (MDA-MB-231) in vitro, (c) Lepr knockdown in Met-M-Wnt cells resulted in no significant differences in TIC-related gene expression, though Twist2 was non-significantly decreased, (d) leptin signaling is a key mediator for obesity-associated docetaxel resistance in the E-Wnt model of TNBC.
Chang et al. demonstrated that leptin induces an EMT phenotype, mammosphere formation, and Lepr expression in pre-clinical models of normal breast epithelial cells (MCF12A) and luminal A breast cancer (MCF7) [21]. Our laboratory previously demonstrated that leptin treatment increases mammosphere formation in E-Wnt cells, while mammosphere formation is reduced in Lepr silenced E-Wnt cells [20]. Klopp et al. found that mesenchymal TIC, which are known to support tumor growth, increases the formation of mammospheres [22]. Therefore, to evaluate the in vitro TIC enrichment of leptin, we used a mammosphere assay for the Met-M-Wnt cell line treated with leptin. There was a significant increase in mammosphere count with increased leptin dose (Figure 1), which may be attributable to TIC-enrichment by leptin. In our results, however, leptin did not appear to have a significant effect on Lepr expression in both the basal-like (E-Wnt) cell line and the claudin-low cell lines (Met-M-Wnt and MDA-MB-231).
24 tumors is enhanced in obese db/db mice, which have a significant elevation in systemic leptin due to a Lepr gene mutation. However, growth of transplanted mammary tumors is reduced in the genetically obese ob/ob mice, which lack Lep gene expression [14]. These findings suggest that leptin signaling may contribute to obesity’s pro-tumor effects on TNBC. Our findings showed that silencing the expression of the leptin receptor gene Lepr in E-Wnt mammary tumor cells increased the effectiveness of docetaxel treatment in DIO mice. Since other researchers have established that elevated systemic leptin levels and tumor Lep and Lepr expression are associated with worse breast cancer prognosis [15-18], it is highly probable that leptin signaling is a key contributor to obesity-associated chemotherapy resistance in TNBC via TIC enrichment.
For the in vitro part of the study, the relationship between TIC-enrichment and leptin was determined by assessment of mammosphere formation following leptin treatment. In a previous study from our laboratory [20], and here in Figure 8, the obesity micro-environment was modeled in vitro using serum collected from DIO and control mice, which allowed for other cytokines besides leptin to exert an effect. However, this technique could not be used for the mammosphere assays because mammosphere formation is inhibited by serum exposure. Consequently, there may be other contributing factors to obesity-induced mammosphere formation that also need to be explored. Furthermore, we are not able to conclude that the observed effects will apply to all forms of TNBC because TNBC is a heterogenous disease that encompasses multiple distinct molecular subtypes.
25 by others to be implicated in leptin’s pro-TIC enriching effects [21]. Therefore, future experiments would need to be conducted to illuminate the pathway(s) that mediates the effects we found.
26 Conclusion
Our findings suggest that leptin signaling may promote TIC enrichment in metastatic claudin-low breast cancer but does not upregulate leptin receptor expression in TNBC. In addition, obesity-associated leptin signaling promotes docetaxel resistance in a model of basal-like breast cancer. These findings suggest that further research regarding the role of leptin-induced TIC enrichment in obesity-associated TNBC progression is warranted, as greater understanding of the pathways mediating these effects may lead to the identification of new targets for intervention.
Future Directions
27 References
1. Cancer Stat Facts: Female Breast Cancer. Female Breast Cancer - Cancer Stat Facts Available at: https://seer.cancer.gov/statfacts/html/breast.html. (Accessed: 9th April 2018) 2. Hudis, C. A. & Gianni, L. Triple-Negative Breast Cancer: An Unmet Medical Need. The
Oncologist 16, 1–11 (2011).
3. Millikan RC, Newman B, Tse CK, Moorman PG, Conway K, Dressler LG, et al. Epidemiology of basal-like breast cancer. Breast Cancer Res Treat. 2008; 109:123-39. 4. Overweight & Obesity Statistics. National Institute of Diabetes and Digestive and Kidney
Diseases (2017). Available at: https://www.niddk.nih.gov/health-information/health-statistics/overweight-obesity. (Accessed: 9th April 2018)
5. Flegal KM, Carroll MD, Kit BK, Ogden CL. Prevalence of obesity and trends in the distribution of body mass index among US adults, 1999-2010. JAMA. 2012; 307:491-7. 6. Protani M, Coory M, Martin JH. Effect of obesity on survival of women with breast cancer:
systematic review and meta-analysis. Breast Cancer Res Treat. 2010; 123:627-35.
7. Litton JK, Gonzalez-Angulo AM, Warneke CL, Buzdar AU, Kau SW, Bondy M, et al. Relationship between obesity and pathologic response to neoadjuvant chemotherapy among women with operable breast cancer. J Clin Oncol. 2008; 26:4072-7.
8. Calle EE, Rodriguez C, Walker-Thurmond K, Thun MJ. Overweight, obesity and mortality from cancer in a prospectively studied cohort of U.S. adults. N Engl J Med. 2003;3 48:1625-38.
28 10.Chen S, Chen CM, Zhou Y, Zhou RJ, Yu KD, Shao ZM. Obesity or overweight is associated with worse pathological response to neoadjuvant chemotherapy among Chinese women with breast cancer. PLoS One. 2012; 7:e41380.
11.Wei W, Lewis MT. Identifying and targeting tumor-initiating cells in the treatment of breast cancer. Endocr Relat Cancer. 2015; 22:R135-55.
12.Dunlap SM, Chiao LJ, Nogueira L, Usary J, Perou CM, Varticovski L, et al. Dietary energy balance modulates epithelial-to-mesenchymal transition and tumor progression in murine claudin-low and basal-like mammary tumor models. Cancer Prev Res. 2012; 5:930-42.
13.Ando S, Barone I, Giordano C, Bonofiglio D, Catalano S. The multifaceted mechanism of leptin signaling within tumor microenvironment in driving breast cancer growth and progression. Front Oncol. 2014; 4:340.
14.Zheng Q, Dunlap SM, Zhu J, Downs-Kelly E, Rich JN, Hursting SD, et al. Leptin deficiency suppresses MMTV-Wnt-1 mammary tumor growth in obese mice and abrogates tumor initiating cell survival. Endocr Relat Cancer. 2011; 18:491-503.
15.Goodwin PJ, Ennis M, Pritchard KI, Trudeau ME, Koo J, Taylor SK, et al. Insulin- and obesity-related variables in early-stage breast cancer: correlations and time course of prognostic associations. J Clin Oncol. 2012; 30:164-171
16.Ishikawa M, Kitayama J, Nagawa H. Enhanced expression of leptin and leptin receptor (OB-R) in human breast cancer. Clin Cancer Res. 2004; 10:4325-31.
17.Garofalo C, Koda M, Cascio S, Sulkowska M, Kanczuga-Koda L, Golaszewska J, et al. Increased expression of leptin and the leptin receptor as a marker of breast cancer
29 18.Miyoshi Y, Funahashi T, Tanaka S, Taguchi T, Tamaki Y, Shimomura I, et al. High
expression of leptin receptor mRNA in breast cancer tissue predicts poor prognosis for patients with high, but not low, leptin levels. Int J Cancer. 2006; 118:1414-9.
19.Zheng Q, Banaszak L, Fracci S, Basali D, Dunlap SM, Hursting SD, et al. Leptin receptor maintains cancer stem-like properties in triple negative breast cancer cells. Endocr Relat Cancer. 2013; 20:797-808.
20.Bowers, L. W. et al. Leptin Signaling Mediates Obesity-Associated CSC Enrichment and EMT in Preclinical TNBC Models. Molecular Cancer Research (2018). doi:10.1158/1541-7786.mcr-17-0508
21.Chang CC, Wu MJ, Yang JY, Camarillo IG, Chang CJ. Leptin-STAT3-G9a Signaling Promotes Obesity-Mediated Breast Cancer Progression. Cancer Res. 2015;75(11):2375-86.