Growth
in
the
Southeast:
Trends
and
Choices
Population
and
economic growth
in the Southeastern United States over the last decade hasgenerated large-scale land
consumption
and
exacerbated traffic congestion, according to thisarticle. Airpollution has risen, affecting
human
healthand
nearbyforest ecosystems.Water
quality
and
quantity has declined,and
the region is losing atremendous
amount
ofbiodiversityand
habitat.The
articlereviews thefiscaland
economic
costsofsprawl, as well asits'impactson
equity within
urban
areas.Throughout
the region, voters are demonstrating their support forsmart
growth
and
community
livability measures.The
article laterreviews opportunitiesfor landuse
and
transportation reform in the Southeast, as well as barriers thatprevent the adoption ofmore
focused
policies.TVip Pollard
Introduction
The
Southeastisgrowingataphenomenalrate.Althoughthisgrowthhas brought
many
benefitstotheregion,suchas
more
jobsandhigherincomes,the explosive, low-density land use development
that is transforming the Southeast is linked toan
increasing array of
environmental,
health,economic, andsocialproblems. Publicawareness
and concern with the problemsrelating tosprawl
have increased, creating pressure forchange and
significantopportunitiestopromote
new
approachesthat can capture the benefits of growth while
reducingthe
accompanying
costs.This article will
examine
some
of the keytrends, issues,andopportunities forreforminseven
southeastern states
-
Alabama, Georgia, Florida.North Carolina, South Carolina. Tennessee, and
Virginia.'
General
Growth
Trends
Population
Growth
The
Southeast is experiencing tremendouspopulation growth.
Between
1990 and 2000,population in the region increased by over 8.8
million, an almost 20 percent increase that far
outpaced the 13.1 percent increase nationwide
during the past decade. Five of the 15 fastest
growing states were in the Southeast (Georgia,
Florida, North Carolina. South Carolina,
and
Tennessee).2
Trip Pollard currently serves as a Senior
Attorney with the
Southern
Environmental
Law
Center, headquartered in Charlottesville,VA.
He
received his J.D.from
the UniversityofVirginia,
and
currently sen'eson
theboard
Census
PopulationChange, 1990
to2000
Georgia
Florida
NorthCarolina
Tennessee
SouthCarolina
Virginia
Alabama
Region
April 1,1990
6,478.216 12.937.926
6.628,637 4,877,185 3.486.703
6.187358
4,040387
44,636,612
April 1,2000
8.186.453
15.982378
8.049313
5,689.283 4,012,012
7,078315
4,447,100
53,445,054
Number
1,708.237 3,044.452 1,420.676 812.098
525309
891.157
406313
8,808,442
Percent
26.4
233
21.4
16.7
15.1
14.4
10.1
19.7
Table 1. Population growth in the Southeast UnitedStates.
Forat least the nexttwo decades,population
increases in the Southeast are projected to far
outpacethe national average.
Economic Growth
The
Southeasthas alsoexperienced dramaticeconomicgrowth. Althoughthe
economy
recentlyhas
weakened
nationwide, theSoutheast hasseena significantboostinjobsandpersonalincome in
recentdecades, and
unemployment
hastended tobebelowthenationalaverage.' Atlanta,theregion"s
largestmetropolitanarea,addedover670,000
new
jobs and increased percapita income by over
60
percent during the past decade.4
Anothersignificant trendis the fact that
new
jobs are being created most rapidly in suburban
areasthroughouttheregion. Thistrendhasamajor
impact on urban form and on the ability of job
seekersinurbanneighborhoodstofindemployment.
Althoughjobs are increasing ata fasterpace
in suburban areas, the majority of jobs are still
located relatively near the center city in
most
metropolitan areas in the Southeast. Atlanta and
Tampa,
however, aretwo
citiesshowing
a highdegree of "job sprawl," with mostjobs located
overten miles fromthe centralbusiness district.5
As
jobsbecome
less centrally located,more
landis
consumed
and autousebecomes
a necessity astransit,walking,andbicycling
become
impractical.Land
Development
PatternsAlthough
population andeconomic
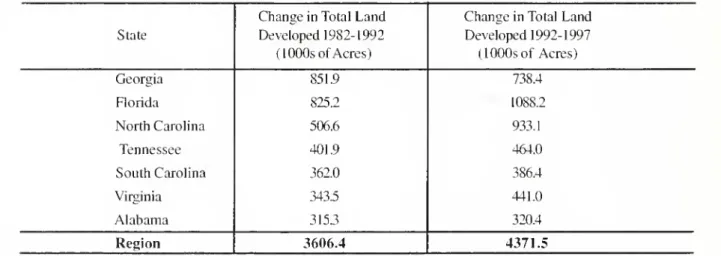
trendsChangeinTotalLand ChangeinTotalLand
State Developed 1982-1992 Developed1992-1997
(1000s ofAcres) (1000s of Acres)
Georgia 851.9 738.4
Florida 825.2 1088.2
NorthCarolina 506.6 933.1
Tennessee 401.9 464.0
SouthCarolina 362.0 386.4
Virginia 343.5 441.0
Alabama 315.3 320.4
Region 3606.4 4371.5
affectgrowth anddevelopment,theproblemisless
that theSoutheastisgrowingthan
how
itisgrowing.Scattered, highly land-consumptivedevelopment
patterns are typical inevery state inthe region.
"Top Ten"States
-TotalAcresof
Land
Developed1992-1997
The amount
of land being developed in theSoutheastis staggering.
Between
1992and 1997,over 3.6 million acres were developed in the
region,6an average ofover 720,000acresper year,
or almost
2,000
acres per day.During
thepreceding ten years,over4.37 million additional
acres were developed.
The
Southeastisthemostrapidlydevelopingregionofthe country.
Of
the ten stateswhere themostland
was
developed between 1992 and 1997,half are inthe Southeast.
The
only states in thisregionnotinthetopten
-
VirginiaandAlabama
-ranked lllh
and
13thnationally in total land
consumption.
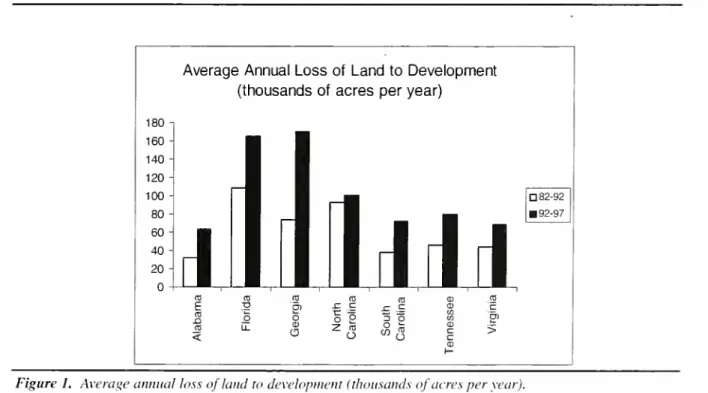
Moreover, the rate of land
development
isaccelerating ineverystate in theregion.
Thisacceleratinggrowthhascaused amassive
loss of precious resources, such as productive
farmland and forest land, wetlands, and wildlife
habitat.
Over
20 percent ofthe land developed1 Texas
2 Georgia
3 Florida
4 California
5 Pennsylvania
(. North Carolina
7 Tennessee
8 Ohio
9 Michigan
10 SouthCarolina
Table3. Topten statesbyacresofland developed,
1992-1997.
between 1992 and 1997 in Georgia and South
Carolina
was
consideredtobeprimefarmland,andover30percentofthelanddevelopedinAlabama,
NorthCarolina,Tennessee,andVirginiaduringthis
period
was
primefarmland.This
phenomenal
rateof land conversionisfaroutpacingeventherapidpopulationgrowthofthe
region, and developmentdensity isdecreasing as
the
Southeast sprawls
away
from
existingcommunities.7IntheCharlestonarea,forexample.
Average
AnnualLoss
ofLand
toDevelopment
(thousands of acres per year)
T3 en
n
c _c =O o o 2 3 o
li- 0)
CD
Z
ra
o
ill
82-92 92-97CT>
>
Escalating Auto
Use 1990-2000
Percent
VMT
IncreasePercent Population
Increase
Figure2. Increase inpopulationandvehicle miles traveled(VMT), 1990-2000.
between 1973 and 1994the population increased
by41 percent while the urban area
expanded
by255percent."
A
recent national reportfoundAtlantatobethemostsprawling of13majorcitiesstudied,
withthelowest density ofany majorcity.9
Transportation
amount
of time drivers inAtlanta spent stuck intraffic
more
thandoubled between 1992and 1999- from
25 to53 hours per person peryear; and in1999over 150millionhourswerelostduetodelay.
Drivers in Washington,
Miami.
Nashville,and
Orlandoexperienced annual delay of over40hours
per personin 1999.
As
residences, jobs,and
activities spreadfurtherapart, automobile useescalates. In 2000.
peoplein theSoutheast droveover589billionmiles;
an averageof over 1.6billion miles perday.10
The number
of milespeopledriveisincreasingdramatically in the Southeast, far outstripping
growthinbothpopulationandthe
number
ofdrivers.As
aresult,theSoutheast hasthehighestdrivingrates in thecountry. Three ofthefive largestmetro
areas with thehighest
amount
of average drivingper person in the United States are in the region,
asarefourofthe fivemiddle-sizedmetroareas."
Traffic
congestion
and
commutes
areincreasing rapidly aswell. Atlantahas
now
become
thesecond mostcongestedcity inthecountry,and
congestion there is increasing faster than in any
other major city in the country.12
The
averageCongestion is rising despite aggressive road
building programs in southeastern states.
While
new
highwayscan providetemporarytraffic relief,evidenceisgrowingthatitisnotpossibletobuild
our
way
outof congestion.New
roads actuallygenerate
more
travel, both by openingnew
areastodevelopment and
by
leadingmotoriststochangetheirbehavior,suchasencouragingpeopletodrive
rather than use alternative
means
oftransportation.11
Although
recentchanges
to federaltransportationlawhaveincreasedfundingavailable
for transportation alternatives, transportation
programsintheSoutheastremainheavilyweighted
towards building
and expanding
roads as thesolutiontovirtuallyeverytransportationproblem.
State
departments
of transportationand
metropolitanplanning organizationsinmostareas
to the consequences of roads or to alternative
transportation improvements, such as betterroad
designand
mass
transit.A
recent report bythe Surface TransportationPolicy Project
examined
how
states have spentthe federal transportationfunds theyreceive.14 It
found that three states in the Southeast (Georgia,
South Carolina, and Tennessee) are "behind the
times*'- failing to pursue
many
transportationalternatives.
Two
states(Alabama
and
NorthCarolina)were ranked as"offeringfewoptions,"
andonlytwostates(FloridaandVirginia)
was
foundtohaveeven
mixed
results,and rankedas"middleoftheroad."
No
state intheregionwas
rankedas"open tochange."
Impacts
ofCurrent
Trends
The
land useand
transportation trendstransformingtheSoutheasthave broughtahostof
unintended
economic,
health, social,and
environmental consequences.
Almost
everycommunity
intheregionhasexperiencedsome
ofthe
harm
automobile-dependent,
sprawlingdevelopmentcanbring. Thissection outlines
some
ofthemostseriousproblemsaccompanyingsprawl.
Harm
to Healthand
the EnvironmentThe
dramatic increase in driving in theSoutheast
means more
air pollution."Motor
vehicles are a major source ofpollutants such as
carbonmonoxideand smog-causingnitrogenoxides
andvolatileorganiccompounds. Overall,although
ozone levels are dropping in
most
areas of thecountry, theyarerising inthe Southeast.
Thesepollutants leadtoarange ofhealthand
environmental harms, includingprematuredeath,
lung tissue
damage, asthma
attacks, visibilityimpairment,andforestdamage. Millionsofpeople
in the region face additional health risks from
excessiveairpollution.
A
recent report from theAmerican
Lung
Association foundthattenofthe25 mostozone-polluted cities and nine ofthe 25
most polluted counties in the country are in the
Southeast.16
The American
Lung
Associationalso
gave a failinggrade tothe airquality of over
90
countiesintheregionduetoozone pollution.
The
impact ofozone onchildren'shealthisasourceof
particular concern.
A
recent study found thatemergency
room
visitsbychildrenforasthmafellover
40
percentinAtlantaduringthe 1996Summer
Olympics
when
vehicleusedecreased andtransitLargeMetroAreas with HighestDaily VehicleMilesof TravelPer Capita
Rank Federal-AidUrbanizedArea Per Capita
•
DVMT
1 Nashville 37.6
2 Houston 36.9
3 Birmingham 34.8
4 Atlanta 33.8
5 Indianapolis 32.1
Mid-SizeMetroAreas withHighest Daily VehicleMilesof TravelPer Capita
Rank
I
2
3
4(tie)
4(tie)
Federal-Aid Urbanized Area
Knoxville
Greensboro
Winston-Salem
Durham
HarrisburgPA
Per Capita
DVMT
35.6 34.3 31.7 31.4 31.4
use rose in the region.17
A
new
reportby
the federal Centers forDisease Control
(CDC)
linkssprawltoother publichealth problems."*
The
report found that byincreasing the distances between activities, and
thereby discouraging walking, sprawl increases
obesity. Thereisagainparticularconcern withthe
impactonchildren's health. Childhoodobesity is
skyrocketing,
due
in part to the fact that insprawling,auto-dependent communities,children
must
be chauffeured almost everywhere.The
CDC
report also concludes that sprawl poses asignificantsafety risk, increasing pedestrian-auto
traffic accidents.
Current land use and transportation patterns
are also closely tied to
numerous
environmentalproblems. In addition toozone pollution, motor
vehicles emissions are a primary contributor to
globalclimatechange,whichcouldhavedisastrous
environmentalandeconomicimpacts.
The
averagevehicleemits
more
thanonepoundofcarbondioxidepermile,' 1
'andtotalcarbon dioxide emissionsfrom
transportation are increasing nationwide.:"
Waterqualityandquantityproblemsareother
serious
problems
associated with sprawl.Buildings, roads, and parking lots are replacing
millionsofacresofforests,farms,andwetlandsin
the Southeast that
would
otherwise filter water.Further, development dramatically increases the
amount
ofimpervioussurfaces, which inturncanincrease thevolumeof runoff ofpollutants,increase
erosion, and slow groundwater replenishment,
depleting watersupplies.
A
one-acre parking lot,forexample, cancreate 16times
more
runoff thana
meadow
of thesame
size.21The
cumulativeimpacts of sprawl can bedevastating.Forexample,
the
Catawba
River in North Carolina and SouthCarolina has been identified as one ofthe
most
endangered rivers in the country due to erosion
and runoff
from
explosivedevelopment
in theCharlotte area,
where
approximately40
acres ofgreen space isdeveloped daily.-2
In addition, land cleared for roads
and
developmentcan depositsiltinriversandstreams.
and
road useand maintenance
can introducepollutants such as herbicides into the water. For
example,
theTennessee
Department
ofEnvironmentandConservationfoundthatsediment
from the construction ofthe southern portion of
StateRoute
840 -
a ringroad outsideof Nashvillecurrentlyunderconstruction-has
damaged
eightstreams and creeks, including sediment deposits
of afootor
more
insome
cases.2:iThe
list ofenvironmentaldamage
caused bytheSoutheast'slanduseandtransportation patterns
also includes loss of the region's
tremendous
biological diversity, habitat fragmentation, noise
pollution, and visual blight. In short, sprawl is
perhaps the single greatest threat to the region's
environment.
Community
Wealthand
HealthLand
use and transportation patterns have avarietyofimpactson
community
involvement andconnectedness.
As
land uses spread further andfurther apart and a car
becomes
necessary forperforming
many
activities, children, the elderly,anddisabledindividualshavegreater difficulty in
becoming
activemembers
ofthecommunity.The
time
we
spendcommuting
andstuckintrafficalsoreduces involvement in
community
activities.Moreover,studieshave
shown
thatpeoplewho
liveonstreetswith highertrafficlevels
know
farfeweroftheirneighbors than
do
people on streets withlower traffic.24 Further, a recent report prepared forthe
Community
FoundationofGreater Atlantaconcluded
that Atlanta's "rapidgrowth
may
constrain the
development
of the area's socialcapital.
As
would
be expected,newcomers
toAtlantareportlowerlevelsofinvolvementincivic
activities,formalassociations,charitable giving,and
faith-based engagement.25"
Fiscal
and Economic
CostsSprawl'spricetagistremendousanditisrising,
as is the threat it poses to successful long-term
economic development.
the fiscal impact of sprawl development patterns harms
many
localities and burdens taxpayers.26 Proposed developmentsare frequentlyjustifiedonthe basisofthe tax revenues they will bring toa
city orcounty. All toooften, however, localities
arefaced withthereality thatgrowthdoesnotpay
for itselfand canleadtohighertaxratesor higher
debt. Although
new
developmentdoes bringnew
taxrevenues,far-flungdevelopmentoftendoesnot
generate
enough
taxes to pay for thenew
roads,water lines, schools,andother infrastructure and
services that need to be provided. At the
same
time,infrastructure thattaxpayershavealreadypaid
for
may
be underusedorabandonedasdevelopmentspreads outward. Providing the infrastructure to
servegrowthcanalsostrain statebudgets.
A
studyin South Carolina
showed
that directing futuredevelopmenttoexistingareas
would
make
useofinfrastructurealreadyinplace,savingthestate$2.7
billionover20years.27
Current land useandtransportation trends also
threatenthelong-termhealthofregionalandlocal
economies.
A
recent national report found thatbusiness leaders "are recognizing that quality of
lifedirectly affects
economic
prosperity, andthatsprawl
threatens quality of life inmany
communities.28" Foronething,trafficcongestion and long
commutes
make
an area amuch
lessdesirable place to live and work. Moreover,
businessesandindividuals are oftenforcedtopay
highpricesforcongestion;in 1999.congestioncosts
were over $2.6billion inAtlanta
and
almost $1.5billion inMiami.29
The
typicalsouthernhouseholdspends $6,863 per year on transportation, with
$6,577goingtowardautomobiles.30 Thisoutlayis
secondonlytohousingexpenditures,andis
more
than families in the region spend on health care
and food combined.31
The economic
vitality of existing ruralcommunities, small towns, urbanneighborhoods
-even older suburbs
-
also suffers under sprawl.Not
only does sprawl tend to lead to increasedpropertytaxes,butitalsosaps thevitalityofexisting
communitiessinceinvestment,jobs,andresidents
are luredtooutlyingareas. Ruraleconomies can
further suffer asproductivefarmlandisconverted
and
scenic landscapes, historic areas,and
recreation areas that often attract vital tourist
spendingare
harmed
ordestroyed.Equity Problems
The
burdens and benefits of land useand
transportation patterns arenot distributed equally.
As
noted above, sprawl development drives uptransportation costs.
Lower
income
families,however, spend the highest percentage of their
incomeontransportation. Accordingtothe Bureau
ofLaborStatistics'
Consumer
Expenditure Survey,households with
income
between $10,000and
14,999, for example, spend $3,697 per year on
transportation
-
aquartertomore
than a third oftheirincome(24to37%), onaverage.32
In contrast,
families with incomeof$30,000to 39,999 spend
an average of
$6973
per year on transportation(only 17 to
23%)
and upper income householdsearning $70,000 or
more
spend an average of$13,363ontransportation(a fractionofonepercent
up to 19%, onaverage).
Inaddition,sprawltendstobebotha
symptom
and acause ofeconomic and social polarization,
helpingtoconcentratepovertyin citiesand drawing
people
and
wealth to the suburbs.This
concentration in turn leadsboth to the increased
need for local services within cities and to the
erosionofthe tax base necessarytosupportthese
needs, spurring further flight of wealthier
households.
Myron
Orfieldhasdocumented
thispolarizationinAtlanta,aswell as the similar pattern
of
economic
decline that ultimately tends toovertake inner suburbs and satellite cities that
cannot
compete
as wealthier residentsmove
tonewer
suburbs.33 His study also highlightsinequities in infrastructure investment patterns,
showingthatthemajorityofhighwayspending has
gone to wealthier suburban areas, helping
them
attract an even larger share ofthe region's jobs.
Inaddition tofurthering regional polarization, as
infrastructure investments helpto
draw more
jobstooutersuburbsitisincreasinglydifficultfor
low-income individuals residing in the central city to
findandtoreach work.Thisproblemisexacerbated
alternatives,andhasadisproportionateimpacton
minorities.
Changing
PublicAttitudesToward
Sprawl
The
mounting problemsaccompanying
sprawlin the Southeast have led to increasing public
concernabouttheconsequencesofcurrentgrowth
patterns.
A
Floridapoll,forexample,foundthat90percent of voters support
managing
or limitinggrowth.14
In a North Carolina poll, almost 77
percent of
respondents
felt "strongly" or"somewhat
strongly"thatthestate"shouldimposemuch
stricterenvironmentalcontrolsondevelopersandconstruction businesses.35" In addition, polls
in
numerous
areas throughout the region haveidentified traffic congestion as one of the most
pressingissuesfacinglocalities.
The
deepening concern about
sprawl isaccompanied by growing support for promoting
smartgrowth and
community
livability measuressuch as preserving
open
space and revitalizingexisting communities. In a
nationwide
pollconductedforSmart
Growth
America, 85 percentof the people surveyed supported increasing
coordination
among
townstoplanforgrowth,and76 percent supported state
governments
givingfundingpriority tomaintainingschools, roads,and
otherservicesinexistingcommunitiesratherthan
encouraging
development
in the countryside.16Further,Federal
Highway
Administration surveyshavealso
shown
thatthepublicismuch
more
likelyto support
expanding
public transportation orbuilding
new
bikeways
and sidewalks than tosupport
new
highways.17Theseopinionsare increasinglyevidentatthe
ballotbox.
Growth
issuesarefiguringprominentlyin
more
localracesand measuresintheregion. InNovember
2000,forexample,dozensofmeasuresinvolvingarange ofissues relatingtogrowth(such
aseconomic development andrevitalization,open
space,andtransportation)were onlocalballotsin
theSoutheast.™
Most
ofthese measures were onthe ballotinFlorida,Georgia,and NorthCarolina;
most measures dealt with funds for preservation
of parks and
open
space, and almost all of thesemeasures passed. In addition, several measures
provided funding for improving transportation
choices; Atlanta, for
example
passedtwo bond
measures totaling $74.5 million to improve the
pedestrianandtransitenvironment.
Opportunities for
Reform
Sprawl is not inevitable.
A
host of publicsubsidies,regulations,anddecisions typically
make
it cheaperandeasiertodevelop on the fringes of
existing communities. For example, a primary
factor fueling explosive growth in the Southeast
has been the public investment in infrastructure,
such as roads,and waterand sewerlines; aslong
as taxpayers cover these costs, there is little
incentive to build
where
infrastructure alreadyexists. In addition, planning and zoningpolicies
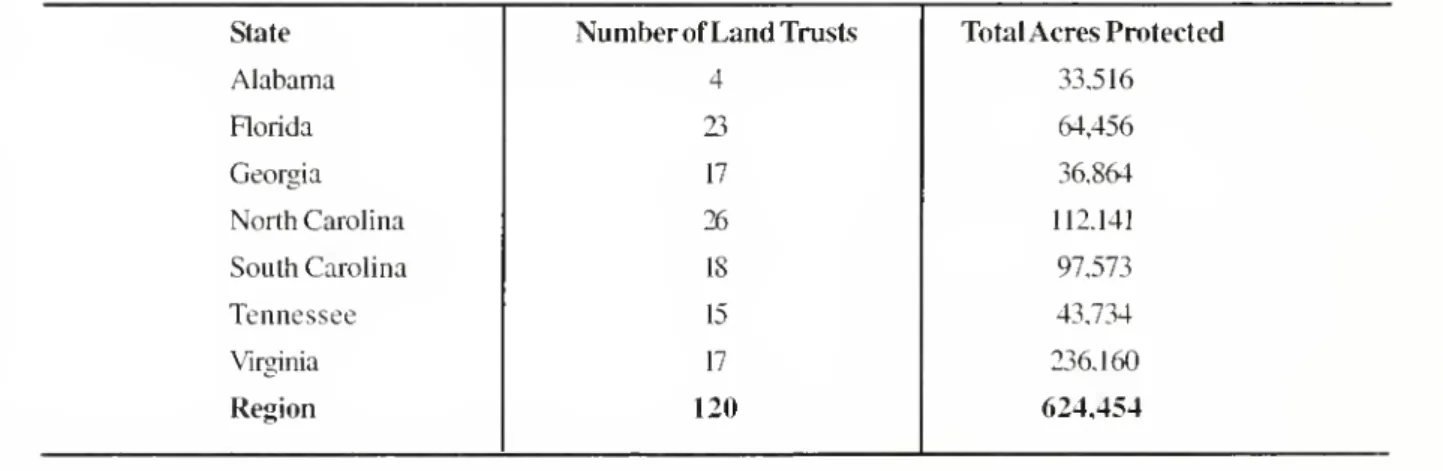
State
Number
ofLand
Trusts TotalAcresProtectedAlabama 4 33.516
Florida 23 64,456
Georgia 17 36,864
NorthCarolina 26 112.141
SouthCarolina 18 97.573
Tennessee 15 43.734
Virginia 17 236.160
Region 120 624,454
thatrequire largelotsandthegeographieseparation
of commercial and residential uses encourage
scattereddevelopment anddriving.
There are
ample
opportunities for reform.AlthoughmostoftheSoutheastis stillinthe early
stagesofaddressing sprawl-related problems,and
no stateor locality hasadopted acomprehensive
setofpolicy reformsto promote smartergrowth,
there have
been
significantaccomplishments
throughout
much
oftheregion.Itis
beyond
thescope ofthis articletoprovideacomprehensiveinventoryofthe
many
innovativetools and strategies states and communities are
using to better guide growth and promote
more
sustainable transportation.'9 Thissectionprovides
an
overview
ofsome
of thekey
recentaccomplishmentsintheSoutheast,whichhighlight
some
ofthemore
promisingstrategiestopromotesmartergrowth and
community
livability.Land
ConservationTherearea
number
oftools availabletoprotectrural,natural,andhistoricareasfromtheexplosive
development sweeping the region. These tools
include establishing parks and
greenways
andconserving forest, farmland, and other forms of
open
space- whether through
acquisition,purchasing
development
rights, or usingconservationeasementsto limitdevelopmentthat
threatenspublicresources suchascleanwaterand
greenspace.For example,over 1.200privateland
trusts nationwide protect
more
than 4.7 millionacres. In the Southeast, there are120 land trusts,
and they are estimated to have protected almost
625,000 acres.40
Inaddition.Floridahasthe nation'slargestland
acquisitionprogram. Since 1990.overonemillion
acreshave been protected. In 1999.this
program
was
extendedfor 10years withanannual fundinglevelof$300milliontoacquire,protect,andrestore
openspace,urbanrecreationland,and greenways.
Otherstates intheregionhaverecentlytakenaction
on open
space funding as well. In Georgia,Governor
Barnes successfully pushed for theGreenspace Trust
Fund
that will providefast-growingareas$30millioningrantsiftheydevelop
greenspace plans that protect 20percent oftheir
land.
Increasing Transportation Choices
As
discussed above, transportation programsinsoutheasternstatesareheavilyweighted towards
building and expanding roads, virtually ignoring
transit,bicycling,walking,andother transportation
alternatives. This road-centeredapproach hasbeen a majorfactor fueling sprawl in the region since
new
roadscanlargelydeterminethepace,location,and
scale of growth,opening
new
areas todevelopment andsubsidizingsprawl.
Some
significantreforms havebegunthemove
toward a
more
balanced transportation approachthat offers a variety of transportation choices,
providingmeaningfulalternativestohavingtodrive
everywhere. For
example,
Charlotte votersapproved a referendum in 1998 adopting a
half-cent sales taxtofund a 25-year planthat includes
$1 billion in transitimprovements. InAtlanta, the
new
25-year long range transportation plan callsfordevoting 55percentof fundstotransit,although
there aresubstantial questions regarding whether
this
much
fundingwillactuallybespentontransit.In addition, although still a small percentage of
transportation funding, there has been a surge in
publicinvestmentinbicycleandpedestrian projects
throughoutthe region,largely asaresultoffederal
funding changes.
The
Birmingham
area, forexample,
isimplementing
a$15
millioncomprehensivebicycleandpedestrian plan.
Building Better
Communities
Effortstorevitalizeexistingcommunities and
to
promote
more
compact
patterns ofnew
development with a mixture of commercial and
residential landuses are a cornerstone of smarter
growth. Theseeffortshavethe potentialtoreduce
the pressure on undeveloped lands by providing
businesses, to decrease travel times and
make
transportation alternatives
more
practical bylocating
homes
closertojobsandotheractivities,and to reduce the fiscal impacts of growth by
encouraging development inareasalready served
byroads, schools,waterandsewer.41
Current
public-subsidiesandregulations,however,typically
make
it cheaper and easier for developers to build on
undeveloped
siteson
the fringes of existingcommunities.
Redirecting Infrastructure Investments
One
of the most promising opportunities forstates andlocalities toguidegrowth is toredirect
public infrastructure spending to serve existing
communities and designated growth areas. For
example, road funds can be reprioritized using a
"fixitfirst"approachthatdevotesa larger portion ofroadspendingtomaintainingexistingroadsand
bridges than to
new
construction thatopens
previouslyruralareastodevelopment. Inaddition,
numerous
localitieshavedesignatedgrowthareasthat delineate
where
capital improvements andinfrastructure investmentwillbe made.
The
Cityof Virginia Beach, for example, has adopted a
"Green Line"
that shapes the city's capitalimprovement andlanduse planningandhas resulted
in the lion's share ofgrowthoccurring within the
designated area.
Providing Financial Incentives
The power
ofthe purse is also beingused toprovide financial incentives
-
such as taxcredits,tax abatements, loans, andgrants
-
to encouragerehabilitationandreuseofexisting structuresand
properties that
have
already been developed.Historicpreservation incentives are a
common
andeffectivetooladoptedby
many
statesandlocalitiesin the region. In North Carolina, forexample,
developers estimated that the majority of the
projectscompleted undera taxcreditprogramfor
rehabilitationofcertaintypes ofhistoricbuildings
would
not have been undertaken without such acredit.42 In addition,
many
statesandlocalitieshave adoptedincentivestoencourage redevelopmentofold industrial sites,
commonly
referred to as"brownfields." Florida, for instance, offers a tax
creditthatprovides aneligible applicantupto 35
percent ofthecostsofavoluntarycleanupactivity
integral to rehabilitating a state-designated
brownfieldsarea.
Removing
Regulator}' BarriersIn addition to reorienting infrastructure
expendituresandprovidingfinancial incentivesto
guide development,a
number
ofstatesandlocalitiesin the Southeasthave
begun
toreview and reviseregulatory provisions that inhibit
more
sensiblegrowth. Planningandzoningpolicies,forinstance,
typicallysegregatecommercialandresidentialuses
intodifferentgeographicareas,practicallyrequiring
people to drive to conduct almost any activity.
Requiring large lot sizes, large setbacks or wide
streetwidths are
some
oftheothermeasures thateffectively mandate automobile-dependent, land
consumptive
development
patterns. Inmost
localitiesintheSoutheast,itwouldbeillegaltobuild
the
more
compact, mixed-use development thatprevailedin thisregionuntil thepastfew decades
and
characterizesmany
of the region'smost
attractiveandvibrantoldercommunities.
A
growing
number
of states and localitiesthroughouttheSoutheasthaverevised regulatory
provisions to eliminate such barriers to
more
compact, traditionalneighborhood development.
For example, an overlay district
was
adopted inPortRoyal, SouthCarolinatopromote amixture
of land uses, infill development, and
pedestrian-friendly streetimprovements. Threetowns north
of Charlotte
-
Huntersville,Davidson,
and
Cornelius
-
have overhauled their developmentregulations,adoptingsimilarprovisionstopromote
more
traditional development. Although fewerstepshave been takento
remove
policy obstaclesto smarter growth at the state level, there have
been
some
advances.NorthCarolina, forexample,recentlyadoptedapilotprogramthatallowscertain
local governments to use an alternative building
code designed to
remove
some
of the hurdlesbuildings.
Linking Transportation
and
Land
Use
One
ofthe greatest hurdles tomore
sensiblegrowthisthe frequentfailure to linktransportation
andland use. Transportation improvementsshape
the location and pace ofdevelopment, and land
use plansand developmentcanhavea significant
impactontheneedfor
new
transportationfacilitiesandthe effectivenessoftransportation investments.
Yetthislinkisfrequentlyoverlooked. Forthemost
part,localities have beenresponsibleforland use
decisionsandpolicies,whilestateshave hadprimary
responsibility for transportation decisions.
The
failure to link land use and transportation has
contributed to sprawling development, traffic
congestion,andotherunintendedconsequences.
One
ofthemore
notableefforts toovercome
these
problems
is theGeorgia
Regional
TransportationAuthority
(GRTA),
atransportationsuperagencythatcould provide a
model
formore
sustainable transportation and smarter growth.
GRTA
hasthe potentialtolink transportation,landuse,andairqualityplanningatthe regionallevel;
to provide a broader range of transportation
choices;andtousetransportationfundingtoguide
growth
to areaswhere
it will not generatesignificantsprawl. Althoughithasyetto liveupto
itspotential,
GRTA
was
giventremendouspowers by thestate legislature, includingtheauthoritytoveto regional transportationplans,buildandoperate
public transportation systems, or
withhold
transportationfundsfromlargedevelopmentprojects.
In contrast to
GRTA,
whichwas
created bythe state, local
governments
in theCharlotte-Mecklenburg
County
area have cooperated andcommittedtoaregional transitand landuse plan
that identifies land use and
community
designcharacteristics and transportation improvements
needed to address growth pressures in the area.
Among
otherthings, this planoutlineshow
localgovernmentswillrevisetheirzoning ordinancesto
guidedevelopment toagreed
upon
transportationcorridors and centers.
Conclusions
Thereare substantialopportunitiestopromote
more
efficientandmore
sustainablegrowth intheSoutheast.
Many
stepsinrecentyearshavebegunto take advantage ofthese opportunities. There
are,however, significant barriers toadopting and implementing
more
sensibletoolsandstrategies forguiding growth. These barriers include
shorter-term hurdles such as budget shortfalls resulting
from the recent economic downturn, as well as
more
intractable barriers such as transportationagencies that are often opposed to change, and
politicallypowerfulspecial interests that profitfrom
current policiesfavoringsprawldevelopment and
roadconstruction.
Despitethese hurdles,the substantialeconomic,
health,environmental,and socialcostsofcurrent
growthtrends arefuelingpublicconcernandcalls
forchange. States and localities throughout the
Southeast must
make
critical choices abouthow
they will grow. Policies that can capture the
benefitsofgrowthwhileminimizingtheattendant
costs must be adopted if the region is to enjoy
continued
prosperity, vibrantand
healthycommunities, abundant natural resources, and a
strong qualityoflife.
NOTES
' Forfurtherdiscussionofthe trendsshaping
the
Southeastand
new
approaches to development, seeSouthernEnvironmental
Law
CenterandEnvironmental
Law
Institute.SmartGrowthintheSoutheast:
New
Approachesto GuidingDevelopment(1999)(availableat
www.southernenvironment.org). Foramoredetailed
discussionofsmart growth,see Pollard.Smart
Growth: ThePromise, Politics, andPotentialPitfalls
of EmergingGrowthManagementStrategies,Virginia
Environmental
Law
Journal.Volume19.No,3. p.247(2000).
:
I
Of
course, theseeconomictrends arenotuniform.Several mainstays oftheeconomyofanumberof
states in theregion-suchastextiles andtobacco
-havedeclinedsharply.
4
SMARTRAQ,
Trends, Implications&
StrategiesforBalanceGrowthin theAtlanta Region
(2001((availableathttp://www.smartraq.net/pdfs/
synthesis.pdf).
II
The BrookingsInstitution.Job Sprawl: Employment
Location inU.S.MetropolitanAreas(2001).
US
DepartmentofAgriculture.1997NationalResourcesInventory (2000).Theinformationinthe
remainder ofthisparagraphandinthenexttwo
paragraphsisalsotaken fromthisstudy.
7
TheBrookingsInstitution.
Who
SprawlsMost?How
GrowthPatternsDifferAcrossthe U.S.(2001).
s
TonyBartelme, "Tri-CountyGrowthBinge'Nota
Good
Pattern,""CharlestonPostandCourier,September 11.1997, pp.1-B.4-B.
"GeorgeGalster.RoyceHanson,HalWolman.
StephenColemanandJason Freihage. Wrestling
Sprawl to the Ground:DefiningandMeasuring an
ElusiveConcept(2000)(executive
summary
availableathttp://www.fanniemaefoundation.org/programs/
pdf/proc fairgrowth galster.pdf).
1,1
Datacompiled fromFederalHighway
Administration.HighwayStatistics2000, Table
VM-2.
11
FederalHighwayAdministration.Highway
Statistics 2000.
12
TexasTransportation Institute, The2001 Urban
MobilityReport:KellySimmons."Atlantatailgating
L.A.ongridlock:We'refastest innationatadding
trafficjams," Atlanta Journal-Constitution,
May
8, 200I.p.A-l.13
See. AnthonyDowns. Stuckin Traffic:Coping with Peak-HourTrafficCongestion(1992);LewisM. Fulton.RobertB.Noland. DanielJ.Meszler
&
JohnV.Thomas.
"A
StatisticalAnalysis ofInducedTravelEffectsinthe
US
Mid-Atlantic Region,"/. ofTransp.&
Statistics.Apr.2000.at2:Mark
Hansen andYuanlinHuang."RoadSupply andTrafficinCalifornia
UrbanAreas." 31 TransportationResearch
A
205(1997):MarkHansen.
"Do
New
HighwaysGenerateTraffic?,"Access16,19-20(Fall 1995).
14
Surface Transportation PolicyProject.Changing
Direction: Federal Transportation Spending in the
1990s(March2000).
15
SeeLawrenceFrank.Brian StoneJr..and William
Bachman."Linkingland use withhouseholdvehicle
emissionsinthe central Puget Sound: Methodological
framework andfindings,"TransportationResearch
Part
D
5.3: 173-96(2000).16
AmericanLungAssociation. StateoftheAir 2001.
17
MichaelS.Friedman.M.D.: KennethE.Powell.
M.D., M.P.H.; LoriHutwagner,M.S.;LeRoy M.
Graham. M.D.;W.Gerald Teague.M.D.,"Impactof
ChangesinTransportationandCommuting Behaviors
Duringthe 1996
Summer
OlympicGames
inAtlantaonAir QualityandChildhoodAsthma." J.Am.Med.
Ass'n.Vol.285.No.7, p.897-905(February21.2001).
18
Creating
A
Healthy Environment: The Impact ofthe BuiltEnvironmentonPublicHealth (2001).See also.Lawrence Frank andPeterEngelke."TheBuilt
Environment and
Human
Activity Patterns:ExploringtheImpacts ofUrban
Form
onPublicHealth," 16Journalof PlanningLiterature202-18(2001).
19
TransportationResearchBoard.Committeefora
Studyon Transportation andaSustainable
Environment. TowardaSustainable Future:
AddressingtheLong-TermEffectsofMotor Vehicle
Transportation on ClimateandEcology. Special
Report251.p.79(1997).
20
EPA.National Air PollutantEmission Trends
1900-1998. Table8-2.
21
Chesapeake BayFoundation.
A
Better WaytoGrow: For
More
LivableCommunitiesanda::American
Rivers.America'sMost Endangered
Riversof2001.
23
Memorandum
from Joey Woodard."Summary
ofsedimentimpactstoTurnbullCreek andtributaries,"
TDEC,
DivisionofWaterPollution Control,September7.2000.
14
1000FriendsofFloridasummaryofapoll
conducted byTheTarranceGroup,Feb. 11-13.2001
(availableathttp://www.1000friendsofflorida.org).
35Commission
on Smart Growth, Growth
Management
and Development: Findings andRecommendations, 14(Fall2001).
:4
DonaldAppleyard. LivableStreets(1981).
23
Christopher
Home,
Social Capitalin MetropolitanAtlanta: Findingsfrom theSocial Capital
BenchmarkSurvey (June 18,2001),p. 14.
:"See.American FarmlandTrust.LivingontheEdge:
TheCostsandRisksofScatterDevelopment(1998).
11
Robert W. Burchell.etal..South Carolina
InfrastructureStudy: ProjectionsofStatewide
Infrastructure Costs, Savings, andFinancing
Alternatives, 1995-2015.
28
NationalAssociationofLocalGovernment
Environmental.Professionals, ProfilesofBusiness
Leadershipon SmartGrowth:
New
PartnershipsDemonstratetheEconomicBenefitsof Reducing
Sprawl13 (1999).
29
TTI,supranote 13.
30
U.S.Departmentof Labor.BureauofLabor
Statistics,ConsumerExpendituresin 1999. Table8
(May
2001((availableathttp://www.bls.gov/cex/ .csxann99.pdf). Dataisnotavailable solely for the
seven statesthatare thefocus ofthis article. The
ConsumerExpenditureSurveydefines theSouthto
includethesestatesplusArkansas.Delaware.District
ofColumbia.Kentucky. Louisiana,Maryland.
Mississippi.Oklahoma.Texas,andWestVirginia.
31
Id.
<:
BureauofLaborStatistics,supra note 31,Table2.
33
Myron
Orfield.AtlantaMetropolitics:
A
RegionalAgendaforCommunityandStability(December
1998).
(6
SmartGrowthAmerica,Greetingsfrom Smart
GrowthAmerica(2001((citingstudyconducted by
Belden,Russonello
&
Stewart.September2-10. 2000)." Federal HighwayAdministration,MovingAhead:
TheAmerican PublicSpeaks on Roadways and
Transportationin Communities(availableat
www.fhwa.gov/reports/movingahead.htm).
38
See. PhyllisMyersandRobert Puentes.Growthat
theBallotBox:Electingthe Shape of Communities
inNovember 2000(February2001 ). 19
Foramorecomprehensivelistoftoolssee.for
example.SmartGrowthNetwork.GettingtoSmart
Growth: 100PoliciesforImplementation(2002);for
furtherexamplesinthesoutheastsee
SELC
andELI.supra note 1
.
40
LandTrustAlliance.National LandTrustCensus
(2000). 41
See EPA. OurBuiltandNatural Environments:
A
TechnicalReview ofthe InteractionsbetweenLand
Use, Transportation, and EnvironmentalQuality
(January 2001). fordiscussionof
many
ofthebenefitsofmorecompact development.
4:
NorthCarolinaDepartmentofCulturalResources.
StateHistoricPreservationOffice,"TheEconomic
ImpactoftheRehabilitationInvestmentTaxCredit