Sharif University of Technology
Scientia IranicaTransactions A: Civil Engineering http://scientiairanica.sharif.edu
Seismic response evaluation of reinforced high strength
concrete columns based on the modied constitutive
model
F. Vahid-Vahdattalab
a, J. Mokari Rahmdel
b, and E. Shafei
b; a. Department of Structural Engineering, Urmia University of Technology.b. Faculty of Civil Engineering, Urmia University of Technology, Urmia, Iran.
Received 11 January 2016; received in revised form 13 September 2016; accepted 31 October 2016
KEYWORDS High strength concrete;
Seismic assessment; Modied strength model;
Cyclic loading; Second order force eect;
Reinforcement ratio.
Abstract. The current study deals with strength and seismic ductility assessment of reinforced High-Strength Concrete (HSC) columns. We have studied the nonlinear response of HSC columns with various reinforcement and axial force ratios subjected to cyclic loading. The study consists of primary verication of mathematical nonlinear model and further calibration to ensure the required accuracy. The existing experimental work is assumed as verication pilot that consists of four columns. Column members dier in the strength and axial force. Concrete has 63.1 MPa mean strength and 0.3% crushing strain. The longitudinal and transverse reinforcements are based on ACI 318 regulations in experiment. We have used the nonlinear ber-element code in OpenSees environment for the modeling and analysis of models. The existing proposed stress-strain curve is modied to ensure the validity of assessment. Calibration procedure has led to conclusion that the post-yield slope needs to be modied in HSC model as the average value of ACI 363 reference. We have developed twelve extra models to estimate the interaction of concrete strength, rebar ratio, and axial force eect on the seismic performance. Parametric study of calibrated models reveals that the seismic energy dissipation in HSC members is the function of the provided longitudinal reinforcement ratio and lateral conning stirrup amount.
© 2018 Sharif University of Technology. All rights reserved.
1. Introduction
Primarily, it is essential to have a short denition of HSC according to valid regulations. ACI Committee 363 [1] denes HSC as a concrete material with crush-ing strength (f0
c) higher than 41 MPa. HSC is used
in high-rise and special structures such as dams and hydropower substructures. Various research works are conducted in the eld of HSC and its feasible potential use in civil structural systems. Sugano et al. [2]
*. Corresponding author. Tel.: +98 44 3372 8180 E-mail address: [email protected] (E. Shafei) doi: 10.24200/sci.2017.4183
conducted an eective research on the experimental seismic behavior of HSC columns, which are laterally reinforced with high strength steel bars. They revealed that the use of high or ultra-high strength steel bars is quite eective in conning HSC with strength increase up to 80 MPa. Therefore, they suggested the use of high or ultrahigh strength lateral reinforcements for the HSC columns subjected to axial compression. Xiao and Martirossyan [3] conducted a broad research on the seismic performance evaluation of HSC columns with a focus on shear strengths. Results revealed that the ACI 426 [4] relation overestimated the shear strength of the HSC columns with a shear failure mode, but the ACI 318 [5] relation estimated the shear strength with 10% deviation.
Ashour [6] conducted a research on the eect of compressive strength and tensile reinforcement ratio on exural behavior of HSC beams. The study re-vealed that for the same longitudinal reinforcement, the cracking moment increases as concrete compressive strength increases. In addition, the increase in concrete compressive strength leads to an increase in the exural rigidity of reinforced concrete beam. Bing et al. [7] conducted a research on the stress-strain curve of HSC conned by ultrahigh and normal-strength transverse reinforcements. The study revealed that the compres-sive strength of concrete determines the column duc-tility, particularly for strengths higher than 60 MPa. Regardless of the concrete compressive strength, a rise in the connement ratio results in peak stress growth. In addition, results revealed that the enhancement in the ultimate strain of lateral conning system results in a decrease in the slope of softening branch of stress-strain curve. Kabir and Shafei [8] conducted studies on the lateral conning of HSC by FRP jackets subjected to eccentric axial loading in advance. The acquired results revealed that FRP connement is also eective in strength and ductility enhancements of high strength columns. However, strengthening is much eective in Normal Strength Concrete (NSC) than HSC, since concrete does not exhibit adequate volumetric dilation to activate the FRP connement.
Woods et al. [9] conducted a research on the bending ductility of the rectangular HSC columns. The study revealed that there is an interaction between the ductility and transverse reinforcement spacing. They noted that for a given tie spacing, there is a range of transverse reinforcement ratio, which enhances the column ductility. Ho et al. [10] conducted a research on the aectivity of adding an additional conning system on the ductility improvement of HSC columns. The study presented that the stress-strain path of the concrete in conned columns is sensitive to the provided conning system. In addition, the design parameters of the conned concrete are determined by connement characteristics, which are necessary for initial proportioning of HSC members. Results revealed that both of the balanced reinforcement ra-tio and ultimate axial force capacity increase when the conning pressure is increased, nally improving the exural ductility of the conned column. Hui and Zhao [11] conducted a study on the empirical stress-strain models of unconned HSC under uniaxial compression. Results conrmed that the proposed empirical model could cover the existing experimental data for normal weight HSC materials eciently and represent the mean stress-strain curve.
Ozbakkaloglu [12] conducted a research on the be-havior of square and rectangular Ultra-High Strength Concrete-Filled FRP Tube (UHSCFFT) columns un-der axial compression. It was revealed that suciently
conned square and rectangular columns could exhibit a compressive behavior with high ductility. However, the behavior of members is highly sensitive to the conning tube thickness. In other words, the tubes with thin walls do not provide sucient conning pressure in order to allow columns to maintain their load-carrying capacity beyond the peak load. In addition, the crushing strength of HSC materials with high strengths is more sensitive to the conning pressure than low strength ones. Kottb et al. [13] conducted a study on the behavior of HSC columns under eccentric axial loads. The study revealed that using normal longitudinal steel bar diameter in HSC columns is not adequate and leads to a catastrophic collapse. They conducted analytical studies using existing semi-empirical material models of HSC with the total assessment error of 17%, which conrms the results of the additional studies on the calibration of mathematical models for HSC material behavior.
2. Research signicance
The main criteria in the seismic application feasibility of HSC construction are stability and ductility levels during quake excitations. On the other hand, the design regulations obligate the designer to provide a unied material response curve for calculations and requirement controls. Thus, there is an essential need to provide the preliminary material constitutive curve for seismic excitation, besides the static loads. HSC columns are the primary members that resist quake-imposed energy during seismic action in moment-frame systems; therefore, they need to be designed in the dimension and material to do so. There is a serious lack in determination of initial design dimensions because there is no unied regulation concerning the HSC materials. Seismic performance evaluation of such members depends directly on calibrated denition of stress-strain curve concerning the cyclic load protocols. The HSC column ductility and its interaction with demand seismic performance has not been specied in recent research works; therefore, the goal of the current study is to evaluate the existing material models and modify them, if required, in order to satisfy the design prerequisite performance levels. Primary target of study is to assess the HSC compressive strength eect on the hysteretic load-deection response and the dis-sipated energy under dened displacement protocols. Four square RC columns with HSC material, tested by Xiao and Yun [14], are the basis of numerical simulation and should be calibrated according to the presented experimental data. The extended study on the present research work is to evaluate the accuracy and validity of the existing stress-strain curves for HSC, which also considers the successive cracking and crushing of concrete.
3. Response characterization 3.1. Experimental background
Columns accepted as the pilot experimental database are in full-scale size and have square of 510 mm cross-section with total height of 2032 mm; as tested by Xiao and Yun, lateral loading point is elevated at 1778 mm height at top of the footing. All columns are reinforced with four no. 36 bars (d = 35:8 mm) plus four no. 29 bars (d = 28:7 mm), providing a exural reinforcement ratio of 2.6% [14]. The main testing parameters selected as a parametric study were the transverse reinforcement and axial load ratios. The additional y ash, silica fume, super-plasticizer, and low water-to-cement ratio provide the design com-pressive strength from 34.5 MPa up to 64.1 MPa for HSC. Grade 420 steel rebar (fy = 469 MPa) is used
as longitudinal reinforcement for all members besides both grade 420 and 520 stirrups (fy = 524 MPa) as
transverse reinforcement of each three-column group. The conguration of HSC-RC columns tested by Xiao and Yun is demonstrated in Figure 1. The details of test members are reported by the studies in Table 1.
The base of all columns was anchored to a rigid base using post-tensioning system, which is assumed as full restraint in a numerical model. In an experimental procedure, due to restriction of axial load application, the value of vertical gravity load changes as column is laterally displaced. However, this phenomenon
Figure 1. Detail of column specimens tested by Xiao and Yun [14].
Figure 2. Lever arm system for axial loading and second-order eect detail in test [14].
is modeled exactly as occurring in real nature of structural columns, since vertical load does not have any direction change in small drifts (lower than 6%). Therefore, the second-order eect of axial load (P ) is expressed in an acceptable way in the simulation of the current study than as applied to the experiments. The experiment uses external apparatus to apply the combined axial and vertical loading where the direction change of vertical load has not been neglected in the test. This case lowers the eect of the second-order load eect in the test. However, we keep the direction of vertical load as constant and perpendicular to the foundation during the whole analysis, which is realistic in structural problems. This case is shown in Figure 2. The axial load is constant over the period of testing, although the lateral displacement has cyclic regime with increasing amplitudes. The time history of applied lateral relative displacement (=L), i.e. drift, according to Figure 3, consists of six successive cycles with a 0.5% drift increase, which is at rst followed by 1% of three drift cycles up to member rupture. 3.2. Material mathematical model
The basic stress-strain constitutive curve assumed for HSC is the model proposed by Bing et al. [7], which consists of three continuous relations as follows. The assumed model is based on classic uniaxial curve of
Table 1. Details of HSC column members tested by Xiao and Yun [13]. Specimens Longitudinal
steel
Transverse steel
Concrete strength (MPa)
Axial load (kN) FHC-1
429 & 436
16@100 64.1 3334
FHC-2 16@100 62.1 5373
FHC-3 16@100 62.1 3630
Figure 3. Time history curve of lateral drift applied to columns [14].
Mander et al. [15] for concrete compression. Model has a quasi-linear pattern up to unconned strength limit (f0
co) as in Eq. (1) which is 64.1 and 62.1 MPa for HSC
columns tested by Xiao and Yun. High-strength na-ture of concrete leads to insensible transition between unconned crushing strain ("co) and stirrup-conned
crushing strain ("cc) as expressed in Eq. (2). Finally,
the strength-degrading branch of the curve is dened as in Eq. (3) with a linear descending up to 0:4 f0
cc
strength:
0 "c "co! fc= Ec"c+(f 0
co Ec"co)
"co2 "c
2; (1)
"co "c "cc! fc=f0cc (f 0 cc f0co)
("cc "co)2 ("c "cc) 2;
(2)
"c>"cc! fc=f0cc f 0 cc
"cc ("c "cc) 0:4f 0
cc; (3)
f0 cc=f0co
"
0:413+1:413 s
1+11:4 f0l
f0 co 2 f0 l f0 co # : (4)
Conned concrete strength (f0
cc) depends on the
ratio of conning pressure (f0
l) to unconned crushing
strength (f0
co) as in Eq. (4). The parameters needed
for the above equations are elastic modules (Ec) as
in Eq. (5) proposed by ACI committee 363 [1] and softening slope (). One of the necessary stages in curve denition is an appropriate selection of value. The relations proposing practical values for are based on Eqs. (6)-(8) sets:
Ec= 3320
p f0
c+ 6900; (5)
fyh 550 MPa
f0
co> 75 MPa
! = (0:048f0
co 2:14) (0:098f0 co 4:57) f0 l f0 co 1=3 (6)
fyh > 1200 MPa
f0
co 80 MPa
! = 0:07; (7)
fyh > 1200 MPa
f0
co> 80 MPa
! = 0:1: (8)
Xiao and Yun reported on the basic experimental data and the initial calculated input values for HSC concrete as shown in Table 2. These values are used as preliminary data for the evaluation of model and need further modications. Based on the calculations, the input parameters for numerical model are also evaluated and reported in the same table.
3.3. Method and simulation procedure
The mathematical expression of governing response expressed in the previous section is dened using OpenSees environment [16]. The nonlinear material response is integrated into internal integration point of elements, and then is assembled in nodal regions considering geometrical nonlinearities. The member
Table 2. HSC stress-strain curve parameters and input values for numerical model.
Parameter Notation Values Unit
Elastic modulus Ec 33.481 33.063 GPa
Poisson's ratio 0.2 {
Unconned crushing strain "co 0.3 %
Conned crushing strain "cc 0.8 0.8 % Unconned crushing stress f0
co 64.1 62.1 MPa
Conned crushing stress f0
cc 84.81 82.70 MPa Descending branch slope control 0.16 0.15 { Lateral conning pressure f0
l 4.19 4.19 MPa
OpenSees { Crushing stress fpc 84.81 82.70 MPa OpenSees { Crushing strain epsc0 0.8 0.8 % OpenSees { Failure stress fpcu 33.92 33.08 %
Figure 4. Calibration eect on compatibility of curves.
is modeled using three forced-based beam column elements that have conjugate nodes in lateral displace-ment applied level and stirrup spacing change location. Characteristic of rebar and stirrup reinforcements is expressed in STEEL02 uniaxial material code proposed by Menegotto [17] with a limitation on the ultimate rupture strain (material failure) implied by MINMAX option. The elastic modules, initial yield strength, and post-yield hardening ratio are 200 GPa, 473 MPa, and 0.5%, respectively, as reported in the original experimental data. However, the transition from the elastic to plastic branches is calibrated using 40, 0.925, and 0.15 for R0, R1, and R2 coecients, respectively.
It should be noted that higher R0values would lead to
the smoother transition in yielding threshold.
The physical model used for HSC material is assumed as CONCRETE01 proposed by Kent-Scott et al. [18], which is calibrated using compressive test data. However, calculated values are the preliminary data for analysis because HSC has lower ductility than NSC, which leads to calibration of degrading slope in detail. Due to the lack of material test data in Xiao and Yun research, the load-deection curve of column is used for calibration of additional material parameters. The elastic modulus (Ec), unconned
("co) and conned ("cc) crushing strains, conned axial
strength (f0
cc), descending branch slope control (), and
lateral conning pressure (f0
l) are calculated based on
the subsequent load-deection curve shown in Figure 4. This gure shows the details of consecutive iterations made for primary calibration.
Geometric nonlinear response of column is to be modeled exactly as applied to the experiment. For this purpose, the second-order axial force (P-) eect is considered by means of axial load equal to 0.2 and 0.33 of nominal axial strength for 1 and FHC-2 columns, respectively. Axial load is applied at the top elevation of column in the numerical model and its time history is dened as constant over analysis domain. Integration of internal forces for column section is conducted by a section ber approach. The
current method discretizes the section into nite areas where strain is calculated according to the dened uni-axial curve data and strain distribution along section domain. The patches for reinforcement and concrete volume are dened separately according to dimensional properties of test members. Generated element of HSC members is a nonlinear beam column with ve integration points. Two types of data recorders for displacement in loading point (top) and base reaction (bottom) are generated. The load pattern of the lateral displacement is linear with respect to time and has a cyclic regime. Loop calculation is dened for lateral load cycles, having displacement control theory for integrator module and being repeated three times for each drift ratio.
3.4. Simulation results and modication of model
Based on the primary numerical results, cyclic response of FHC-1 and FHC-2 members is calculated, as shown in Figures 5 and 6. In order to compare the accuracy and validity of the developed models, the experimental data acquired by Xiao and Yun are plotted along with the results. Regarding the gures, the post-peak softening of HSC members depends on post-yielding slope of concrete material dened by parameter. Due to the lack of material test data in the selected experimental pilot, member's response is analyzed with only a change in factor value, and stress-strain curve for each assumed value is generated. FHC-1 curve has a conrming estimation of peak resisted base shear (Vf) equal to 683.60 kN and 2.7% lateral drift;
these parameters for FHC-2 are 748.00 kN and 2%, respectively. The current phenomenon shows that the stress-strain curve acquired by Eqs. (1) and (2) gives identical results of HSC material. However, softening curve dened by Eq. (3) governs the backbone curve of members. Therefore, the ductility factor calculated for each assumed factor needs to be analyzed and compared to the existing experiment value.
Figure 5. Hysteresis load-displacement curves of FHC-1 column with various factors.
Figure 6. Hysteresis load-displacement curves of FHC-2 column with various factors.
proposed relations as in Eqs. (6)-(8) do not cover all the ranges of f0
c and fy. Bing et al. [7] also mentioned
this case in a study as the necessary investigation for factor determination of HSC. The selected values for factor cover the range between minimum (0.07)
and maximum (0.25) for FHC-1, and the load curve for each case is extracted using a numerical method. Furthermore, while minimum value for is constant in FHC-2, maximum range changes to 0.22. Results show a non-uniform variation of post-peak softening
Figure 7. Envelope load-displacement curves for all columns with various factors.
with respect to increase. Successive calculations proposed factor equal to 0.16 and 0.15 for FHC-1 and FHC-2, respectively. Within this assumption, acceptable accuracy is achieved which provides 7.3% ultimate drift and 470 kN force level, as reported exactly in the experiment. According to various values, stress-strain curves used in this research are shown in Figure 7. As the results show, within the increment in value, the concrete post-yield slope increases and this phenomenon controls the ductility of HSC. This observation is reported in Table 3. The study of the eect of value on peak stress proved that it does not have sensible impact on the peak stress. However, the deformation ductility has close relation with the assumed value.
Table 3. Eect of value on ultimate ductility.
Specimens Procedure u=y
FHC-1 Numerical 0.16 2.67 Experimental | 2.44
FHC-2 Numerical 0.16 2.0 Experimental | 2.1
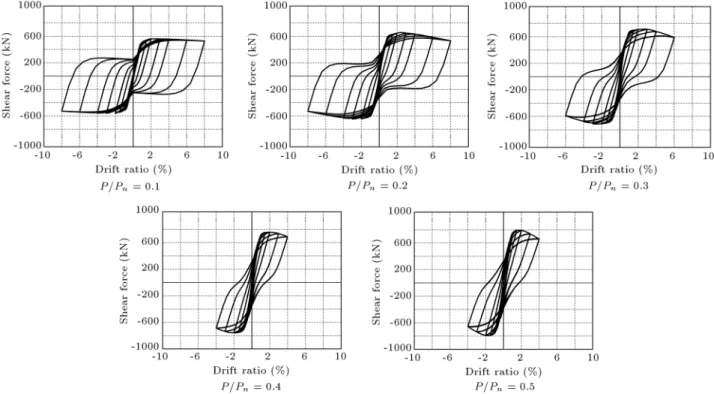
4. Parametric study 4.1. Axial force eect
One of the important parameters in the assessment of energy dissipation is the axial force ratio. In order to estimate the energy-dissipation capacity of columns and their hysteretic behavior, variable axial force values are applied with respect to section nominal strength (Pn) that is estimated as 13950 kN in the research
of Xiao and Yun. The relative value of these loads begins from 10% up to 50% of the section strength with 0:1Pn rise step. For the accurate and better
evaluation of the column behavior, authors applied a collapse criterion based on the strength decay as 20% of ultimate shear force (0:2Vn). The extracted data
curves are demonstrated in Figure 8 with respect to the axial force increase. In the rst step, the peak resisted base shear is 563 kN for 2% lateral drift in the column with 0:1Pn axial force, and the column is also stable
for further lateral drift values. The ultimate dissipated energy for this case is 1418 kN.m without any strength loss up to 8% drift.
A further increase in axial load up to 0:2Pn
leads to 658 kN shear capacity of column at 2.4% lateral drift. Here, the axial load increases the load-carrying capacity and ductility of HSC column by the simultaneous concrete crushing and rebar yielding. In this case, column starts to dissipate 1394 kN.m energy level with a slight strength decrease due to the second-order axial force eect. In advance, a further increase in axial force value up to 0:3Pnresults in the apparent
decrease in energy dissipation of member to 840 kN.m and the ultimate drift to 6%, although the shear strength is increased up to 720 kN. Additional increase of the axial force to 0:4Pn and 0:5Pn just leads to the
shear capacity of 760 kN and 790 kN, respectively, along with a dissipated energy decrease to 480 kN.m and 470 kN.m, respectively. It is observed that axial load increase aects the energy dissipation capability of HSC members in a major manner; therefore, such members are sensitive to the second-order eect. The drop ratios of absorbed energy value are 0:3Pn, 0:4Pn,
and 0:5Pn; consequently, axial force ratios are 40%,
60%, and 70% with respect to 0:1Pn case. In order to
analyze the sensitivity of HSC columns to rebar ratio and axial force value, further numerical models are generated and compared to the analogous case with NSC columns along with 30 MPa concrete crushing strength in advance.
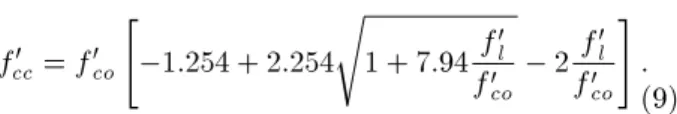
4.2. Rebar ratio and crushing strength eects In order to have a better understanding of the eect of
concrete strength on the hysteresis behavior, additional data with normal strength concrete is provided. NSC models obey the proposed model of Mander et al. [15] for stress-strain curve as expressed in Eq. (9):
f0 cc= f0co
"
1:254 + 2:254 s
1 + 7:94 f0l
f0 co 2
f0 l
f0 co
# : (9) The longitudinal reinforcement ratio () is also consid-ered as 1.3%, 2.6%, and 3.9% values in order to consider the interaction of concrete and steel strengths in the calculation of the shear capacity and feasible energy dissipation. In addition, the axial force ratio is consid-ered as 0:24Pn and 0:38Pn values in the dimensionless
form, not the same as the considered values in the previous section, to investigate the ductility sensitivity of HSC and NSC columns.
The extracted data for the assumed parameters are plotted in Figure 9 for the shear strength history of HSC and NSC columns versus lateral cyclic drifts. Data are reported in Table 4 considering various con-crete strengths, rebar ratios, and axial force ratio. For NSC and HSC columns with 0:24Pn axial force ratio
(1600 kN and 3300 kN, respectively), it was detected that the NSC column with the same rebar ratio as HSC member has a better energy-dissipation than the HSC column. In addition, the pinching of HSC column's hysteresis curve is increased which approves the lower energy dissipation of the member. Rebar
Table 4. Calculated response parameters of NSC and HSC column members.
Specimens Axial force ratio Rebar ratio Shear capacity Peak drift Dissipated energy
(%) (kN) (%) (kN.m)
HSC-1 0.24 1.3 458.4 2.4 365.2
HSC-2 0.24 2.6 635.4 2.7 711.9
HSC-3 0.24 3.9 811.5 3.0 1736.4
HSC-4 0.38 1.3 542.0 1.8 202.6
HSC-5 0.38 2.6 691.0 2.0 391.8
HSC-6 0.38 3.9 843.1 2.4 1045.0
NSC-1 0.24 1.3 321.2 2.4 600.2
NSC-2 0.24 2.6 501.1 3.0 1164.2
NSC-3 0.24 3.9 677.4 3.2 1704.6
NSC-4 0.38 1.3 357.7 2.7 355.33
NSC-5 0.38 2.6 520.6 3.0 1136.6
NSC-6 0.38 3.9 679.3 3.6 1669.2
Figure 10. Shear strength of HSC and NSC columns with respect to axial load and rebar ratios.
ratios are 1.3%, 2.6%, and 3.9%. Considering the eect of rebar ratio in the study, it was seen that rebar ratio is one of the signicant parameters in HSCs. This result explains that we need to increase the maximum rebar ratio (max) of HSC members with respect to
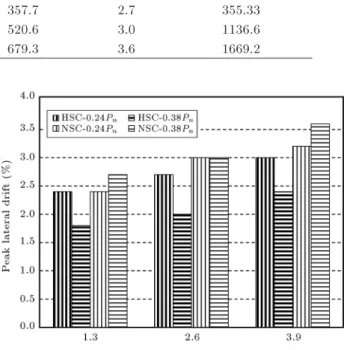
the limit which is dened for the normal strength elements. Since the high-strength concrete has more brittle response than the normal strength concrete, we need further rebar ratio to provide the demand ductility in high strength concrete elements. Hence, in contrast to the idea that the maximum rebar ratio is almost constant to the column elements, the designers of high strength members should extend the rebar ratio in order to provide the required energy dissipation during the earthquake excitation. Rebar ratio eect is shown in Figure 9 regarding hysteresis response and in Figure 10 regarding the ultimate resisted shear force. Ultimate shear strength (Vn), peak lateral drift
(), and total dissipated seismic energy (UI) are
plotted in Figures 10-12, respectively, versus concrete
Figure 11. Peak lateral drift of HSC and NSC columns with respect to axial load and rebar ratios.
grade (NSC and HSC), axial force ratio (P=Pn), and
the rebar ratio (). As shown in Figure 9, the shear strength of column is increased when we change the concrete grade from NSC to HSC. In the next stage, within the raise of the axial force ratio, it was seen that the shear strength of column is increased. However, the eect of axial force ratio is more intuitive for the low rebar ratios, meaning that within the increase in the axial force ratio of the low rebar amount, columns have better seismic performance and energy dissipation. In the nal stage, the shear strength of column is increased when we increase the rebar ratio. However, the HSC columns are more sensitive to the rebar ratio parameter than NSC ones. In other words, HSC columns need higher reinforcement ratio than NSC ones in order to provide the required strength and energy dissipation demand.
We have plotted the variation of the peak lateral drift versus the aforementioned factors in Figure 11.
Figure 12. Absorbed seismic energy of HSC and NSC columns with respect to axial load and rebar ratios.
In the rst stage, it was seen that for a constant rebar ratio, the NSC column has better performance than HSC one. In addition, it was seen that the peak lateral drift in the HSC columns is decreasing when we increase the axial force ratio. However, this observation is in the reverse order for NSC columns. Finally, the increase in the rebar ratio results in the increase of the peak lateral drift in both of the concrete types. We have the maximum resisted lateral drift for 3.9% rebar ratio. We investigated the dissipated energy level versus the aforementioned parameters in Figure 12 for conclusion improvement in advance. Primarily, it was seen that the energy absorption is decreasing for concrete strength increase. However, this observation is not true for 3.9% rebar ratio. It means that we need to provide higher reinforcement ratio for HSC columns to dissipate higher energy than NSC ones. The absorbed energy decreases, while the axial force level increases; this is more apparent in HSC columns than the NSC ones. Analogous to the conclusion made for the peak lateral drift parameter, the absorbed energy increases when we provide high rebar ratio. Overall conclusion is the requirement of higher rebar ratio for HSC column in order to provide better energy dissipation and ductility with respect to NSC columns.
5. Conclusions
The current research work deals with the seismic characteristics of the high strength concrete column subjected to lateral displacement cycles. We have provided the numerical models for initial validation of the existing experimental results, and then revised the governing stress-strain curve in order to improve the validity and accuracy of the developed nonlinear models. Results recommend that softening slope of the high strength concrete materials should be modied in order to approve the experimentally recorded ductility
and energy dissipation. In addition, we extended the models for normal strength and high strength concrete columns with variable axial force and reinforcement ratios in order to investigate the response sensitivity. The general conclusions made from the current research work can be mentioned as in the following topics:
1. The increase in the concrete grade and axial force ratio results in shear strength enhancement of col-umn. However, the peak lateral drift and dissipated seismic energy decrease. Therefore, it is required to provide higher reinforcement ratio than code-dened value in HSC to conrm the response perquisite;
2. The increase of rebar ratio results in the improve-ment of ultimate shear strength, peak lateral drift, ductility and absorbed energy in HSC columns;
3. HSC columns can be an appropriate choice for special structures only if the lateral drift and absorbed energy are controlled by the existing code regulations;
4. Assuming analogous rebar ratio for HSC and NSC columns, NSC members can be more ecient than HSC in high-risk seismic zones;
5. The current study proposes a new modied concrete stress-strain curve, considering linear interpolation between factors presented in the previous research works for intermediate-strength HSC materials.
Nomenclature
d Rebar diameter fy Yield stress
f0
co; fc0 Unconned Concrete compressive
strength P Axial force
"co Unconned concrete strain
"cc Conned concrete strain
Ec Concrete modules of elasticity
Descending sloop control f0
l Lateral conning pressure
f0
cc Conned concrete compressive strength
Vf Peak resisted base shear
Pn Section nominal strength
max Maximum rebar ratio
Vn Ultimate shear strength
Longitudinal reinforcement ratio Poisson ratio
Peak lateral drift
L Elevation between lateral force point and foundation surface
R0; R1; R2 Transition from elastic to plastic
branch coecient
UI Dissipated seismic energy
References
1. ACI Committee 363 \State-of-the-art report on high-strength concrete (ACI 363R-84)", American Concrete Institute (1984).
2. Sugano, S., Nagashima, T., Kimura, H. and Tamura, H. \Experimental studies on seismic behavior of high strength concrete columns laterally reinforced with high strength steel bars", Proceedings of the 9th WCEE, Tokyo, Kyoto (1988).
3. Xiao, Y. and Martirossyan, A. \Seismic performance of high-strength concrete columns", Journal of Structural Engineering, 124(3), pp. 241-251 (1998).
4. ASCE-ACI Task Committee 426 \The shear strength of reinforced concrete members", Journal of the Struc-tural Division, Proceedings of the American Society of Civil Engineers (3rd), 99, pp. 1091-1187 (1973).
5. ACI Committee 318 \Building code requirements for structural concrete (ACI 318M-02) and commentary (ACI 318RM-02)", Metric Version, American Concrete Institute (2002).
6. Ashour, S.A. \Eect of compressive strength and tensile reinforcement ratio on exural behavior of high-strength concrete beams", Engineering Structures, 22(5), pp. 413-423 (2000).
7. Bing, L., Park, R. and Tanaka, H. \Stress-strain behavior of high-strength concrete conned by ultra-high-and normal-strength transverse reinforcements", ACI Structural Journal, 98(3), pp. 395-406 (2001).
8. Kabir, M.Z. and Shafei, E. \Plasticity modeling of FRP-conned circular reinforced concrete columns subjected to eccentric axial loading", Composites Part B: Engineering, 43(8), pp. 3497-3506 (2012).
9. Woods, J.M., Kiousis, P.D., Ehsani, M.R., Saadat-manesh, H. and Fritz, W. \Bending ductility of rect-angular high strength concrete columns", Engineering Structures, 29(8), pp. 1783-1790 (2007).
10. Ho, J.C.M., Lam, J.Y.K. and Kwan, A.K.H. \Eec-tiveness of adding connement for ductility improve-ment of high-strength concrete columns", Engineering Structures, 32(3), pp. 714-725 (2010).
11. Lu, Z.H. and Zhao, Y.G. \Empirical stress-strain model for unconned high-strength concrete under uniaxial compression", Journal of Materials in Civil Engineering, 22(11), pp. 1181-1186 (2010).
12. Ozbakkaloglu, T. \Behavior of square and rectangular ultra-high-strength concrete-lled FRP tubes under axial compression", Composites Part B: Engineering, 54(1), pp. 97-111 (2013).
13. Kottb, H.A., El-Shafey, N.F. and Torkey, A.A. \Be-havior of high strength concrete columns under eccen-tric loads", HBRC Journal, 11(1), pp. 22-34 (2015).
14. Xiao, Y. and Yun, H.W. \Experimental studies on full-scale high-strength concrete columns", ACI Structural Journal, 99(2), pp. 199-207 (2002).
15. Mander, J.B., Priestley, M.J. and Park, R. \Theoret-ical stress-strain model for conned concrete", ACI Journal of Structural Engineering, 114(8), pp. 1804-1826 (1988).
16. OpenSees, Open System for Earthquake Engineering Simulation, Pacic Earthquake Engineering Research Center, 2.4.6 (rev 6022), Copyright 1999-2013, The University of California, Berkley (2013).
17. Menegotto, M. \Method of analysis for cyclically loaded RC plane frames including changes in geometry and non-elastic behavior of elements under combined normal force and bending", In Proc. of IABSE Sym-posium on Resistance and Ultimate Deformability of Structures Acted on by Well-Dened Repeated Loads, pp. 15-22 (1973).
18. Scott, B.D., Park, R. and Priestley, M.J.N. \Stress-strain behavior of concrete conned by overlapping hoops at low and high strain rates", ACI Journal, 79(1), pp. 13-27 (1982).
Biographies
Farzin Vahid-Vahdattalab received his MSc degree in Structural Engineering from the Urmia University of Technology, Urmia, Iran, in 2015. Presently, he is working on the high strength reinforced concrete columns under supervision of Dr. Erfan Shafei and Dr. Javad Mokari Rahmdel with focus on the nonlinear dynamic characteristics.
Javad Mokari Rahmdel received his PhD degree in Earthquake Engineering from the International In-stitute of Earthquake Engineering and Seismology, Tehran, Iran, in 2009. Since then, he has been with Urmia University of Technology as an Assistant Professor in Civil Engineering Department, where he is currently the Administrative and Support specialist. Erfan Shafei received his PhD degree in Structural Engineering from the Amirkabir University of Tech-nology (Tehran Polytechnic), Tehran, Iran, in 2013. Since then, he has been with the Urmia University of Technology as an Assistant Professor in Civil Engineer-ing Department, where he is currently the Director of Civil Engineering Department. His research interest is on the nonlinear response assessment of semi-brittle materials.
![Figure 1. Detail of column specimens tested by Xiao and Yun [14].](https://thumb-us.123doks.com/thumbv2/123dok_us/8375066.2224549/3.892.501.802.148.443/figure-column-specimens-tested-xiao-yun.webp)
![Figure 3. Time history curve of lateral drift applied to columns [14].](https://thumb-us.123doks.com/thumbv2/123dok_us/8375066.2224549/4.892.79.407.151.358/figure-time-history-curve-lateral-drift-applied-columns.webp)