The impact of dose calculatıon algorıthms for
perıpheral dose dıstrıbutıons of enhanced dynamıc
and physıcal wedges
INTRODUCTION
The peripheral dose is the radiation dose received at points beyond the collimated radiotherapy ield edge. So as to ensure that radiosensitive tissues outside of the beam do not receive doses approaching their tolerance levels, detailed knowledge of magnitude and spatial distribution of the peripheral dose may be
The peripheral radiation dose can be
important clinically, potentially affecting
cataract formation, gonadal function and fertility. The peripheral dose can also be responsible for exposure to the fetus in a pregnant woman, and dose to breast and other
tissues for which radiation induced
carcinogenesis may be concern (2).
The Varian Eclipse (Varian Medical Systems, Palo Alto, CA) version 8.6 treatment planning
H. Acar
1*, G. Yavas
1, C.Yavas
21Department of Radiation Oncology, Selcuklu Faculty of Medicine, Selcuk University, Turkey 2Department of Radiation Oncology, Konya Training and Research Hospital, Turkey
ABSTRACT
Background: In radia on therapy, the peripheral dose is important when anatomical structures with very low dose tolerances are involved. In this study, the two available calcula on algorithms of the Varian Eclipse 8.6 treatment planning system(TPS), the anisotropic analy c algorithm (AAA) and pencil-beam convolu on (PBC) was used to compare measured and calculated peripheral dose distribu on of physical wedged (PW) and enhanced dynamic wedged fields (EDW). Materials and Methods:Peripheral dose measurements were carried out for 6 and 18 MV photons using a 0.6cc Farmer-type ioniza on chamber in the slab phantom. Measurements were performed using 15°, 30°, 45° and 60° PW and EDW for three different field sizes at dmax and up to a maximum distance of 50 cm beyond the field edges. peripheral dose was further computed using two different algorithms of a TPS. The measured and calculated datas were then compared to find which algorithm calculates peripheral dose distribu on more accurately. Results: Both algorithms from the TPS adequately model the peripheral dose distribu on up to 45 degrees. For large field sizes with 600 EDW, the largest devia on between calculated and measured dose distribu on is less than 3.5% using the AAA, but can increase up to 9.7% of the distribu on using PBC. Conclusion: The AAA models wedged peripheral dose distribu ons more accurately than the PBC does for all studied condi ons; the difference between the algorithms are more significant for large wedge angles and large field sizes. It must be emphasized that the use of PBC for planning large-field treatments with 600 EDW could lead to inaccuracies of clinical significance.
Keywords: Physical wedge, enhanced dynamic wedge, peripheral dose distribution, calculation algorithms, AAA, PBC .
*Corresponding author: Dr. Hilal Acar,
Fax:+ 90 212 446 16 08
Email:[email protected]
Revised: March 2015
Accepted: April 2015
Int. J. Radiat. Res., January 2016; 14(1): 17-24
► Original article
DOI: 10.18869/acadpub.ijrr.14.1.17
calculation methods: one based on the superposition of energy deposition kernels of
pencil beams (PBC)(3), and one uses
pre-calculated Monte Carlo simulations based on a convolution model Analytical Anisotropic
Algorithm (AAA) (4,5). PBC algorithm uses
experimental measurements as part of the beam
con iguration (6). In contrast, AAA, the pencil
beams are compiled from previous Monte Carlo (MC) calculations and then adjusted to it
measurements (7–11). Thus, in both cases,
accurate dose calculation is dependent on the introduction of accurate measured data in the system.
However, TPSs are not commissioned for
out-of- ield dose calculations (12, 13) and the
accuracy of TPS dose calculations is known to decrease beyond the borders of the treatment ields. Also, the true accuracy of speci ic TPSs for out-of- ield dose is not well documented in the
literatüre (14). As far as we know there is no
study that examine of accuracy of the treatment planning system algorithms for the wedged peripheral dose distribution.
The main purpose of this paper was to investigate the accuracy of dose calculation algorithms of Eclipse TPS for out of ield doses. The peripheral dose distribution of physical wedge (PW) and Enhanced Dynamic Wedge (EDW) were measured using 0.6 cc farmer type ionization chamber. The measured datas were then compared with those calculated by the TPS using the PBC and the AAA.
MATERIALS
AND METHODS
Ionization chamber measurements
Varian Clinac-DHX (Varian Medical Systems, Palo Alto, CA) linear accelerator which is equipped with two different types of wedges was used in this study. Peripheral dose
measurements were performed using a 0.6 cm3
Farmer-type ionization chamber (PTW 30010,
PTW, Friedberg, Germany) inserted into a
40 × 15 × 120 cm3 (width × height × length)
water-equivalent plastic phantom (RW3 Slab phantom, PTW, Friedberg, Germany). Great care was taken to ensure that there was no air gap
while aligning the slabs. The chamber was connected to a calibrated electrometer (PTW Unidos Webline, Friedberg, Germany). For all measurements, the ionization chamber was placed at a depth of dose maximum in the phantom (midplane) at 100 cm source to surface distance (SSD) for 6 MV and 18 MV photons. In
general, published data (15,16) show that the
depth dependence of peripheral dose
distribution is small. Therefore, measurements
were made only at the dose maximum depth (1.5 cm for 6 MV and 3.5 cm for 18 MV). All
measurements were done using farmer type ionization chamber to avoid systematic errors due to different measurement techniques.
In this study 15°, 30°, 45° and 60° physical and enhanced dynamic wedges were used. The 15° and 30° PW were made of Fe (cold-rolled steel)
with nominal density of 7.8 g/cm3 whilst 45° and
60° were made of Pb (lead-calcium-tin alloy)
with nominal density of 11.3 g/cm3. Varian EDW
(Varian Medical Systems, Palo Alto, CA) consists in the simulation of a PW by moving one of the Y collimator jaws during the irradiation with variable speed from its maximum open position to 0.5 cm of the opposite jaw and adjusting dose rate during treatment.
The ield size was maintained as 5 × 5 cm 2, 10
× 10 cm 2 and 15 × 15 cm 2. The peripheral doses
were measured from 0.5 cm up to 50 cm distances from the geometric ield edge in increments of 0.5 cm at the heel side of the
wedge ield. The collimator angle was 00. Each
measurement was repeated three times and the mean value of the readings were noted. The standard error was found to be within 1%. All the datas were normalized to central axis at depth of dose maximum. The linear accelerator output was checked and monitored on a daily basis before each set of measurements.
As pointed out in the TG – 36 (17) report, the
contribution of neutrons to the total peripheral dose is small near the beam edge. The National
Council of Radiation Protection (18) considers the
risk of long-term biological effects of incidental from the linear accelerator to be negligible. Because of this reason, these measurements did not account for dose contributions from photoneutrons.
External beam treatment planning calculations
The TPS calculation algorithm accuracy was evaluated by comparing measurements and
calculations performed under the same
conditions, based on a phantom imaged by CT.
The 40×15×120cm3 water-equivalent plastic
phantom was imaged by a computerized tomography (Toshiba Aquilion; Toshiba Medical
Systems, Japan) to obtain three dimensional
(3D) image data sets of 3 mm slices and transferred to the 3D TPS.
The PW and EDW beams were created with the collimator and gantry orientation as in solid water phantom and appropriate ield size,
wedge angle, weight point de inition,
normalization, etc, imitating the measurements under real conditions in solid water phantom. All plans were initially calculated with a PBC
algorithm. Plans were then recomputed
(keeping everything same) within Eclipse using AAA. All calculations were performed on 2 mm dose grid.
The AAA is one of the models that
incorporate electron transport for dose
calculation. It is a three-dimensional
PBC/superposition algorithm that uses Monte
Carlo-derived scatter kernels tomodel primary photons (primary source), scattered extra focal photons and electrons scattered from the beam
limiting devices (electron contamination
source). The primary source is the point source located at the target plane. It models the bremsstrahlung photons created in the target that do not interact in the treatment head. The extra-focal source is a Gaussian plane source located at the bottom plane of the lattening ilter. It models the photons that result from interactions in the accelerator head outside the target, primarily in the lattening ilter, primary collimators and secondary jaws. Electron contamination is modeled with a depth-dependent curve that describes the total amount of electron contamination at a certain depth. The inal dose distribution is computed by the superposition of the dose calculated by the photons and electron convolutions. The kernels are calculated using a sum of six depth-dependent weighted exponentials, de ining the
lateral scattering in order to it the Monte
Carlo-derived pencil beam scatter (19). A more detailed
description of the algorithm can be found in the study made by Tillikainen L et al. (20).
The resulting calculated plans were analyzed taking into consideration the point doses on dose maximum depth. The peripheral doses were recorded from the TPS using two different algorithms and compared with the measured values.
RESULTS AND DISCUSSION
Figures 1a-c show the measured percentage peripheral dose distribution for different wedge ilters between 0.5 cm to 50 cm distance from the ield edge at the heel side of the wedge ield at 1.5 cm depth of 6 MV photons for 5×5 cm2,
10×10 cm2 and 15×15 cm2 ields respectively.
For 18 MV, the same data were shown in igures 2 a-c. Three conclusion can be easily drawn from these igures. First, peripheral dose increases with the increase in ield size. This means that peripheral dose is dependent on ield size. The variation with ield size is signi icant only for small ields. The percentage difference between
5×5 cm2 and 10×10 cm2 is much larger than the
difference between 10×10 cm2 and 15×15 cm2
ields. Secondly, peripheral dose is dependent on energy. As energy increases peripheral dose decreases. Finally, the peripheral dose is less for the EDW when compared to the physical wedges. One of the reason for that lies in scatter outside the hard wedged ield, due to the interaction of the beam with the material of the mechanical wedge. Clinically, this is an advantage of EDW wedged ield. Another reason could be that EDW is placed at a considerable distance from patient and it does not have varying physical thickness as that of the physical wedge. The differential thickness across the physical wedge would result in more scattered radiation being produced.
EDW ields in general use less monitor units than PW ields, although beam-on time may be larger for large wedge angles with large ield sizes due to a variable dose rate being used for EDW ields. It would be expected that physical
wedged peripheral dose distributions would be approximately two times larger than EDW peripheral dose distributions due to an increase in leakage radiation which is related to increased MUs. Furthermore, it is expected that these differences would be observed at longer distances from the ield edge, where the leakage
radiation dominates (21-23). Data presented here
supports this expectation. Physical wedged peripheral dose distributions are comparable to EDW peripheral dose distributions at distances
less than 10 cm from the ield edge and become almost two times greater at longer distances. This is due to approximately equivalent internal scatter contribution for EDW and PW ields. Also, the wedge provides additional shielding for collimator scatter and leakage radiation in comparison to EDW ields. The effect of this shielding is largest underneath the wedge and close to the ield edge and eventually becomes smaller at distances far from the ield edge.
Figure 1. The measured percentage PD distribu on for different wedge filters between 0.5 cm to 50 cm distance from the field edge at the heel side of the
wedge field at 1.5 cm depth of 6 MV photons for A) 5x5 cm2; B) 10x10 cm2, C) 15x15 cm2.
A B C
A B C
Figure 2. The measured percentage PD distribu on for different wedge filters between 0.5 cm to 50 cm distance from the field edge at the heel side of the wedge field at 1.5 cm depth of 18 MV photons for
A) 5x5 cm2; B) 10x10 cm2, C) 15x15 cm2.
This is important information when choosing wedge ilters for treatment of patients with radiosensitive structures such as eye lens, thyroid gland, gonads, fetus, etc. which need to
be protected. The data presented here
demonstrates that the use of EDW with a small wedge angle is a good choice for the treatment of these patients. The dose to critical structures located near the ield edge may be comparable to open ield doses. However, the whole body dose will be higher for EDW ields.
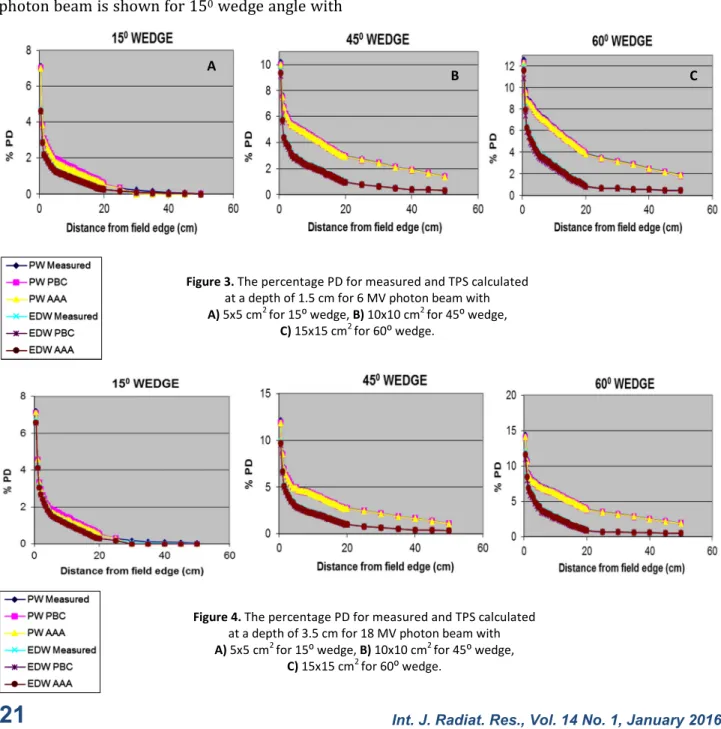
The measured and TPS calculated percentage peripheral dose at a depth of 1.5 cm for 6 MV
photon beam is shown for 150 wedge angle with
5×5 cm2 ield in igure 3(a). The percentage
peripheral dose of 450 wedge angle with 10×10
cm2 ield size and that of 600 wedge angle with
15×15 cm2 ield size are shown in igure 3(b)
and igure 3(c) respectively.
The measured and TPS calculated percentage peripheral dose at a depth of 3.5 cm for 18 MV
photon beam is shown for 150 wedge angle with
5×5 cm2 ield in igure 4(a). The percentage
peripheral dose of 450 wedge angle with 10×10
cm2 ield size and that of 600 wedge angle with
15×15 cm2 ield size are shown in igure 4(b)
and 4(c) respectively.
A
B C
Figure 3. The percentage PD for measured and TPS calculated
at a depth of 1.5 cm for 6 MV photon beam with
A) 5x5 cm2 for 15⁰ wedge, B) 10x10 cm2 for 45⁰ wedge,
C) 15x15 cm2 for 60⁰ wedge.
Figure 4. The percentage PD for measured and TPS calculated
at a depth of 3.5 cm for 18 MV photon beam with
A) 5x5 cm2 for 15⁰ wedge, B) 10x10 cm2 for 45⁰ wedge,
C) 15x15 cm2 for 60⁰ wedge.
The variation can be explained by taking into account the fact that the PBC calculates the wedged distribution using a superposition of many rectangular ields without considering
extrafocal radiation(24). The fact that many open
ields are superposed to model the EDW, considering that inaccuracies are a consequence of the open ield modeling, yields greater inaccuracies for this kind of treatment. On the other hand, the AAA calculates the open- ield distribution considering primary and extrafocal
radiation from head-scatter effects(25,26.
Therefore, because the open- ield modeling is better with the AAA, wedged dose distributions calculated with this algorithm (by the same method as the PBC) are closer to measured ones.
Howel and et al[14] investigates the accuracy of
out of ield dose calculation by Eclipse and
resulted that The Eclipse AAA models
extra-focal photon radiation (all photons
emerging from outside the target) using a inite-size virtual source (referred to as the
second source). The second source has a Gaussian intensity distribution. According to the
Eclipse manual(27) the second source energy
luence is de ined at an arbitrary plane and is computed by adding the contributions from each element of the source for each pixel in the destination luence array. The contribution is scaled by the Gaussian weight of the source element, by the inverse square of the distance between the elements at the source and destination planes, and by the cosine of the ray angle. They concluded that in contrast to how the out-of- ield dose is modeled in Eclipse, the out-of- ield dose is actually composed of scatter and leakage radiation and is underestimated by the Gaussian intensity distribution. The inding of this study supports their results.
In all cases, it is easy to note that the AAA models the dose distribution more accurately than the PBC does. Both algorithms from the TPS
adequately model the peripheral dose
distribution up to 45 degrees. For large ield sizes with 60 degrees EDW, the largest deviation
between calculated and measured dose
distribution is less than 3.5 % using the AAA, but can increase up to 9.7 % of the distribution using PBC.
It is seen from the igures 3 and 4 that the most important difference between the two algorithms can be observed at 0.5 cm distance from the ield edge as the distance from the ield edge increase the difference decreases. The difference between the calculation algorithms increases for larger wedge angles and larger ield sizes. There is slight decrease in difference
between calculation algorithms and
measurements with increasing beam energy.
The TPS calculated peripheral dose
underestimate the measured ones.
It is concluded from the igures 3 (a) - (c) that for physical wedges and 6 MV photon energy, max 2.8 % difference is observed between measurement and PBC calculated percentage peripheral dose for 60 degree wedge
with 15×15 cm2 ield. The difference is 1.9 % for
the same ield size and wedge angle if AAA algorithm is used. The difference between the measured and calculated peripheral dose decreases with decreasing ield size and wedge angles. The minium difference is 1.2 % for PBC
algorithm when 15 degree wedge and 5×5 cm2
ield size is used. There is no signi icant change in difference between measurements and calculation algorithms for 18 MV as it can be seen from igure 4 (a) - (c).
It is seen from the igures 3 (a) - (c) that for enhanced dynamic wedges and 6 MV photon energy maximum 9.7 % and 3.5 % differences
are found for 600 wedge with 15×15 cm2 ield
between measurement and calculation
algorithms PBC and AAA calculated percentage peripheral dose respectively. The difference between the measured and calculated peripheral dose decreases with decreasing ield size and wedge angles. The minimum difference is 2.5 % for PBC algorithm and 2 % for AAA algorithm
when 150 wedge and 5×5 cm2 ield size was
used.
For 18 MV, there is a slight decrease in difference between measured and calculated peripheral dose as it can be seen from igure 4 (a) - (c). The maximum differences are 8.5 % and 3.1 % for PBC and AAA algorithms respectively
for 600 wedge with 15×15 cm2 ield. The
minimum 2.2 % and 1.8 % are differences are
seen for 150 wedge and 5×5 cm2 ield size for
PBC and AAA algorithms respectively.
CONCLUSION
In the present study, the unwanted radiation has been measured as a function of the distance outside the primary beam, ield size and beam energy. Complete knowledge of the peripheral doses is cruical in proper choice of particular wedge system in clinical use.
The study concluded that for all investigated conditions, the AAA models wedged dose distributions more accurately than the PBC does; the difference between the algorithms are more signi icant for large wedge angles and large ield sizes. It must be emphasized that the use of PBC for planning large- ield treatments
with 600 EDW could lead to inaccuracies of
clinical signi icance.
Con licts of interest: none to declare.
REFERENCES
1. McParland BJ and Fair HI (1992) A method of calcula ng peripheral dose distribu ons of photon beams below 10 MV. Med Phys, 19(2): 283-293.
2. Antypas C, Sandilos P, Kouvaris J, Balafouta E, Karinou E, Kollaros N, Vlahos L (1998) Fetal dose evalua on during
breast cancer radiotherapy. Int J Radia on Oncology Biol
Phys, 40(4): 995-999.
3. Storchi P and Woudstra E (1996) Calcula on of the absorbed dose distribu on due to irregularly shaped photon beams using pencil beam kernels derived from basic beam data. Phys Med Biol, 41 (4): 637–656.
4. Fogliata A, Nicolini G, VaneD E, Clivio A, Cozzi L (2006) Dosimetric evalua on of anisotropic analy cal algorithm for photon dose calcula on: fundamental characteriza on
in water. Phys Med Biol, 51(6):1421–1438.
5. Aspradakis MM, Morrison RH, Richmond ND, Steele A
(2003) Experimental verifica on of convolu on/
superposi on photon dose calcula ons for radiotherapy
treatment planning. Phys Med Biol, 48:2873–93.
6. Storchi PMR, van BaIum LJ, Woudstra E (1999) Calcula on of a pencil beam kernel from measured photon beam
data. Phys Med Biol, 44:2917–28.
7. Van Esch A, Tillikainen L, Pyykkonen J, Tenhunen M, Helminen H, Siljamaki S, Alakuijala J, Paiusco M, Iori M, Huyskens DP (2006) Tes ng of the analy cal anisotropic
algorithm for photon dose calcula on. Med Phys, 33:4130
–48.
8. Bragg CM and Conway J (2006) Dosimetric verifica on of the anisotropic analy cal algorithm for radiotherapy
treatment planning. Radiother Oncol, 81: 315–23.
9. Van Esch A, Tillikainen L, Pyykkonen J, Tenhunen M,
Helminen H, Siljamaki S, et al. (2006)Tes ng of the
analy cal anisotropic algorithm for photon dose
calcula on. Med Phys, 33:4130–47.
10. Knoos T, Wieslander E, Cozzi L, Brink C, Fogliata A, Albers D, et al. (2006) Comparison of dose calcula on algorithms for treatment planning in external photon beam therapy
for clinical situa ons. Phys Med Biol, 51:5785–807.
11. Fogliata A, Nicolini G, VaneD E, Clivio A, Cozzi L (2006) Dosimetric valida on of the anisotropic analy cal algorithm for photon dose calcula on: fundamental
characteriza on in water. Phys Med Biol, 51:1421–38.
12. Aspradakis MM, Morrison RH, Richmond ND, Steele A
(2003) Experimental verifica on of convolu on/
superposi on photon dose calcula ons for radiotherapy
treatment planning. Phys Med Biol, 48:2873–93.
13. Das IJ, Cheng CW, WaIs RJ, Ahnesjo A, Gibbons J, Li XA, Lowenstein J, Mitra RK, Simon WE, Zhu TC (2008) Accelerator beam data commissioning equipment and procedures: report of the TG-106 of the therapy physics
commiIee of the AAPM. Med Phys, 35: 4186–215.
14. Rebecca M, Howell, Sarah B Scarboro, S F Kry, and Derek Z
Yaldo(2010) Accuracy of out-of-field dose calcula ons by a
commercial treatment planning system. Phys Med Biol, 55
(23): 6999–7008.
15. Van der Giessen (1994) PH Calcula on and measurement of the dose at points outside the primary beam for photon
energies of 6, 10 and 23 MV. Int J Radiat Oncol Biol Phys,
30: 1239-46.
16. Mu c S, Esthappan J, Klein EE (2002) Peripheral dose distribu ons for a linear accelerator equipped with a
secondary mul leaf collimator and universal wedge. J Appl
Clin Med Phys, 3: 302-9.
17. Stovall M, Blackwell CR, Cundiff J, Novack D, Palta JR, Wagner LK (1995) Fetal dose from radiotherapy with photon beams: Report of AAPM Radia on Therapy
CommiIee Task Group No. 36. Med Phys, 22: 62-82.
18. Na onal Council on Radia on Protec on (1980) Influence of dose and its distribu on in me on dose -response
rela onship for low-LET radia ons. Report No. 64.
Bethasda, MD.
19. Kan MWK, Cheung JYC , Leung LHT, Lau BMF, Yu PKN (2011) The accuracy of dose calcula ons by anisotropic analy cal algorithms for stereotac c radiotherapy in
nasopharyngeal carcinoma. Phys Med Biol, 56: 397–413
20. Tillikainen L, Helminen H, Tors T, Siljamaki S, Alakuijala J, Pyyry J, Ulmer W (2008) A 3D pencil-beam-based superposi on algorithm for photon dose calcula on in
heterogeneous media. Phys Med Biol, 53: 3821–39.
21. Francois P, Beurtheret C and Dutreix A (1988) Calcula on of the dose delivered to organs outside the radia on
beams. Med Phy, 15(6): 879-883.
22. Van der Gissen PH and Hurkmans CW (19930 Calcula on and measurement of the dose to points outside the
primary beam for 60Co gamma radia on. Int J Radiat Oncol
Biol Phys, 27: 717-724.
23. Greene D, F.Inst. Gou-Long Chu, DW Thomas M (1985)
Dose levels outside radiotherapy beams. Br J Radiol, 58:
543.
26. Varian Medical Systems (2005) The reference guide for Eclipse algorithms. Palo Alto (CA): Varian Medical Systems. [P/N B401653R01M]
27. Varian Medical Systems I. (2008) Eclipse Algorithms Reference Guide, Version 86. Palo Alto, CA: Varian Medical Systems.
24. Storchi P and Woudstra E (1996) Calcula on of the absorbed dose distribu on due to irregularly shaped photon beams using pencil beam kernels derived from
basic beam data. Phys Med Biol, 41(4): 637–656.
25. Sievinen J, Ulmer W, Kaissl W (2005) AAA photon dose calcula on model in Eclipse. Palo Alto (CA): Varian Medical Systems. [RAD #7170B]