113
Implementing an efficient data envelopment analysis method for
assessing suppliers of complex product systems
Omid Solgi
1*, Jafar Gheidar-Kheljani
2, Mohammad Saidi-Mehrabad
1, Ehsan Dehghani
11School of Industrial Engineering, Iran University of Science and Technology, Tehran, Iran 2School of Industrial Engineering, Malek Ashtar University Technology, Tehran, Iran
[email protected], [email protected], [email protected], [email protected]
Abstract
Reduction of complex product systems (CoPS) manufacturing costs are the main factors of sustainability and survival of the manufacturers. Choosing proper CoPS suppliers can dramatically reduce these costs and increases competitive capability for manufacturers. This is due to the fact that in the complex industries, the costs of raw materials for the production processes or the purchase of components includes a substantial part of the product costs. In this regard, in this paper, a tailored data envelopment analysis (DEA) model is deployed to assess and select the supplier of CoPS, helping to deduct these costs as well as eventuate in productivity of the products. In the proposed model, various suppliers of CoPS are evaluated based on a set of economic, technical, and geographic criteria. The suppliers are ranked in accordance with the obtained scores and then the best ones are chosen. Eventually, to examine the applicability and usefulness of the proposed method, a case study is conducted via which important managerial outcomes are extracted.
Keywords: Data Envelopment Analysis, complex product systems, supplier selection, efficient frontier, anti-efficient frontier.
1- Introduction
As the selection of the suitable suppliers has a great deal of influence on the strategic and operational efficiency of the organization, it is taken into account as a vital factor. Meanwhile, it shortens the product development cycle, enhances the products quality, alleviates inventory levels, reduces production costs, ameliorates flexibility and satisfies customers' expectations (Çebi and Otay, 2016). In view of the fact that the problem of supplier selection, which is the most basic process for finding the best supplier to buy the items required for the final product, it is incumbent upon to be investigated comprehensively (Ayhan and Kilic, 2015). Along the same lines, CoPS, goods, systems, networks, infrastructures, engineering structures, and services are at the expense of many software sectors that are critical to economic growth and modern economics (Davies and Hobday, 2005). Broadly speaking, these products can be defined as costly, having high-volume engineering and IT, including a large number of subsystems and components that are custom-made (Hansen and Rush, 1998). CoPS is one of the areas that has the most added value for the economies of the countries and increase competitive capability for manufacturers. In this manner, most countries endeavor to have a good presence in this field. Table (1) summarizes the studies done in different fields of CoPS.
*Corresponding author
ISSN: 1735-8272, Copyright c 2019 JISE. All rights reserved
Journal of Industrial and Systems Engineering Vol. 12, No. 2, pp. 113-137
114
Table 1. Examples of studies on different fields of CoPS
Example Section/industry
Airplanes (Acha et al., 2004; Davies and Brady, 1998; Hansen and Rush, 1998), airplane engine (Acha et al., 2004; Davies and Hobday, 2005; Hobday, 2000) and flight simulation (Acha et al., 2004; Davies and Brady, 1998; Davies and Hobday, 2005; Hansen and Rush, 1998; Hobday, 2000).
Aerial
Rail transport system (Acha et al., 2004; Davies and Brady, 1998; Özdemir et al., 2011) and road traffic management systems (Davies and Hobday, 2005; Dehghani et al., 2018d; Diabat et al., 2017; Sadjadi et al., 2016).
Transportation
Military Services (Davies and Brady, 1998; Davies and Hobday, 2005; Hansen and Rush, 1998), Battleship and Ground-to-air missile control units (Davies and Hobday, 2005).
Military uses
Nuclear power plant (Davies and Brady, 1998; Davies and Hobday, 2005) Electric power control systems (Davies and Hobday, 2005; Dehghani et al., 2018a) and the power distribution network (Hobday, 2000).
Energy
Semiconductor material manufacturing plant and E-commerce systems (Davies and Brady, 1998; Davies and Hobday, 2005; Hobday, 2000) and Supercomputers (Davies and Hobday, 2005).
Electronic
Sea drilling rigs (Davies and Hobday, 2005; Hansen and Rush, 1998; Hobday, 2000), chemical material plant, communication networks (Acha et al., 2004; Davies, 1996; Hobday, 2000), Racing cars (Davies and Hobday, 2005; Dehghani et al., 2016) and intelligent structure (Acha et al., 2004; Davies and Hobday, 2005; Hobday, 2000).
Other
As it can be seen, survival of any country in terms of infrastructure and technological advances in the world is depended on important and strategic products in this area. Remaining in the market for competition and their future advancement are highly interlocked to successfully present in this field. Likewise, one of the main requirements for entering is the choice of the appropriate supplier of these products, which in addition to reducing costs, elevates the competition and the speed of progress as well (Cook and Johnston, 1992; Dedehayir et al., 2014; Dehghani et al., 2018b; Hobday, 2007; Safdari Ranjbar et al., 2018). It is noteworthy that there are some economic, technical and geographical criteria that should be considered when CoPS’ supplier is chosen.
In accordance with the above-mentioned discussion, a new model of DEA is presented in this paper to select the appropriate supplier. In the proposed method, based on the aforementioned criteria, suppliers of various CoPS are evaluated. The main advantage of the implemented method is that it can increase the distinction between different options by means of efficient and anti-efficient frontier information. Lastly, in a bid to assess the applicability and usefulness of the proposed method, a case study is carried out through which useful managerial outcomes are obtained.
This article is organized as follows. In the next section, the relevant literature is reviewed. In section 3, the necessity and importance of the concerned area are elaborated. Section 4, offers the used DEA model. In section 5, a case study is carried out and finally, the conclusions and avenues for the future researches are presented in section 6.
115
2- Literature review
In recent years, many attempts have been published to develop and optimize supplier selection models. These studies encompass the wide scope of models ranged from simple linear single product for deterministic problems. DEA, as a powerful optimization tool, is a mathematical model in order to assess the performance of homogeneous decision-making units (DMUs) according to the available data. This method is known as a non-parametric approach and it has been broadly exploited for the goal of selecting the supplier in the supply chain of CoPS. Banaeian et al. (2018) helped this area by comparing the criteria for using the methods of selecting multiple faulty sources in a fuzzy environment. Connecting the theory of fuzzy sets to TOPSIS, VIKOR, and GRA methods has been fully discussed in their article and then used to complete a green supply assessment and selection for a real food-processing industry’s company. Cheng et al. (2017) proposed a hybrid model made and DEA. The stated model is divided into two sections of DEA and the learner. The DEA is a fuzzy multifunction for building expert databases, which includes appropriate and inappropriate suppliers. In this model, the learner is trained by AdaBoost with a specialized database. Therefore, DEA and derived learner are mixed as a combination model to reduce time consumption and computational complexity of choosing suppliers.
Amorim et al. (2016) proposed a bi-level complex numerical planning model for selecting suppliers in the food industry, which helps maximize profits and minimizes customer service risk. Among the parameters included in this model are the degradation of raw materials and final products, uncertainty in downstream and upstream parameters, and period dependent demand. They developed a solution based on multiple Benders decomposition and public distribution planning. Hosseininasab and Ahmadi (2015) presented a new two-phase selection method. The proposed method is based on the long-term trend of value, stability and potential supplier relationships. In the first stage, suppliers are evaluated and determine values will be compared to a set of criteria. In the second step, the multi-objective model is optimized. A supplier employer maximizing expected value and developing suppliers and minimizing related risks will be set through this model. Galankashi et al. (2015) used the nominal group technique (NGT) to extract the most important performance measures. They considered ten performance indicators as alternatives to select green suppliers. Then, a Fuzzy Analytical Network Process (FANP) was used to measure the extracted metrics and circumscribe their significance. Du et al. (2015) introduced a type of supply provider choice problem called the Supplier selection life-cycle in CoPS’ system (CoPS & SSL). There are three types of choices for a manufacturer to complete CoPS: self-made, material purchase and outsourcing. A two-dimensional LSS and CoPS model, according to the CoPS operational phase is proposed to balance buy costs and operating costs. In addition, a combination of Pareto Genetic Algorithm (PGA) algorithm proposed with Multiple Crossover and Simulation (MSC) strategies to solve the two-objective problem. A dual chromosome is also used to represent variable length chromosomes. Finally, the ideal supplier was chosen to offer ideal equipment for a cement company by means of this approach. Huang and Goetschalckx (2014) and Setak et al. (2017) describes the design of the strategic supply chain as a set of Pareto optimal configurations, taking into account simultaneously the productivity and risk, where the risk with the standard deviation of the productivity of the size. The proposed model shares the costs of supplier development in accordance with an optimal ratio, the level of optimal effort and the optimal revenue of the main producer. In order to effectively identify all Pareto optimal configurations, a branch and bound algorithm was expanded using optimal cut and high frontiers to eliminate parts of the inaccessible area and Pareto's non-optimal area investigated the optimal cost-sharing model of the Nash equilibrium and the stackelberg equilibrium to analyze the status of cooperation between the main manufacturer and the suppliers.
Fallah-Tafti et al. (2014) initially developed a closed-loop supply chain network design, which made network design decisions in forwarding and inverted chain networks in a seamlessly integrated structure and also combines tactical decisions with strategic cases (including location and supplier selection) in each period. Then, a new interactive approach based on the known method of STEP was suggested for a multidimensional solution of a mixed integer linear programming model. To validate the proposed model and the solution method, a numerical test is performed using the probable STEM algorithm. The computational results indicate the suitability of the proposed model and the solution method. Chai and
116
Ngai (2015) examined the problem of selecting strategic suppliers in inappropriate decision-making environments. A soft decision-making model was proposed involving multiple stakeholders and multiple perspectives. Lee et al. (2015) considered the supplier assessment and selection as a multi-criteria decision making (MCDM) with the subjective and fuzzy set of decision makers about the evaluation criteria. They provided decision makers with a supportive system, which brings together Pareto Fronts, a set of top-notch high-end providers and business-level executives. The proposed system uses a fuzzy analytical hierarchy process (Fuzzy AHP) and a fuzzy technique to prioritize a similarity to the ideal solution (Fuzzy TOPSIS) in order to successfully determine the weight of the priorities of multiple criteria and select the most appropriate suppliers. Kar (2014) proposed a method for group decision-making support for supplier selection using the integrity of the fuzzy analytical hierarchy process (AHP) in group decision making and fuzzy logic programming for a distinct analysis. Bandyopadhyay and Bhattacharya (2013) developed a new multi-objective formulation for minimizing the total cost and minimizing the bullwhip effect of a two-echelon serial supply chain. They also proposed a new crossover algorithm for a fuzzy variable and a new mutation algorithm whilst applying Non-dominated Sorting Genetic Algorithm-II (NSGA-II) to the proposed problem. The formulated problem has been simulated by Matlab software and the results of the modified NSGA-II have been compared with those of original NSGAII. It is found from the results that the modified NSGA-II algorithm performs better than the original NSGA-II algorithm since the minimum values for both total cost and the bullwhip effect are obtained in the case of the modified NSGA-II. Wu et al. (2013) developed a stochastic fuzzy multi-objective programming model for supply chain outsourcing risk management in the presence of both random uncertainty and fuzzy uncertainty. Utility theory is proposed to treat stochastic data and fuzzy set theory is used to handle fuzzy data by them. They also designed an algorithm to solve the integrated model. The new model in their research is solved using the proposed algorithm for a three-stage supply chain example. Moncayo-Martínez and Recio (2014) proposed an ant colony-based algorithm to generate a set of SC configurations using the concept of Pareto optimality. Abdollahi et al. (2015) presented a framework for supplier selection based on product-related and organization-related characteristics of the suppliers Due to the interaction between the criteria, analytical network process (ANP) is applied for determining the weight of each criterion for each alternative (supplier), and then DEA is used to rank them. The reason that DEA is used in this study is that when the number of suppliers increases, ANP approach tends to work inefficiently. Moreover, for determining the accurate interdependencies between the proposed criteria, fuzzy decision-making trial and evaluation laboratory (DEMATEL) is applied. The framework is applied to a real case to demonstrate its applicability and feasibility. Liu and Hipel (2012) proposed a hierarchical decision model to select the optimal quality control strategies among various alternatives to pursue the most satisfying quality improvement for the supply chain in producing a CoPS, such as an aircraft, warship, or satellite. More specifically, based on the relationships of the suppliers in the supply chain, an HSCQ network can be constructed and an associated multilevel multi-objective program can be established as the hierarchical decision model, which assists the enterprises in different tiers to choose the optimal quality control strategies for managing the quality of their outsourcing products. The result can significantly improve the overall quality performance of the supply chain. A case study on an aircraft production system is conducted to demonstrate the feasibility and effectiveness of the new model. Mahapatra et al. (2012) studied the two major collaborative supplier management strategies (direct investments in supplier development and close relationship building) for developing and accessing superior supplier capability across the growth and maturity stages of the product life cycle (PLC). Specifically, the study analyzes the influence of competitive intensity as an antecedent to supplier development and relational initiatives, and the role of the product lifecycle. Based on initial data and discussions with managers, the individual and integrative effectiveness of supplier development investments (SDI) and relationship orientation (RO) can be different due to the intensity of competition and the PLC stage. Zeydan et al. (2011) proposed a new method in order to increase the quality of selection and evaluation of manufacturer and in the first stage, qualitative performance evaluation is performed by using fuzzy AHP (Analytical Hierarchical Process) in finding criteria weights and then fuzzy TOPSIS (Technique for Order Preference by Similarity to Ideal Solution) is utilized in finding the
117
ranking of suppliers. So, qualitative variables are transformed into a quantitative variable for using in DEA methodology as an output called quality management system audit. In the second stage, DEA is performed with one dummy input and four output variables, namely, quality management system audit, warranty cost ratio, defect ratio, quality management. Shankar et al. (2013) considered simultaneous optimization of strategic design and distribution decisions for three-echelon supply chain architecture consisting of following three players; suppliers, production plants, and distribution centers (DCs). The key design decisions considered are the number and location of plants in the system, the flow of raw materials from suppliers to plants, the number of products to be shipped from plants to distribution centers. To achieve this, the three-echelon network model is mathematically represented and solved using swarm intelligence based multi-objective Hybrid Particle Swarm Optimization algorithm (MOHPSO).Visani et al. (2016) considered a supplier total cost of ownership (TCO), which acted as a proxy for TCO and approximated the results of TCO with less effort. A new integrated DEA model for finding most efficient supplier with imprecise data was proposed by Toloo and Nalchigar (2011), which was capable of identifying most efficient supplier in presence of both ordinal and cardinal data. A systematic DEA approach was implemented by Shi et al. (2015) to scientifically determine and assess suppliers under the sustainable supply chain environment. Using a DEA-type supplier selection, Dobos and Vörösmarty (2018) proposed a methodology to handle management and green criteria. In addition to managerial and green criteria, the proposed methodology examined the impact of inventory-related costs on the selected supplier. Mahdiloo et al. (2015) devised a new multiple objective linear programming DEA model, for which they proposed a real world business case of the Hyundai Steel Company and its suppliers. For comprehensive reviews in the supplier selection with DEA, the interested readers can refer to Soheilirad et al. (2017). Regarding the literature review, innovations that distinguish this research from other above-mentioned studies are summarized as follows:
Unlike most DEA methods used in the literature review, the method presented in this paper can increase the differentiation between options through using information about efficient and anti-efficient frontier.
According to the literature review, this study is one of the first researches to select suppliers in CoPS. Considering the criteria, such as the percentage of suppliers and brand costs to strengthen the
supplier’s brand, such as advertising, is another feature of the research that distinguishes it.
Finally, in order to assess the impact and usefulness of the proposed method, a real case study was carried out and useful managerial outcomes are extracted.
3- The necessity to enter this area
CoPS form an increasingly important role in the economic activities of firms, industries, and nations. Due to changing markets and technologies, over the past several years there has been a shift towards CoPS, particularly in advanced industrial nations (Hansen and Rush, 1998). Currently, CoPS form a significant part of the value added of industrialized countries; the share that has been growing over the past decade and is considered as a major source of competitive advantage for these countries. Although most CoPS are produced for domestic consumption, over the past 30 years (and more), about 15% of global trade has been related to CoPS (Hobday, 2007). Therefore, most countries are trying to be successful in this extent. One of the main requirements for entering this domain is the supplier of these products. This is because the appropriate supplier, in addition to costs’ abatement, will increase competition and speed of progress in this area. Given the importance of choosing a supplier in these products, we will propose a method to evaluate the suppliers of these products by using the DEA model below.
118
4- Proposed method
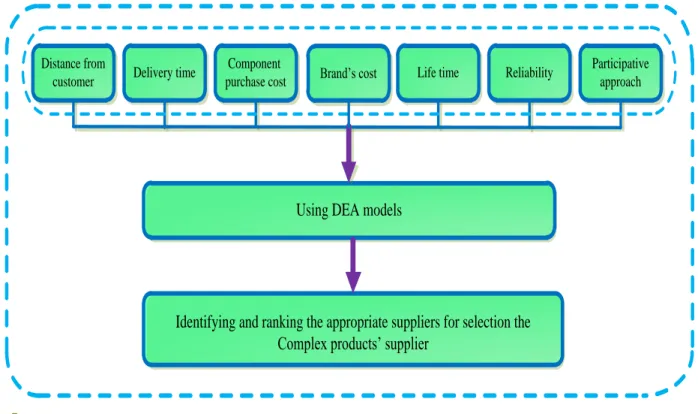
The following figure shows the process of selecting the supplier of CoPS. As it is clear from this figure, the most appropriate suppliers are identified and evaluated based on a set of technical, economic, and geographical criteria using the DEA model.
Fig 1. The used approach in the article’s process structure
4-1- DEA model
In this model, using a DEA model, various suppliers are evaluated for selection based on a set of technical, economic, and geographic criteria. The proposed envelopment analysis model is able to increase the differentiation between options by employing efficient and anti-efficient frontier information. The DEA is a non-parametric method for evaluating decision-making units based on observation. This technique manages sophisticated relationships between inputs and outputs and does not require predefined weights. In addition, this method does not require the normalization of the input and output and the decision-making units. In our case, a specific supplier is considered as a decision maker. Meanwhile, this technique has been widely used to identify suppliers. Two basic research in the field of DEA are (Charnes et al., 1979; Farrell, 1957) studies. The offered envelopment analysis by Charnes et al. (1979) considers the constant return to scale. This model is known as the CCR model in literature. Later, the Banker (1984) considered a model involving the variable return to the scale, which in the literature is known as the BCC model. The main concept of the classical DEA is the identification of the production frontier, where decision-making units are efficient. Then, the score of the units that are not on the frontier is obtained through comparison with the efficient decision-making units. Note that units located on the frontier have the same rating and also the highest score. As previously mentioned, one of the important features of DEA is that there is no need to determine predetermined weights. In fact, weights are considered as decision variables, and their value is specified in a way which yields the highest returns. However, due to a large number of decision-making units located often on the frontier, this full flexibility may reduce discrimination and the ability to make a difference in DEA and compromise the performance of the DEA
Distance from
customer Delivery time
Component
purchase cost Brand’s cost Life time Reliability
Participative approach
Using DEA models
Identifying and ranking the appropriate suppliers for selection the
Complex products’ supplier
119
rating. Therefore, many authors have tried to provide various methods aimed at improving the power of differentiation in DEA.
Takamura and Tone (2003) considered an inverted envelopment analysis model for site selection for the transmission of several government agencies abroad. Paradi et al. (2004) Also used an inverted model. Johnson and McGinnis (2008) employed both the efficient and anti-efficient frontiers to identify outliers and thus improve the accuracy of estimators in the second stage regression analysis. Entani et al. (2002) employed both inverted envelopment analysis models to obtain the upper and lower limits of effective options.
There are also studies which simultaneously compare good and bad decision makers through DEA models for example (Dehghani et al., 2018c; Shen et al., 2016; Sueyoshi and Goto, 2014).
In this study, we used Shen et al. (2016) to evaluate suppliers of CoPS. Unlike other groups, these methods have the advantage that they are not limited to a specific group and can be applied to different issues. In fact, Shen et al. (2016) in order to increase the DEA power of discrimination, use an indicator that simultaneously takes the distance from the efficient and anti-efficient frontier. In the proposed process, standard envelopment and inverted envelopment analysis are used simultaneously to provide more information about the frontiers. This will increase the DEA discrimination underlying power and provide a better rating. In the following, the approach used will be explained.
Suppose that there are in decision units so that their index is displayed with v
(
v
1,..., )
n
. Also, the inputs and outputs of the DEA model for the decision-making units arex
kv(
k
1,..., )
g
and zrv(r1,..., )qrespectively. The model below shows the standard cover analysis: *
bl l
Min h
(1)1
,
1,...,
n
kv v l kl
v
x
x
v
g
1 , 1,..., nrv v rl v
r q
z
z
(3)0,
1,...,
unconstrained.
v lv
n
(4)Also, the inverted envelopment analysis model is as follows:
*
wl l
Max h (5)
1
,
1,...,
n
kv v l kl
v
x
x
k
g
)6(1
,
1,...,
n
rv c rl
v
z
z
r
q
)7(0,
1,...,
unconstrained.
v lv
n
( 8 ) ( 2 )120
So that
l is the decision-making unit's return is "l",x
kl andz
rlare respectively the inputs and outputs of the decision-making unit under consideration (the decision-making unit "l") and
v is the dual weight associated with the total inputs and outputs of the decision-making unit "v".Both of these models are solved for the "l" decision maker to achieve performance scores of
h
wl* and *bl
h
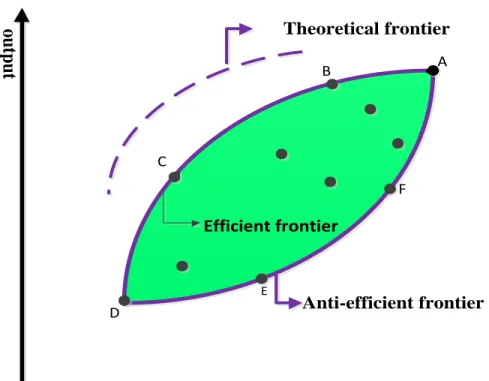
. Speaking intuitively, these two models are solved n times to determine the frontiers. Specifically, standard and inverted envelopment analysis models generate efficient and anti-efficient frontiers, respectively. The following figure shows the geometric meaning of efficient and anti-efficient frontiers:Fig 2. Graphical illustrations of the efficient and anti-efficient frontiers
As it can be seen, the standard model of DEA has used the best decision-making unit A, B, C and D to create an efficient frontier, and the inverted model of DEA used the worst of them to form an anti-efficient frontier. For the use of both anti-efficient and anti-anti-efficient frontiers data and aggregation of efficiency scores for efficient and anti-efficient envelopment models, the following index for each decision unit is calculated as follows.
input
o
u
tp
u
t
Anti-efficient frontier Theoretical frontier
D
A B
C
E
F
121 * * * 1 (1 ) 2 bl wl l h h hi
(9)
Note that if the decision-making unit "l" is located on the anti-efficient frontier (for example, the decision-making unit F and E), then we’ll havehwl* 1 and
* *
1
2
2
bl lh
hi
, and if it is on both frontiers (for example, the decision-making unit A and D), that ish
*wl
1,
andh
bl*
1
, Then, if the decision-making unit is placed on the efficient frontier (that is, the decision-making unit B and C), thenhi
l* will be more than 0.5, which will make this decision unit more efficient than other units located on both frontiers.5- Case study
According to the literature, there are important and strategic products in the field of CoPS that are necessary for the survival of each country in terms of infrastructure and technological advances in the world. Remaining in the market for competition and future developments has made Countries to present in this field. Therefore, selecting the right supplier for these products is one of the essential requirements participate successfully in it. In this regard, a case study has been carried out on the supply of products. There are three types of choices for purchasing suppliers for CoPS: 1. Purchasing ready-made components. 2. Purchasing materials that must be given to the manufacturing plants to process the materials to prepare the final product. 3. Outsourcing. To do this, 20 suppliers for component selection, 20 suppliers for material selection, as well as 20 suppliers for material processes are selected and evaluated for DEA.
5-1- Criteria selection method
Table 2. The criteria used in the proposed model Criteria extraction method Criteria
( Du et al., 2015Safdari Ranjbar et al., 2018 )
Purchase cost
(Dedehayir et al., 2014; Safdari Ranjbar et al., 2018) Quality cost
( Du et al., 2015 )
Reliability
Field experts Joint venture approach
( Du et al., 2015 ) distance Field experts Timely delivery Field experts COPS lifespan Field experts Infrastructure and testing
Field experts Experience Field experts Current ability Field experts Learning Field experts National interest rate
Field experts network development
ability
( Du et al., 2015 )
122
As can be seen in the table above, interviews with experts, institutions, organs (e.g., Cook and Johnston (1992), Dedehayir et al. (2014), Safdari Ranjbar et al. (2018), Du and Guo (2016), Hobday (2007), Du et al. (2015) ) and university professors, active in the field of the gas turbine, satellite, and automotive industry are done. Also, academic rank order of professors in interviewees is respectively two professors and two assistant professors. Therefore, given the above, a number of technical, economic, and geographic criteria that are important for choosing the CoPS supplier are considered. To this end, seven criteria (four criteria as input and three as output) for the DEA model and some other in the mathematical model were considered according to the experts' opinion.
5-2- Criteria used in DEA
We define a set of economic, technical, and geographic metrics to evaluate suppliers of CoPS. The criteria by which the increase and decrease are desirable is considered as an output or an input parameter, respectively. Suppliers, who receive required privileges in the manager’s point of view, are being used as suppliers in the chain of CoPS the defined criteria are as follows:
Distance from customer
The distance between the seller and the customer affects the waste of money. This means that the waste will increase by the distance to the supplier. Therefore, this parameter has a decreasing value and is considered as an input parameter.
Delivery time
It is therefore important that if the pieces of material are not delivered to the buyer in a timely manner, the continuation of the chain is disrupted and the timely delivery of these products can lead to the successful production process and reduce other costs, so this parameter is decreasing and is considered as an Input parameter.
Component purchase costs
This parameter is considered as important in this regard that costs must be reduced and lower cost per component or material purchase, leads to decrease the costs of manufacturing the whole product and has a declining index, which means that its increasing trend can increase the costs, so this indicator is considered as an input indicator.
Quality costs (brand strengthen)
Costs must be reduced and lower cost per component or manufacturing process will lead to lower costs in the overall product, and on the other hand, higher quality will result in a better product, that’s why this parameter is important. It has a decreasing index and its increase leads to higher costs, so this index is considered as an input indicator.
CoPS lifetime
The CoPS higher reliability guarantees a long lifetime to reduce the error rate and improve efficiency. Lifetime is directly related to costs, the more costs lead to higher reliability, more lifetime and lower breakdown. As a result, this parameter is considered as an output parameter.
Reliability
Higher reliability reduces the cost of maintenance of products throughout the lifecycle and increases the life of components, so this parameter is considered as an output parameter.
Participative approach percentage in construction
Participation in the production of these products reduces costs and makes the manufacturing process faster, and the increase in this indicator improves cooperation, and the occurrence of events such as sanctions does not disrupt this relationship, so this parameter is considered as an output parameter.
5-3- Results from solving the DEA model
5-3-1- Collecting and estimating the data
These data gathered from a research lab. Also, the proposed algorithm is coded by GAMS software for obtaining the corresponding score, i.e. the efficiency and anti-efficiency scores and the CPLEX solver is
123
used to solve the models. Meanwhile, all experimental tests are performed using an Intel GPU GMA 4500M, 1GHz, 2GB RAM specification laptop. To this end, the model was solved for components suppliers’ selection, material suppliers' selection, and process suppliers’ selection once for each, and the results are presented in table 3.
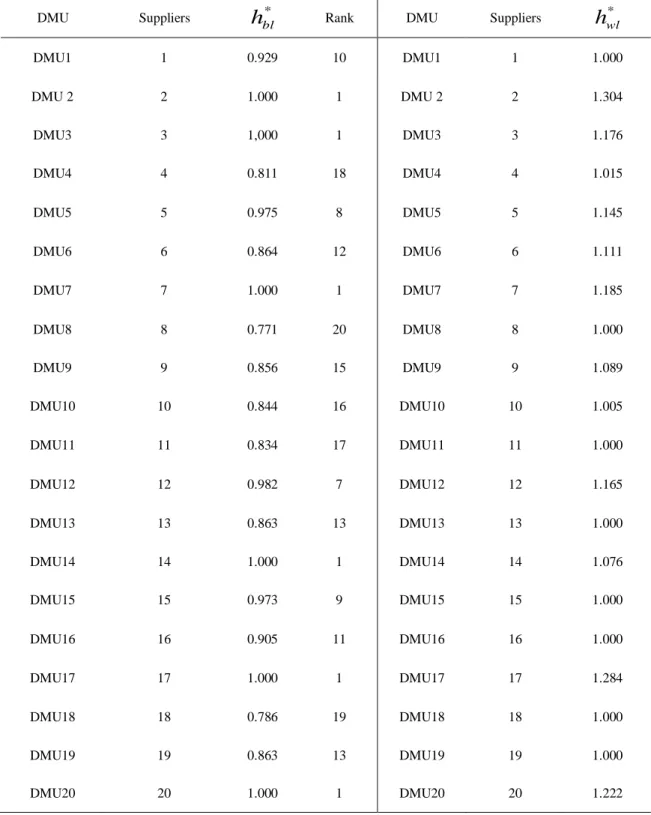
Table 3. The results of suppliers' ratings using the Standard and inverted DEA for component ‘a’
DMU Suppliers
h
bl* Rank DMU Suppliersh
wl*DMU1 1 0.929 10 DMU1 1 1.000
DMU 2 2 1.000 1 DMU 2 2 1.304
DMU3 3 1,000 1 DMU3 3 1.176
DMU4 4 0.811 18 DMU4 4 1.015
DMU5 5 0.975 8 DMU5 5 1.145
DMU6 6 0.864 12 DMU6 6 1.111
DMU7 7 1.000 1 DMU7 7 1.185
DMU8 8 0.771 20 DMU8 8 1.000
DMU9 9 0.856 15 DMU9 9 1.089
DMU10 10 0.844 16 DMU10 10 1.005
DMU11 11 0.834 17 DMU11 11 1.000
DMU12 12 0.982 7 DMU12 12 1.165
DMU13 13 0.863 13 DMU13 13 1.000
DMU14 14 1.000 1 DMU14 14 1.076
DMU15 15 0.973 9 DMU15 15 1.000
DMU16 16 0.905 11 DMU16 16 1.000
DMU17 17 1.000 1 DMU17 17 1.284
DMU18 18 0.786 19 DMU18 18 1.000
DMU19 19 0.863 13 DMU19 19 1.000
124
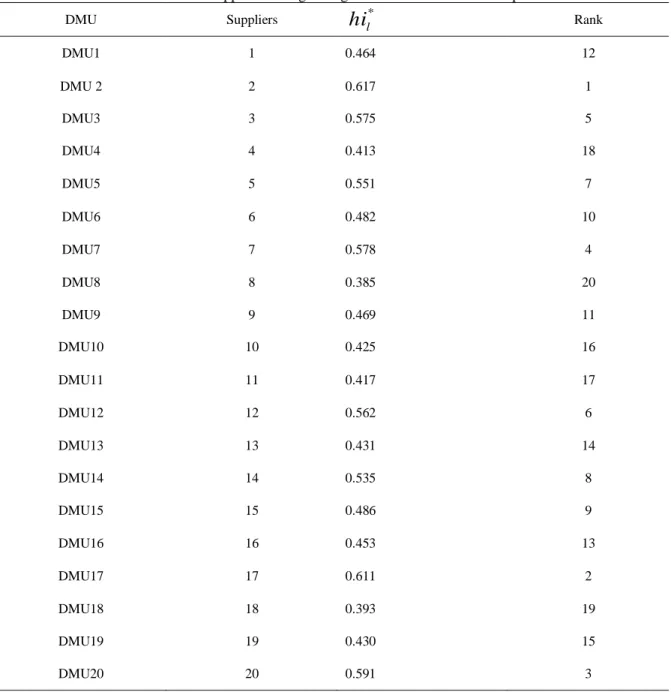
Table 4. Results of suppliers' ratings using the Standard DEA for component ‘a’
DMU Suppliers *
l
hi
RankDMU1 1 0.464 12
DMU 2 2 0.617 1
DMU3 3 0.575 5
DMU4 4 0.413 18
DMU5 5 0.551 7
DMU6 6 0.482 10
DMU7 7 0.578 4
DMU8 8 0.385 20
DMU9 9 0.469 11
DMU10 10 0.425 16
DMU11 11 0.417 17
DMU12 12 0.562 6
DMU13 13 0.431 14
DMU14 14 0.535 8
DMU15 15 0.486 9
DMU16 16 0.453 13
DMU17 17 0.611 2
DMU18 18 0.393 19
DMU19 19 0.430 15
DMU20 20 0.591 3
Tables 3 and 4 are the results of the ranking of options for choosing “a” component. Table 3 illustrates the results of suppliers' rankings based on standard and inverted envelopment analysis. We see that several options, for example (2, 3 and 7), have the same value of 1 for component selection. Table 4 is used for envelopment analysis. Candidates are ranked first, which it can be seen that with regard to the model, the distinction between options has increased compared to the standard envelopment model.
125
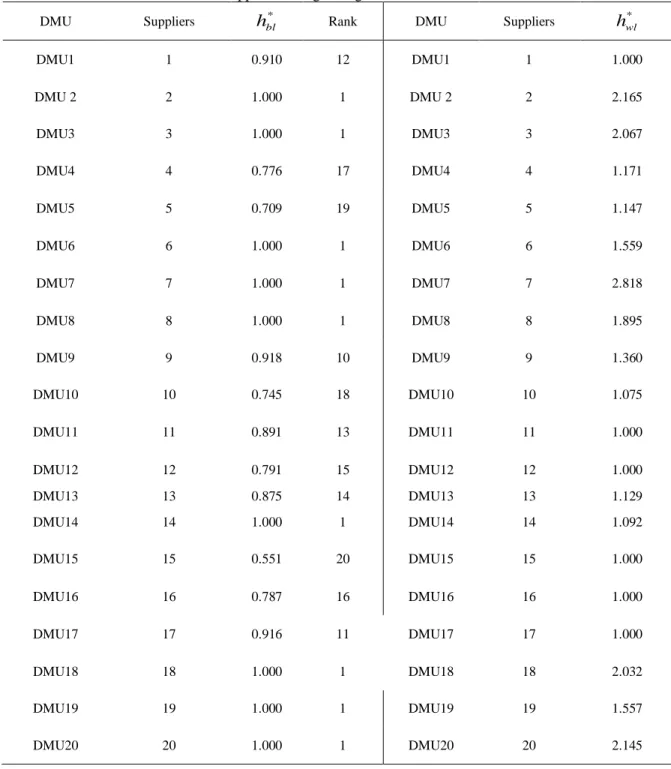
Table 5. Results of suppliers' ratings using the Standard DEA for material ‘b’
DMU Suppliers hbl* Rank DMU Suppliers h*wl
DMU1 1 0.910 12 DMU1 1 1.000
DMU 2 2 1.000 1 DMU 2 2 2.165
DMU3 3 1.000 1 DMU3 3 2.067
DMU4 4 0.776 17 DMU4 4 1.171
DMU5 5 0.709 19 DMU5 5 1.147
DMU6 6 1.000 1 DMU6 6 1.559
DMU7 7 1.000 1 DMU7 7 2.818
DMU8 8 1.000 1 DMU8 8 1.895
DMU9 9 0.918 10 DMU9 9 1.360
DMU10 10 0.745 18 DMU10 10 1.075
DMU11 11 0.891 13 DMU11 11 1.000
DMU12 12 0.791 15 DMU12 12 1.000
DMU13 13 0.875 14 DMU13 13 1.129
DMU14 14 1.000 1 DMU14 14 1.092
DMU15 15 0.551 20 DMU15 15 1.000
DMU16 16 0.787 16 DMU16 16 1.000
DMU17 17 0.916 11 DMU17 17 1.000
DMU18 18 1.000 1 DMU18 18 2.032
DMU19 19 1.000 1 DMU19 19 1.557
126
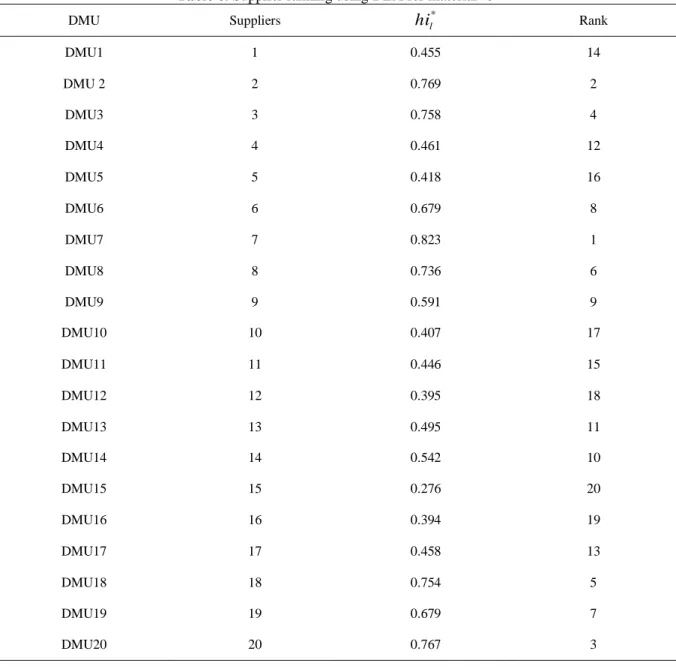
Table 6. Supplier ranking using DEA for material ‘b’
DMU Suppliers hil* Rank
DMU1 1 0.455 14
DMU 2 2 0.769 2
DMU3 3 0.758 4
DMU4 4 0.461 12
DMU5 5 0.418 16
DMU6 6 0.679 8
DMU7 7 0.823 1
DMU8 8 0.736 6
DMU9 9 0.591 9
DMU10 10 0.407 17
DMU11 11 0.446 15
DMU12 12 0.395 18
DMU13 13 0.495 11
DMU14 14 0.542 10
DMU15 15 0.276 20
DMU16 16 0.394 19
DMU17 17 0.458 13
DMU18 18 0.754 5
DMU19 19 0.679 7
DMU20 20 0.767 3
Tables 5 and 6 are the results of the ranking of options for choosing material b. Table 5 is the results from suppliers ranking using standard and inverted envelopment analysis. We can see that several options get the same amount. Table 5 was used for the envelopment analysis, in which the differentiation between options was increased in this method rather than the standard envelopment analysis method.
127
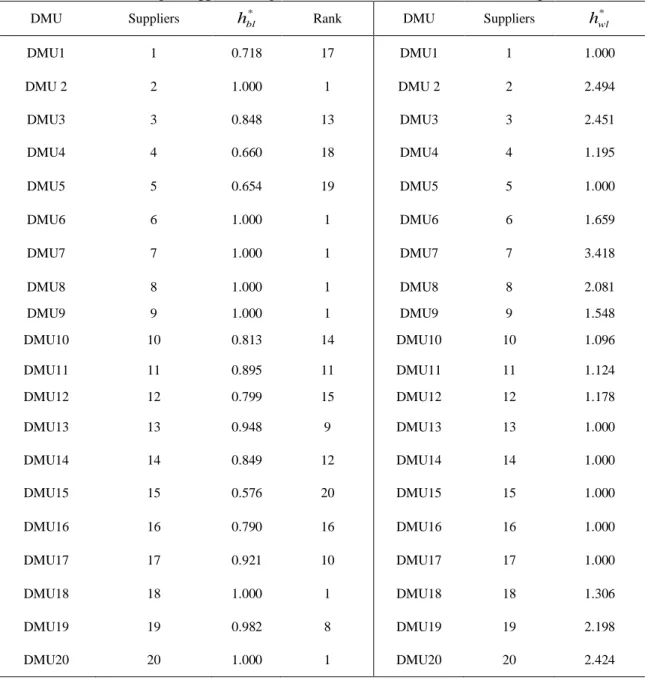
Table 7. Ranking of suppliers using standard and inverted DEA method for ‘k’ process
DMU Suppliers hbl* Rank DMU Suppliers hwl*
DMU1 1 0.718 17 DMU1 1 1.000
DMU 2 2 1.000 1 DMU 2 2 2.494
DMU3 3 0.848 13 DMU3 3 2.451
DMU4 4 0.660 18 DMU4 4 1.195
DMU5 5 0.654 19 DMU5 5 1.000
DMU6 6 1.000 1 DMU6 6 1.659
DMU7 7 1.000 1 DMU7 7 3.418
DMU8 8 1.000 1 DMU8 8 2.081
DMU9 9 1.000 1 DMU9 9 1.548
DMU10 10 0.813 14 DMU10 10 1.096
DMU11 11 0.895 11 DMU11 11 1.124
DMU12 12 0.799 15 DMU12 12 1.178
DMU13 13 0.948 9 DMU13 13 1.000
DMU14 14 0.849 12 DMU14 14 1.000
DMU15 15 0.576 20 DMU15 15 1.000
DMU16 16 0.790 16 DMU16 16 1.000
DMU17 17 0.921 10 DMU17 17 1.000
DMU18 18 1.000 1 DMU18 18 1.306
DMU19 19 0.982 8 DMU19 19 2.198
128
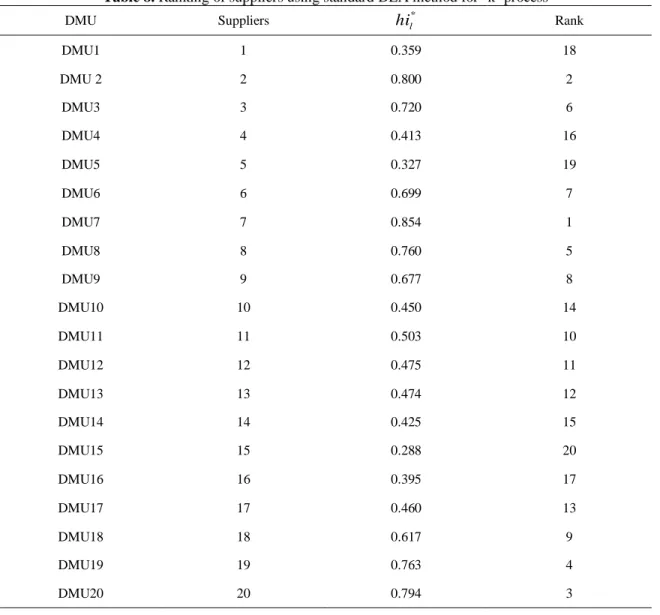
Table 8. Ranking of suppliers using standard DEA method for ‘k’ process
DMU Suppliers hil* Rank
DMU1 1 0.359 18
DMU 2 2 0.800 2
DMU3 3 0.720 6
DMU4 4 0.413 16
DMU5 5 0.327 19
DMU6 6 0.699 7
DMU7 7 0.854 1
DMU8 8 0.760 5
DMU9 9 0.677 8
DMU10 10 0.450 14
DMU11 11 0.503 10
DMU12 12 0.475 11
DMU13 13 0.474 12
DMU14 14 0.425 15
DMU15 15 0.288 20
DMU16 16 0.395 17
DMU17 17 0.460 13
DMU18 18 0.617 9
DMU19 19 0.763 4
DMU20 20 0.794 3
Tables 7 and 8 are the results of the ranking of options for choosing the “k” process. Table 7 shows the result of suppliers’ ranking using standard and inverted envelopment analysis method. We see that several options have the same value. Table 8 is used for envelopment analysis. First, candidates are ranked. Then, we also saw that the differentiation between the options was high in this method, and the suitable supplier was selected as standard.
What is apparent from these tables are that further information on the frontiers increases the power of the division of the DEA evaluation. Based on the management perspective, the minimum satisfaction rating for the proposed index is considered. Speaking intuitively, those DMUs whose index values exceed the amount required are selected.
Based on the results obtained from the above tables, candidate suppliers are introduced to choose the supplier of CoPS. In fact, suppliers who get the required points from a managerial point of view are introduced as candidates for supplying a CoPS. The minimum score for the considered index (hil*) based on managerial results equals to 0.5. In other words, units with a value of more than 0.5 are considered as eligible suppliers. Accordingly, 12 suppliers of all 20 suppliers A, and 10 suppliers of all 20 suppliers B, and 10 suppliers of all 20 k suppliers, reach satisfaction ratings, which as unsuitable suppliers to select CoPS in this project.
129
Selecting appropriate suppliers for CoPS can increase the efficiency of these products. In addition, the reduction in the number of suppliers from 20 to 8 suppliers for candidate a, from 20 to 10 for supplier b and from 20 to 10 suppliers for "k", eliminates the need for a significant number of evaluations. We also saw by means of standard envelopment analysis method that several options had the same value. For example, for Table 2, the standard envelopment used to prepare component a for selecting suppliers (2 and 3), as well as for table 2 for the inverted model, the options (18 and 19) have the same value of (1), but the method used has increased the distinction between these options and eliminated some inappropriate suppliers from the model.
In order to confirm the ranking obtained by the DEA model, a nonparametric test called the Spearman rank correlation is used (Sheskin, 2003). This method evaluates the positive relationship between the rankings obtained by the standard envelopment analysis model and the model presented by the following criterion:
𝜌 =
6 ∑ 𝑖𝑑𝑖𝑛(𝑛2−1) (10)
Note that 𝑑𝑖 represents the difference between the rankings of the method proposed for the decision
maker i or the two methods mentioned. In this sense, we assume the zero assumption 𝐻0 versus the
alternative hypothesis𝐻1.
𝑯𝟎: There is no positive correlation between the ratings obtained
from the envelopment analysis and the standard envelopment analysis.
𝑯𝟏: There is a positive correlation between the ratings obtained
from the envelopment analysis and the standard envelopment analysis
For this test, the confidence level (i.e., 1-α) is considered equal to 0.96. The test statistic and the value of the p-value were 0.938. Given the fact that the value of the p-value is less than α, the assumption 𝐻0 is
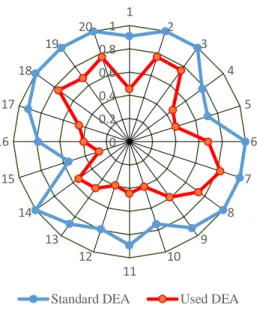
rejected and it can be claimed that there is an effective relationship between the standard envelopment analysis and envelopment analysis methods used. Therefore, the validity of the results is confirmed. All in all, it can be concluded that the ranks reached by the proposed DEA model are compatible with the ones in the standard DEA model. That is, the obtained results from the proposed DEA model are verified. As such, Figure 4, Figure 5 and Figure 6 compare the scores acquired by the standard DEA model and the scores acquired by the proposed DEA model for suppliers of “a” component, “b” materials and “k” process. What is that the proposed DEA model increases the difference between DMUs and consequently rankings between the DMUs are easily carried out. More precisely, this highlights the validation of the results obtained by the proposed DEA model.
130
Fig 3. Comparison between suppliers' ratings using the standard DEA and the model used for component ‘a’ As it can be seen, from the figure 3, options 2,3,7,14,17,20 got the same value of 1 in the standard envelopment analysis, but the distinction between options in the used method was increased.
Fig 4. Comparison between suppliers' ratings using the standard DEA and the model used for material ‘b’ As it can be seen in figure 4, in the standard envelopment analysis method, a number of options have the same value, but in the used method, the distinction between options is increased.
0 0.2 0.4 0.6 0.8
1 1 2 3
4 5
6 7 8 9 10 11 12 13 14 15 16
17 18
19 20
Standard DEA Used DEA
0 0.2 0.4 0.6 0.8
1 1 2 3
4 5
6 7 8 9 10 11 12 13 14 15 16
17 18
19 20
131
Fig 5. Comparison between suppliers ranking using the standard DEA and the model used for the ‘k’ process As it can be seen from figure 5, a number of options have obtained a certain amount in the Standard envelopment analysis method, which is more differentiated in the method used. Therefore, the obtained results are validated.
5-3-3- Sensitivity analysis
The aim of this section is to scrutiny the sensitivity of the criteria toward each other, and that how can the increase or decrease of each of these criteria affect the decision-making process. This analysis will help decision makers in this circuit to focus on which criteria.To this end, the model ran several times to identify the influence of each input and output criterion. In other words, each of them was separately changed and the model was executed and then we obtained the effect of it on the rest of the criteria. The results showed that the criterion of participatory approach percent for component suppliers is more important than other criteria and has the most influence on the CoPS suppliers’ selection. Also for material suppliers, the delivery time criterion has the highest coefficient, and eventually, the most important criterion to process suppliers is the delivery time criterion, which helps managers and manufacturers of CoPS to select the more efficient and appropriate suppliers for less. Figures 6, 7, 8 illustrate the ranking of criteria in terms of the importance of selecting a supplier of CoPS for the component, materials, and process respectively.
0 0.2 0.4 0.6 0.8 1
1 2
3 4
5 6 7 8 9 10 11 12 13 14 15 16
17 18
19 20
132
Fig 6. Ranking of criteria in terms of their significance and their changes relative to each other for component suppliers’ selection
Fig 7. Ranking of criteria in terms of their significance and their changes relative to each other for material suppliers’ selection
0 0.05 0.1 0.15 0.2 0.25 0.3 0.35 0.4
A
v
er
age
v
al
u
e
o
f
ef
fi
ci
en
ci
es
0 0.1 0.2 0.3 0.4 0.5
A
v
e
r
age
v
al
u
e
o
f
e
ffi
c
ie
n
c
ie
133
Fig 8.Ranking of criteria in terms of their significance and their changes relative to each other for process suppliers’ selection
6-Conclusion
CoPS are one of the areas that bring the most value added to the countries’ economies. This is due to the fact that there are important and strategic products in this field that will increase the competitiveness of it. Accordingly, most countries try to have a successful presence in this area. One of the main requirements to enter this area is the selection of the proper supplier of these products. The rationale behind this is that the proper supplier, in addition to reducing the costs, will increase competitive capability for manufacturers. In this regard, this paper presents a DEA model to evaluate and select the supplier in CoPS. In the proposed method, suppliers of various CoPS are evaluated based on a set of economic, technical and geographical criteria. More precisely, at this stage, inappropriate candidates are removed from the decision-making, and the candidates with the highest scores are chosen.
In order to evaluate the effectiveness and usefulness of the proposed method, a case study is conducted through which important managerial outcomes are extracted. For example, the results reveal that by using the DEA method, the difference and distinction between options are increased compared to when the standard envelopment analysis is deployed. In addition, in accordance with Spearman's nonparametric tests’ results, it can be corroborated that there is an effective relationship between the used DEA model and standard DEA models.
This study is one of the first works done in the area of optimizing CoPS. Thus, it can be expanded to various promising aspects to enrich its literature. For example, using an appropriate mathematical model for selecting CoPS’ suppliers is an appealing future research field with significant practical relevance. As such, implementing decision techniques such as AHP and TOPSIS to select suppliers of CoPS is another future avenue for this study. Finally, given the uncertain nature of the real environment, future researches may aim at taking into account uncertainty in the concerned criteria.
0 0.05 0.1 0.15 0.2 0.25 0.3 0.35 0.4 0.45
A
v
e
r
age
v
al
u
e
o
f
e
ffi
c
ie
n
c
ie
134
References
Abdollahi, M., Arvan, M., and Razmi, J. (2015). An integrated approach for supplier portfolio selection: Lean or agile? Expert Systems with Applications42, 679-690.
Acha, V., Davies, A., Hobday, M., and Salter, A. (2004). Exploring the capital goods economy: complex product systems in the UK. Industrial and Corporate Change13, 505-529.
Amorim, P., Curcio, E., Almada-Lobo, B., Barbosa-Póvoa, A. P., and Grossmann, I. E. (2016). Supplier selection in the processed food industry under uncertainty. European Journal of Operational Research
252, 801-814.
Ayhan, M. B., and Kilic, H. S. (2015). A two stage approach for supplier selection problem in multi-item/multi-supplier environment with quantity discounts. Computers & Industrial Engineering85, 1-12. Banaeian, N., Mobli, H., Fahimnia, B., Nielsen, I. E., and Omid, M. (2018). Green supplier selection using fuzzy group decision making methods: A case study from the agri-food industry. Computers & Operations Research89, 337-347.
Bandyopadhyay, S., and Bhattacharya, R. (2013). Applying modified NSGA-II for bi-objective supply chain problem. Journal of Intelligent Manufacturing24, 707-716.
Banker, R. D. (1984). Estimating most productive scale size using data envelopment analysis. European Journal of Operational Research17, 35-44.
Çebi, F., and Otay, İ. (2016). A two-stage fuzzy approach for supplier evaluation and order allocation problem with quantity discounts and lead time. Information Sciences339, 143-157.
Chai, J., and Ngai, E. W. (2015). Multi-perspective strategic supplier selection in uncertain environments.
International Journal of Production Economics166, 215-225.
Charnes, A., Cooper, W. W., and Rhodes, E. (1979). Measuring the efficiency of decision-making units.
European journal of operational research3, 339.
Cheng, Y., Peng, J., Zhou, Z., Gu, X., and Liu, W. (2017). A Hybrid DEA-Adaboost Model in Supplier Selection for Fuzzy Variable and Multiple Objectives. IFAC-PapersOnLine50, 12255-12260.
Cook, W. D., and Johnston, D. A. (1992). Evaluating suppliers of complex systems: a multiple criteria approach. Journal of the operational research society43, 1055-1061.
Davies, A. (1996). Innovation in large technical systems: the case of telecommunications. Industrial and Corporate Change5, 1143-1180.
Davies, A., and Brady, T. (1998). Policies for a complex product system. Futures30, 293-304.
Davies, A., and Hobday, M. (2005). "The business of projects: managing innovation in complex products and systems," Cambridge University Press.
Dedehayir, O., Nokelainen, T., and Mäkinen, S. J. (2014). Disruptive innovations in complex product systems industries: A case study. Journal of Engineering and Technology Management33, 174-192.
135
Dehghani, E., Behfar, n., and Jabalameli, M. S. (2016). Optimizing location, routing and inventory decisions in an integrated supply chain network under uncertainty. Journal of Industrial and Systems Engineering9, 0-0.
Dehghani, E., Jabalameli, M. S., and Jabbarzadeh, A. (2018a). Robust design and optimization of solar photovoltaic supply chain in an uncertain environment. Energy142, 139-156.
Dehghani, E., Jabalameli, M. S., Jabbarzadeh, A., and Pishvaee, M. S. (2018b). Resilient solar photovoltaic supply chain network design under business-as-usual and hazard uncertainties. Computers & Chemical Engineering111, 288-310.
Dehghani, E., Jabalameli, M. S., SamanPishvaee, M., and Jabbarzadeh, A. (2018c). Integrating information of the efficient and anti-efficient frontiers in DEA analysis to assess location of solar plants: A case study in Iran. Journal of Industrial and Systems Engineering11, 163-179.
Dehghani, E., Pishvaee, M. S., and Jabalameli, M. S. (2018d). A hybrid Markov process-mathematical programming approach for joint location-inventory problem under supply disruptions.
Diabat, A., Dehghani, E., and Jabbarzadeh, A. (2017). Incorporating location and inventory decisions into a supply chain design problem with uncertain demands and lead times. Journal of Manufacturing Systems
43, 139-149.
Dobos, I., and Vörösmarty, G. (2018). Inventory-related costs in green supplier selection problems with Data Envelopment Analysis (DEA). International Journal of Production Economics.
Du, B., and Guo, S. (2016). Production planning conflict resolution of complex product system in group manufacturing: a novel hybrid approach using ant colony optimization and Shapley value. Computers & Industrial Engineering94, 158-169.
Du, B., Guo, S., Huang, X., Li, Y., and Guo, J. (2015). A Pareto supplier selection algorithm for minimum the life cycle cost of complex product system. Expert Systems with Applications42, 4253-4264. Entani, T., Maeda, Y., and Tanaka, H. (2002). Dual models of interval DEA and its extension to interval data. European Journal of Operational Research136, 32-45.
Fallah-Tafti, A. l., Sahraeian, R., Tavakkoli-Moghaddam, R., and Moeinipour, M. (2014). An interactive possibilistic programming approach for a multi-objective closed-loop supply chain network under uncertainty. International journal of systems science45, 283-299.
Farrell, M. J. (1957). The measurement of productive efficiency. Journal of the Royal Statistical Society. Series A (General)120, 253-290.
Galankashi, M. R., Chegeni, A., Soleimanynanadegany, A., Memari, A., Anjomshoae, A., Helmi, S. A., and Dargi, A. (2015). Prioritizing green supplier selection criteria using fuzzy analytical network process.
Procedia CIRP26, 689-694.
Hansen, K. L., and Rush, H. (1998). Hotspots in complex product systems: emerging issues in innovation management. Technovation18, 555-590.
Hobday, M. (2000). The project-based organisation: an ideal form for managing complex products and systems? Research policy29, 871-893.
136
Hobday, M. (2007). Editor's introduction: The scope of Martin Bell's Contribution.
Hosseininasab, A., and Ahmadi, A. (2015). Selecting a supplier portfolio with value, development, and risk consideration. European Journal of Operational Research245, 146-156.
Huang, E., and Goetschalckx, M. (2014). Strategic robust supply chain design based on the Pareto-optimal tradeoff between efficiency and risk. European Journal of Operational Research237, 508-518. Johnson, A. L., and McGinnis, L. F. (2008). Outlier detection in two-stage semiparametric DEA models.
European Journal of Operational Research187, 629-635.
Kar, A. K. (2014). Revisiting the supplier selection problem: An integrated approach for group decision support. Expert systems with applications41, 2762-2771.
Lee, J., Cho, H., and Kim, Y. S. (2015). Assessing business impacts of agility criterion and order allocation strategy in multi-criteria supplier selection. Expert Systems with Applications42, 1136-1148. Liu, Y., and Hipel, K. W. (2012). A hierarchical decision model to select quality control strategies for a complex product. IEEE Transactions on Systems, Man, and Cybernetics-Part A: Systems and Humans42, 814-826.
Mahapatra, S. K., Das, A., and Narasimhan, R. (2012). A contingent theory of supplier management initiatives: effects of competitive intensity and product life cycle. Journal of Operations Management30, 406-422.
Mahdiloo, M., Saen, R. F., and Lee, K.-H. (2015). Technical, environmental and eco-efficiency measurement for supplier selection: An extension and application of data envelopment analysis.
International Journal of Production Economics168, 279-289.
Moncayo-Martínez, L. A., and Recio, G. (2014). Bi-criterion optimisation for configuring an assembly supply chain using Pareto ant colony meta-heuristic. Journal of Manufacturing Systems33, 188-195. Özdemir, E. D., Härdtlein, M., Jenssen, T., Zech, D., and Eltrop, L. (2011). A confusion of tongues or the art of aggregating indicators—Reflections on four projective methodologies on sustainability measurement. Renewable and Sustainable Energy Reviews15, 2385-2396.
Paradi, J. C., Asmild, M., and Simak, P. C. (2004). Using DEA and worst practice DEA in credit risk evaluation. Journal of Productivity Analysis21, 153-165.
Sadjadi, S. J., Makui, A., Dehghani, E., and Pourmohammad, M. (2016). Applying queuing approach for a stochastic location-inventory problem with two different mean inventory considerations. Applied Mathematical Modelling40, 578-596.
Safdari Ranjbar, M., Park, T.-Y., and Kiamehr, M. (2018). What happened to complex product systems literature over the last two decades: progresses so far and path ahead. Technology Analysis & Strategic Management, 1-19.
Setak, M., Azizi, V., Karimi, H., and Jalili, S. (2017). Pickup and delivery supply chain network with semi soft time windows: metaheuristic approach. International Journal of Management Science and Engineering Management12, 89-95.
137
Shankar, B. L., Basavarajappa, S., Kadadevaramath, R. S., and Chen, J. C. (2013). A bi-objective optimization of supply chain design and distribution operations using non-dominated sorting algorithm: A case study. Expert Systems with Applications40, 5730-5739.
Shen, W.-f., Zhang, D.-q., Liu, W.-b., and Yang, G.-l. (2016). Increasing discrimination of DEA evaluation by utilizing distances to anti-efficient frontiers. Computers & Operations Research 75, 163-173.
Sheskin, D. J. (2003). "Handbook of parametric and nonparametric statistical procedures," crc Press. Shi, P., Yan, B., Shi, S., and Ke, C. (2015). A decision support system to select suppliers for a sustainable supply chain based on a systematic DEA approach. Information Technology and Management16, 39-49. Soheilirad, S., Govindan, K., Mardani, A., Zavadskas, E. K., Nilashi, M., and Zakuan, N. (2017). Application of data envelopment analysis models in supply chain management: A systematic review and meta-analysis. Annals of Operations Research, 1-55.
Sueyoshi, T., and Goto, M. (2014). Photovoltaic power stations in Germany and the United States: A comparative study by data envelopment analysis. Energy Economics42, 271-288.
Takamura, Y., and Tone, K. (2003). A comparative site evaluation study for relocating Japanese government agencies out of Tokyo. Socio-Economic Planning Sciences37, 85-102.
Toloo, M., and Nalchigar, S. (2011). A new DEA method for supplier selection in presence of both cardinal and ordinal data. Expert Systems with Applications38, 14726-14731.
Visani, F., Barbieri, P., Di Lascio, F. M. L., Raffoni, A., and Vigo, D. (2016). Supplier’s total cost of ownership evaluation: a data envelopment analysis approach. Omega61, 141-154.
Wu, D., Wu, D. D., Zhang, Y., and Olson, D. L. (2013). Supply chain outsourcing risk using an integrated stochastic-fuzzy optimization approach. Information Sciences235, 242-258.
Zeydan, M., Çolpan, C., and Çobanoğlu, C. (2011). A combined methodology for supplier selection and performance evaluation. Expert Systems with Applications38, 2741-2751.