Optimum allocation of Iranian oil and gas resources using
multi-objective linear programming
and particle swam optimization in
resistive economy conditions
Mojtaba Salehi
1*, Mohammad Mahdi Goorkani
21
Assistant Professor, Department of Industrial Engineering, Payame Noor University, Tehran, Iran
2
Payame Noor University, Tehran, Iran
[email protected], [email protected]
Abstract
This research presents a model for optimal allocation of Iranian oil and gas resources in sanction condition based on stochastic linear multi-objective programming. The general policies of resistive economy include expanding exports of gas, electricity, petrochemical and petroleum products, expanding the strategic oil and gas reserves, increasing added value through completing the petroleum value chain and decreasing crude oil and gas sale. The proposed mathematical model includes three objective functions: minimizing imports of petrochemical products and crude oil sale, maximizing economic benefits, and minimizing the environmental pollutions. The model includes constraints of gas, oil and electricity flow balance and also supply and demand capacity constraints. A Pareto-archive-based particle swarm algorithm was used to solve the model. The results of proposed algorithm were compared with NSGA-IIresults. The comparison showed the proposed algorithm is more accurate in solving o f the energy resource allocation model in 2016-2031 timespan. The results of this study can present helpful solutions to oil and gas resource allocation planning in Iran. The main contribution of this paper are proposing a new stochastic linear multi-objective programming with considering the general policies of resistive economy and solving the model with a new Pareto-archive-based particle swarm algorithm.
Keywords: Oil and gas resource Allocation; Stochastic Linear Multi-Objective Programming; Economic Sanction; Resistive Economy; Particle Swarm Optimization
1- Introduction
An important responsibility of any government is to plan and effectively allocate its energy
resources. The fundamental policy of any resistive economy is to increase the exports of oil and gas products and petrochemicals and decrease exports of crude oil and gas. In other words, it must prevent crude oil sale. Furthermore, the increasing demand of petroleum products, saving natural resources for future generations, the need to optimize supply and demand in countries possessing these resources are all undeniable facts. Therefore, this study aims to present a multi-objective mathematical model for optimizing Iranian oil and gas resource allocation in resistive economy conditions.*
Corresponding Author
ISSN: 1735-8272, Copyright c 2017 JISE. All rights reserved Journal of Industrial and Systems Engineering
Vol. 10, No. 4, pp. 43-68 Autumn (November) 2017
2 x
First, a multi-objective mathematical model is proposed and solved using a Pareto-archive-based particle swarm algorithm. Finally, in order to evaluate the performance of this algorithm, the
results are compared with a Non-Dominated Sorting Genetic Algorithm solution.
2-
Literature review
2-1-
Energy resource allocation models
Energy models are standard tools for planning energy usage. There have been many attempts to
formulate and strategically implement energy planning solutions in recent years around the world, which resulted in development of many different energy models.MARKAL model: This model calculates energy balance at every level in a system including the primary source, secondary fuels, final energy and energy services and attempts to offer energy services in a region with minimum cost by investing on equipment, operational decision making and decisions on primary energy supply.
EFOM: The Energy Flow Optimization Model was developed as an energy supply optimization model by the European Union. The model was designed at Institut d'Economique et Juridique de l'Energie (IEJE), Greville, France, in 1970. The model was aimed to develop solutions that made the EU independent of imported oil. The model was structured based on linear programming, intended to minimize the total discount rate for providing energy needs of a country or region in long term assuming different objectives.
With the increasing energy consumption and environmental issues, especially acid rain, the EU tried to find a solution and select technologies to reduce the release of pollutants, notably 𝑆𝑆𝑆𝑆2 and𝑁𝑁𝑆𝑆𝑋𝑋, in the environment. Given that EFOM only takes energy into account, it is not capable of resolving environmental issues. Hence, a new model was introduced that incorporated environmental modules. The extended edition was developed by IIP and was named EFOM-ENV.
TIMES model: In 1999, in order to eliminate the constraints of MARKAL and update it, ETSAP added some of the advantages of MARKAL to EFOM. TIMES (The Integrated MARKAL-EFOM System) is an economic model for local, national or multi-regional energy systems that provides a robust technical basis to dynamically evaluate energy in the span of a long term time horizon consisting of a number of periods. This model is often used to evaluate all of energy sectors, but it might also be applied for evaluating the sectors discretely. Generally speaking, this model aims to supply energy with minimum cost through investment, performance of the equipment, supplying primary energy and energy exchange decisions in a region.
JASP model: This model optimizes production planning based on power plants and takes the costs of transmission grid into account.
MESSAGE model: This model that considers the energy supply and its environmental issues is a dynamic linear planning model and t h a t minimizes discount cost of the total energy at a time horizon.
IDEAS model: This model, being an advanced and further developed version of FOSSIL2, is a US energy supply and demand model and is developed in order to plan the long term behavior of the country's energy system.
LEAP model: This one is a demand-based model and helps to optimize energy supply by estimating energy demand.
MESAP model: A modular energy planning and analysis system which was developed in 1984 at Institute of Energy Economics and Rational Energy Use (IER) in the University of Stuttgart. This model offers a decision support system for integrated management of energy and environment.
2-2- Previous studies
Hashemipour Rafsanjani and Rajabi Kalte (2011) addressed the optimization of gas allocation to an Iranian oilfield. They used both genetic and harmonic algorithms to optimize the allocation of gas to East Assaluye field and sought to maximize the rate of oil production with limited accessible gas and maximize the economic profit in the field.
Alikhani et al. (2012) presented a stochastic planning model for Iranian gas resource allocation with an energy security cost approach. Their results suggest of gas resources must be allocated to
domestic/commercial sectors, power plants, industries, gas reinjection, exports, petrochemical industry, rich gas injection, transport and agriculture respectively.
Kazemi et al. (2011) presented a mathematical model for optimized allocation of Iranian oil and gas resources to different sectors including domestic/commercial, transport, industries, agriculture, exports, injection into oil reservoirs, and power plants as secondary energy producers. The optimized allocation of energy resources to end users was performed, for 2011-21 timespan, using a linear planning model aimed to reduce greenhouse gases.
Kazemi et al. (2012) addressed the problem of selecting the appropriate energy resource allocation model for Iran using Analytic Hierarchy Process. In order to select the best energy supply model and to determine the advantages and disadvantages of different implemented models, 13 energy supply models were examined.
Using a multi-objective goal programming, Mezher et al. (1998) developed a model for energy allocation to end users in Lebanese domestic sector. Agrawal and Singh (2001) formulated cooking energy usage in Indian households using a fuzzy multi-objective programming. Borges and Antunes (2003) formulated the economic energy planning using fuzzy multi-objective decision-making. Sadeghi and Hosseini (2006) developed a model for energy supply in Iran using fuzzy linear programming. Snagmong et al. (2013) presented a mathematical model for locating oil refineries in the supply chain of Thailand. They designed a mathematical model for oil refinery supply chain. The assumed supply chain consists of supplier, factory, biodiesel refinery, warehouses, refineries and gas stations. Their objective was to locate and allocate biodiesel refineries with capacity constraints and also to optimize the material flow in way that minimizes the total cost of supply chain.
NG et al. (2013) addressed the optimization of unsustainable energy resource allocation. They presented a non-linear mathematical model for the problem and solved it using a resource allocation iterative optimization algorithm.
Li et al. (2013) studied the electrical energy allocation problem. They presented a mathematical model aimed to minimize errors considering a certain budget. They also used computer simulation methods to solve the model.
3-
The mathematical resource-allocation model
A mathematical model was proposed for optimized allocation of oil and natural gas to different sectors by considering security, economic, and environmental issues. The model assumes sanction and resistive economy conditions that is as the contribution of paper. Since exports are limited and production costs are increased under such circumstances, the model considers these conditions using Opportunity Cost (Gharibnavaz and Waschik, 2015; Haidar, Jamal, 2015). Furthermore, in resistive economies, a constraint is considered for energy consumption to model the demand constraint. As another contribution of paper, since there are uncertainty conditions for some parameters energy resource allocation problem, this research uses stochastic programming to model the real condition.
3-1-
Parameters and variables
a)Indexes:
o: Domestic/Commercial Sector n:Industrial sector r: Transportation sector c: Agriculture
w: Power plants p: crude oil i: Oil products g: Gasoline x: Exports m: Imports e: Electricity h: Rich gas a: Lean gas j: Injection to oil reservoirs y: Time (year) d: Demand s: Subsidies t: Other types of energy (hydropower, wind, traditional fuels)
k: Price l: Upper limit u: Greenhouse gas emission f: Efficiency
z: Goal w: Dissipation b: Petrochemicals d: Gas Condensates
b) Parameters:
P(Y):
Crude oil Production in the year Y (million barrels)
I(Y):
Production of oil products in the year Y: H(Y): Rich natural gas production in the year Y
A(Y):
Lean natural gas production in the year Y
𝐸𝐸1(𝑌𝑌):
Electricity generation in the year Y
𝐸𝐸(𝑌𝑌):
Electric power after deducting transmission and distribution dissipation in the year Y
𝐷𝐷𝑂𝑂(𝑌𝑌):
Domestic/commercial energy demand in the year Y
)
(
Y
D
n :Energy demanded by industrial sector in the year Y
)
(
Y
D
r :Energy demanded by transportation sector in the year Y
)
(
Y
D
c :Energy demanded by agriculture in the year Y
)
(
Y
D
w :Energy demanded by power plants in the year Y
)
(
Y
D
io :Domestic/commercial demand for oil products in the year Y
)
(
Y
D
in :Industrial sector demand for oil products in the year Y
)
(
Y
D
ir :Transportation sector demand for oil products in the year Y
)
(
Y
D
ic :Agriculture demand for oil products in the year Y
)
(
Y
D
ao :Domestic/commercial demand for natural gas in the year Y
)
(
Y
D
an :)
(
Y
D
ar :Transportation sector demand for natural gas in the year Y
)
(
Y
D
aw :Natural gas demanded by power plants in the year Y
)
(
Y
D
eo :Domestic/Commercial demand for electricity in the year Y
)
(
Y
D
en :Industrial sector demand for electricity in the year Y
)
(
Y
D
er :Transportation sector demand for electricity in the year Y
)
(
Y
D
ec :Agriculture demand for electricity in the year Y
)
(
Y
C
o :Energy security cost of domestic/commercial sector in the year Y
) (Y Cn :
Energy security cost of industrial sector in the year Y
)
(
Y
C
r :Energy security cost of transportation sector in the year Y
)
(
Y
C
c :Energy security cost of agriculture in the year Y
) (Y Cw :
Energy security cost of power plants in the year Y
)
(
Y
c
io :Energy security cost of oil products in domestic/commercial sector in the year Y
)
(
Y
C
in :Energy security cost of oil products in industrial sector in the year Y
)
(
Y
C
ir :Energy security cost of oil products in transportation sector in the year Y
) (Y Cic :
Energy security cost of oil products in agriculture in the year Y
) (Y Cao :
) (Y Can :
Energy security cost of natural gas in industrial sector in the year Y
) (Y Car :
Energy security cost of natural gas in transportation sector in the year Y
) (Y
Caw :
Energy security cost of natural gas in power plants in the year Y
)
(
Y
C
eoEnergy security cost of electricity in Domestic/commercial sector in the year Y
)
(
Y
C
en :Energy security cost of electricity in industrial sector in the year Y
)
(
Y
C
er :Energy security cost of electricity in transportation sector in the year Y
)
(
Y
C
ec :Energy security cost of electricity in agriculture in the year Y
)
(
Y
f
p :The efficiency of oil refineries in the year Y
)
(
Y
f
a :The efficiency of power plants in the year Y
)
(
Y
f
w :Transmission and distribution electricity dissipation in the year Y (%)
) (Y
w :
Petroleum product subsidies in the year Y (%)
) (Y Si :
Gas subsidies in the year Y (%)
)
(
Y
S
a :Electricity subsidies in the year Y (%)
) (Y Se :
The real price of crude oil in the year Y ($ per barrel)
)
(
Y
K
p :The real price of natural gas in the year Y ($ per equivalent barrel of crude oil)
)
(
Y
K
a :2
)
(
Y
K
g :The real price of other oil products in the year Y ($ per equivalent barrel of crude oil)
)
(
Y
K
i :The real price of electricity in the year Y ($ per equivalent barrel of crude oil)
io
U
:Average greenhouse gas emission due to petroleum product consumption in domestic/commercial sector (million tons of CO divided by million barrels of crude oil)
ao
U
:Average greenhouse gas emission due to gas consumption in domestic/commercial sector
to
U
:Average greenhouse gas emission due to traditional fuel consumption in domestic/commercial sector
in
U
:Average greenhouse gas emission due to petroleum product consumption in industrial sector
an
U
:Average greenhouse gas emission due to natural g a s consumption in transportation sector
ir
U
:Average greenhouse gas emission due to petroleum product consumption in transportation sector
ar
U
:Average greenhouse gas emission due to natural g a s consumption in transportation sector
ic
U
:Average greenhouse gas emission due to petroleum product consumption in agriculture
ac U :
Average greenhouse gas emission due to natural g a s consumption in agriculture
iw
U
:Average greenhouse gas emission due to petroleum product consumption in power plants
aw
U
:Average greenhouse gas emission due to natural g a s consumption in power plants
)
(
Y
L
to :The upper limit of traditional fuel consumption in domestic/commercial sector in the year Y
)
(
Y
L
ar :)
(
Y
z
g :The extraction coefficient of Iranian oil refineries in the year Y (%)
)
(
Y
x
gr :Gasoline consumption in transportation sector in the year Y (%)
)
(
Y
x
et :Electricity supplied from sustainable sources in the year Y (%)
c) Variables
)
(
Y
x
pi :Million barrels of crude oil that is transformed to oil products in the year Y
)
(
Y
X
p :Million barrels of the exported crude oil in the year Y
)
(
Y
X
i :Petroleum product exports in the year Y
)
(
Y
X
g :Gasoline exports in the year Y
)
(
Y
M
i :Petroleum product (other than gasoline) imports in the year Y
)
(
Y
M
g :Gasoline imports in the year Y
)
(
Y
x
io :Petroleum products allocated to domestic/commercial sector in the year Y
)
(
Y
x
in :Petroleum products allocated to industrial sector in the year Y
)
(
Y
x
ir :Petroleum products allocated to transportation sector in the year Y
)
(
Y
x
ic :Petroleum products allocated to agriculture in the year Y
)
(
Y
x
iw :Petroleum products allocated to power plants in the year Y
)
(
Y
x
aj :)
(
Y
X
a :Natural gas exported in the year Y
)
(
Y
M
a :Natural gas imported in the year Y
)
(
Y
x
ao :Natural gas allocated to domestic/commercial sector in the year Y
)
(
Y
x
an :Natural gas allocated to industrial sector in the year Y
)
(
Y
x
ar :Natural gas allocated to transportation sector in the year Y
)
(
Y
x
aw :Natural gas allocated to power plants in the year Y
)
(
Y
X
e :Electricity exported in the year Y
)
(
Y
M
e :Electricity imported in the year Y
)
(
Y
x
eo :Electricity allocated to domestic/commercial sector in the year Y
) (Y xen :
Electricity allocated to industrial sector in the year Y
)
(
Y
x
er :Electricity allocated to transportation sector in the year Y
) (Y xec :
Electricity allocated to agriculture in the year Y
3-2- Mathematical model
a) Objective functions
Objective function with political approach: A requirement of resistive economy is imports management. Imports must be minimized to maintain political and energy security. An acceptable solution is import control through strengthening regulations and standards. Increasing tariffs and forcing permits are other solutions for reducing imports. Furthermore, reducing crude oil sale is another requirement of resistive economy. Therefore, the objective function in this section is composed of two parts; the first is minimization of total imported oil product, natural gas, and electricity, while simultaneously considering crude oil sale minimization. Moreover, given the high demand for gasoline as the main fuel consumed in transportation sector, and considering its extraction coefficient in Iranian refineries, it is taken into account apart from other oil products. The second part of this objective function is related to energy security cost which is added as a result of threats caused by international sanctions. Considering the economic sanction
conditions affect the security of energy supply and demand, and assuming “X” to be energy consumption in secure conditions and “x” to be energy consumption in in-secure conditions, it can be said that “X” is lower that “x”; in other words: 𝑥𝑥𝑖𝑖 =𝑎𝑎𝑖𝑖𝑋𝑋𝑖𝑖 where 𝑎𝑎𝑖𝑖 ∈[0,1]. 𝑎𝑎𝑖𝑖 must be specified by experts for each type of energy for the coming year. Hence, for π𝑖𝑖(𝑌𝑌) as the possibility of interruption in energy supply, the cost of energy security is given by C𝑖𝑖(Y) =
π𝑖𝑖(Y)(K𝑖𝑖(Y)(1−a𝑖𝑖)) where K𝑖𝑖(Y) is the price of energy. In addition, as it was previously mentioned, a stochastic energy allocation model is proposed in this study. In fact, cost and demand parameters are considered stochastic with a normal distribution function.
(1)
Objective function with economic approach: The second goal is to maximize economic benefits including petrochemical product exports and total value of oil products, natural gas and electricity after subtracting the total value of imported oil products, natural gas, and electricity and also the subsidies allocated to different sectors.
( 2 )
Objective function with environmental approach: A certain amount of greenhouse gases, including carbon dioxide, methane and nitrogen oxide is emitted when any energy carrier, such as oil products, gas and traditional fuels, is consumed. Emission factors are calculated for each petroleum product in different sectors considering the greenhouse gas emission factor due to
∑ ∑
∑ ∑
∑ ∑
∑ ∑
+ + + + + + + + + + + + + + + + + + + + + + + + + + + + + + + + + + + + + + + + + + + + + + + + + = 2 2 2 2 2 p 2 2 2 2 1 )) ( ) ( ) ( ) ( ) ( )( ( )) ( ) ( ) ( ) ( ) ( ( )) ( ) ( ) ( ) ( ) ( )( ( )) ( ) ( ) ( ) ( ) ( ( )) ( ) ( ) ( ) ( ) ( )( ( )) ( ) ( ) ( ) ( ) ( ( )) ( ) ( ) ( ) ( ) ( )( ( )) ( ) ( ) ( ) ( ) ( ( ) ( ) ( ) ( X ) ( ) ( ) ( ) ( ) ( ) ( ) ( ) ( ) ( ) ( ) ( ) ( ) ( ) ( ) ( ) ( ) ( ) ( Y x Y x Y x Y x Y x C VAR Z Y x Y x Y x Y x Y x C Y x Y x Y x Y x Y x C VAR Z Y x Y x Y x Y x Y x C Y x Y x Y x Y x Y x C VAR Z Y x Y x Y x Y x Y x C Y x Y x Y x Y x Y x C VAR Z Y x Y x Y x Y x Y x C Y X K VAR Z Y Y K Y M K VAR Z Y M Y p Y M K VAR Z Y M Y K Y M K VAR Z Y M Y K Y M K VAR Z Y M Y K Y z Min bw bc bn br bo b b bw bc bn br bo b ew ec en er eo e e ew ec en er eo e gw gc gn gr go g g gw gc gn gr go g iw ic in ir io i i iw ic in ir io i p p p p a a a a a e e e e e g g g g g i i i i i 2 2( )
( )(
( )
( )
( )(
( )
( )
( )
( )
( )))
(
)(
( )
( )
( )(
( )
( )
( )
( )
( )))
( )(
( )
( )
( )(
( )))
(
)(
( )
( )
( )(
i i i i io ir
in ic iw
i i i i i io ir in ic iw
g g g g gr
g g g g g gr
Max z Y
K Y
X Y
M Y
S Y
x
Y
x Y
x
Y
x
Y
x
Y
Z
V AR K
X Y
M Y
S Y
x
Y
x Y
x
Y
x
Y
x
Y
K Y
X
Y
M Y
S Y
x
Y
Z
V AR K
X
Y
M Y
S Y
x
=
−
−
+
+
+
+
+
−
−
+
+
+
+
+
−
−
+
−
−
22
( )))
( )(
( )
( )
( )(
( )
( )
( )
( )
( )))
(
)(
( )
( )
( )(
( )
( )
( )
( )
( )))
( )(
( )
( )
( )(
( )
( )
( )
( )))
(
)(
a a a a ao ab ar an aw
a a a a a ao ab ar an aw
e e e e eo er en ec
e e e
Y
K Y
X Y
M Y
S Y
x
Y
x
Y
x
Y
x
Y
x
Y
Z
V AR K
X Y
M Y
S Y
x
Y
x
Y
x
Y
x
Y
x
Y
K Y
X Y
M Y
S Y
x
Y
x
Y
x
Y
x
Y
Z
V AR K
X
+
−
−
+
+
+
+
+
−
−
+
+
+
+
+
−
−
+
+
+
+
2
consumption of that product and its average consumption in the last five years. The greenhouse gas emission factor is calculated for methane and nitrogen oxide in the following function, considering the emitted carbon dioxide and the equivalent carbon dioxide. Thus, the objective function presents the total greenhouse gas emission minimization due to consumption of different energy carriers.
(3)
Constraints:
Oil balance constraints: the crude oil extracted from oil reservoirs can be transformed to oil products.
) ( ) (Y x Y
P = pi
(4)
Moreover, considering the efficiency of refineries, the crude oil sent to them is transformed to certain amounts of oil products.) ( ) ( )
(Y x Y f Y
I = pi × i (5) Total imported and Iranian-produced oil products are equal to the sum of exported oil products and products allocated to different sectors.
(6)
The gasoline consumed in transportation which is a certain amount of total consumed energy in this sector is equal to the sum of gasoline produced in Iranian refineries which is a given portion of total oil products, produced by Iranian refineries and the imported gasoline. In case of surplus production, gasoline is exported.(7)
Natural gas balance constraints: The rich gas produced from gas reservoirs is sent to refineries and transformed into a certain amount of lean gas based on the refinery efficiency.
(8)
The sum of imported and produced lean gas is equal to exported gas and gas allocated to different sectors. ) ( ) ( ) ( ) ( ) ( ) ( ) ( ) ( ) ( Y x Y x Y x Y x Y x Y x Y X Y m Y a b aw ar an ao aj a a + + + + + + = +(9)
Electricity balance constraints: The energy carriers (natural gas and oil products) sent to thermal power stations is transformed into a certain amount of electric power based on power plant efficiency. The electric power produced in thermal, wind and hydro power stations is allocated to different sectors. Therefore, the total power generated in sustainable-resource power plants and thermal power stations is equal to the total power available to allocate to different sectors.
) ( ) ( )) ( ) ( ( )
(Y x Y x Y f Y e1T
kt + iw + aw × e =
(10)
According to the plans for using of renewable energy sources in power plants, a certain portion of electric power is generated using these resources, the following constraint is also implemented.
) ( ) ( )
(Y e1 Y k Y
kt = × tw
(11)
The power produced is allocated to different sectors. The following constraint is applied considering transmission and distribution dissipations.( ) ( ) ( ) ( ) ( )
( ) ( ) ( ) ( )
i g i io
in ir ic iw
I Y M Y M Y X Y x Y
x Y x Y x Y x Y
+ + = + +
+ + +
( ) ( ) ( ) ( ) ( ) ( )
( ) ( ) ( )
ot bt b b b
bt b
x T p T o T z T I T E T
x T o T z T
× = × + −
= ×
( ) ( ) a( ) a Y =h Y ×f Y
3
( )
( )
( )
( )
( )
( )
( )
( )
( )
( )
( )
io io ao ao to to
mi mi an an ir ir ar ar
ic ic iw iw aw aw
Min z Y
U x
Y
U x
Y
U x
Y
U
x
Y
U x
Y
U x
Y
U x
Y
U x
Y
U
x
Y
U
x
Y
=
+
+
+
+
+
+
) ( ) ( )
(Y e1Y wY
e = ×
(12)
Furthermore, the total power generated (dissipations subtracted) and imported is equal to the exported electric power and power allocated to different sectors.) ( ) ( ) ( ) ( ) ( ) ( ) ( Y x Y x Y x Y x Y X Y m Y e ec er en eo e e + + + + = + (13)
Demand constraints: This includes total energy consumption constraints in different sectors and also demand constraint pertaining to different energy carriers, namely oil products, gas, electric power, petrochemicals etc. in different sectors.
Demand constraints of domestic/commercial sector: The total oil products, natural gas, electric power, and traditional fuels allocated to domestic/commercial sector is greater than or equal to the total demand in this sector. Moreover, this sector's demand for oil products, gas and electric power is taken into account separately.
)) ( ( )) ( ( ) ( ) ) ( ( )) ( ( ) ( ) ) ( ( )) ( ( ) ( )) ( ( )) ( ( ) ( ) ( ) ( ) ( Y D VAR Z Y D E Y x Y D VAR Z Y D E Y x Y D VAR Z Y D E Y x Y D VAR Z Y D E Y x Y x Y x Y T eo Deo eo eo ao Dao ao ao io Dio io io o Do o eo ao io o + ≥ + ≥ + ≥ + ≥ + + +
(14)
Demand Constraints of Industrial Sector: Total oil products, natural gas, electric power, petrochemicals, and traditional fuels allocated to industries is greater than or equal to the total energy demand in the sector. Moreover, industrial demand for oil products, gas, electric power and petrochemicals is separately taken into consideration.
..
)) ( ( )) ( ( ) ( )) ( ( )) ( ( ) ( )) ( ( )) ( ( ) ( )) ( ( )) ( ( ) ( )) ( ( )) ( ( ) ( ) ( ) ( Y D VAR Z Y D E Y x Y D VAR Z Y D E Y x Y D VAR Z Y D E Y x Y D VAR Z Y D E Y x Y D VAR Z Y D E Y x Y x Y x bn Dbn bn bn en Den en en an Dan an an in Din in in n Dn n en an in + ≥ + ≥ + ≥ + ≥ + ≥ + + (15)Demand constraints of transportation sector: Total oil products, natural gas, and electric power allocated to transportation sector is greater than or equal to the total energy demand in the sector. Moreover, industrial demand for oil products is separately taken into consideration. Given the limited current infrastructure for utilization of Compressed Natural Gas (CNG) and electricity in this sector, the corresponding constraints were taken into account as upper and lower constraints. )) ( ( )) ( ( ) ( )) ( ( )) ( ( ) ( ) ( ) ( Y D VAR Z Y D E Y x Y D VAR Z Y D E Y x Y x Y x ir Dir ir ir r Dr r er ar ir + ≥ + ≥ +
+
(16)
Demand constraints of agriculture: Total oil products and electric power allocated to agriculture is greater than or equal to the total demand for energy in the sector. Moreover, the demand for oil products and electric power in the sector are taken into account separately.
)) ( ( )) ( ( ) ( )) ( ( )) ( ( ) ( )) ( ( )) ( ( ) ( ) ( Y D VAR Z Y D E Y x Y D VAR Z Y D E Y x Y D VAR Z Y D E Y x Y x ec Dec ec ec ic Dic ic ic c Dc c ec ic + ≥ + ≥ + ≥ +
(17)
Demand constraints of power plants: Total oil products and natural gas allocated to thermal power stations is greater than or equal to the total demand for energy in the sector. Moreover, given that natural gas is preferred to oil products in this sector, the demand for gas is taken into account separately. )) ( ( )) ( ( ) ( )) ( ( )) ( ( ) ( ) ( Y D VAR Z Y D E Y x Y D VAR Z Y D E Y x Y x aw Daw aw aw w Dw w aw iw + ≥ + ≥ +
(18)
Constraints of gas demand for injection into oil reservoirs: After more than 100 years of oil industry activity in Iran, most of Iranian oilfields, especially large oilfields in dry parts of the country, are at the middle of their lives. Therefore, Enhanced Oil Recovery (EOR) techniques are used to maintain the production capacity. Based on the studies, gas injection is recognized as the most applicable method of oil extraction in dry regions of Iran; thus the gas allocated to injection into oil reservoirs is greater than or equal to the demand specified by experts.
)) ( ( ))
( ( )
(Y E D Y Z VAR D Y
xaj ≥ aj + Daj aj
(19)
Constraints of gas demanded as feed for petrochemical industry: The feed for petrochemical industry is provided by products obtained by extracting crude oil, such as natural gas-condensates or refinery byproducts such as Naphtha or Methane extracted from natural gas. Petrochemical products are used as raw material for many downstream sectors such as textiles, cosmetics, detergents, paints and resins, solvents, fertilizers and pesticides, rubber, shoes, packaging (especially for food and drugs). Thus we have:
.
xdb(Y)≥E(Ddb(Y))+ZDdb VAR(Ddb(Y))(20)
Upper and lower limits of the variables:
Upper and lower limits of CNG and electric power usage in transportation sector: As it was mentioned, the infrastructure for utilization of CNG and electric power in transportation is limited, hence the following constraints are implemented in the model.
The natural gas allocated to transportation sector in each year is greater than or equal to that in the preceding year and smaller than or equal to the maximum amount possible. The maximum usage of natural gas is specified by CNG station developing programs, which are in custody of Iran Fuel Conservation Company.
Moreover, the electric power allocated to transportation sector in each year is greater than or equal to that of the preceding year and smaller than or equal to the maximum electric power consumption, which is specified by subway development programs that are in custody of Tehran Urban and Suburban Railway Operation Co.
)) ( ( ))
( ( ) ( ) 1
(Y x Y E L Y Z VAR L Y
xar − ≤ ar ≤ ar + lar ar
(21)
)) ( ( ))
( ( ) ( ) 1
(Y x Y E L Y Z VAR L Y
xer − ≤ er ≤ er + ler er
(22)
Upper limit of traditional fuel consumption in domestic/commercial sector:
Villagers residentin woodlands often use timber, charcoal, bushes and animal dung for fuel. In recent years, a declining trend is seen in utilization of such fuels given the expansion of gas distribution grids to villages and adequate distribution of liquid fuels. Therefore, traditional fuel consumption in domestic/commercial sector each year is lower than or equal to the upper limit compared to the preceding year, which is deduced form the average reduction of consumption in the last five years.
..
Tn(Y)≤E(Ltn(Y))+Ztn VAR(Ltn(Y))(23)
Lower limit of the exports: In the proposed model, the lower limit of natural gas exports, and the upper limit of crude oil exports are considered along with the exports in the preceding year. Therefore, the following constraints were applied to the model. The corresponding modifications are made in the years in which crude oil exports is reduced according to future plans of the Iranian Ministry of Petroleum.
) ( ) 1
(Y X Y
Xp − ≥ p
(24)
)( ) 1
(Y X Y
Xa − ≤ a (25)
4- Solution algorithm
A multi-objective particle swarm solution based on Pareto- archive was proposed to solve the
model.4-1- Solution presentation
Every variable is represented by a one-dimensional matrix. In fact, every answer includes multiple one-dimensional matrices that are designed according to model outputs. One-dimensional matrices include Y elements, with Y being the number of the studied years. For example, in the natural gas export matrix, the third element includes the information about exports in the third year of the studied period.
4-2- Generation of the initial solutions
A parallel variable neighborhood search method is proposed for finding initial solutions. The main goal of exploiting this method is to generate initial solutions with adequate quality and diversity. Five operators are used in parallel. In every neighborhood search function, a solution is sent to the corresponding function as the initial solution; at the first step, the corresponding operator is applied to the solution and a solution neighborhood is obtained. Considering the rule proposed by deb et al. (2002), after generating all the neighborhood solutions, the highest quality solution is chosen and, if not repetitive, is added to the initial solution population. In the following, the solution search operators and their parallel combination, as the parallel variable neighborhood search procedure, are explained.
Explaining five solution search operators:
Operator 1: Two indices, such as y1 and y2, are generated in the uniform interval [1,Y] (Y where is the number of studied years), then the resources allocated to domestic sector in the two years are exchanged, applying the flow balance constraints in different energy sectors and demand constraints.
Operator 2: Two indices, such as y1 and y2, are generated in the uniform interval [1,Y] (Y where is the number of studied years), then the resources allocated to industrial sector in the two years are exchanged, applying the flow balance constraints in different energy sectors and demand constraints.
Operator 3: Two indices, such as y1 and y2, are generated in the uniform interval [1,Y] (Y where is the number of studied years), then the resources allocated to agriculture in the two years are exchanged, applying the flow balance constraints in different energy sectors and demand constraints.
Operator 4: Two indices, such as y1 and y2, are generated in the uniform interval [1,Y] (Y where is the number of studied years), then the resources allocated to transportation sector in the two years are exchanged, applying the flow balance constraints in different energy sectors and demand constraints.
Operator 5: Two indices, such as y1 and y2,are generated in the uniform interval [1,Y] (Y where is the number of studied years), then the resources allocated to power plants in the two years are exchanged, applying the flow balance constraints in different energy sectors and demand constraints.
The five neighborhood operators described are applied in parallel. Multiple neighboring solutions, being local optimums, are reported based on the initial solution. Then according to the rule proposed by Deb et al (2002) , the highest quality solution reported is chosen and, if not repetitive, is added to solution population as discussed earlier.
Assume the number of available solutions for each iteration of algorithm is N. This number remains constant during optimization.
In order to generate N desirable feasible solutions, the proposed parallel neighborhood search algorithm must generate N non-repetitive feasible solutions. The proposed algorithm assumes a pre-specified feasible solution as the initial solution. The proposed method first inputs the available solution to the parallel neighborhood search and choses a solution as the output and, if not repetitive, adds the output to the solution population. This procedure continues until the termination condition is attained. The general structure of initial solution generation trend is as follows:
0 – Set the counter to zero
1 – Input s to the parallel neighborhood search structure and name the output s.
2 – In case the solution s is not repetitive, add it to the initial solution population and add 1 to the counter
3 – If counter is smaller than N (population size) return to 1, else proceed to 4 4 – End.
4-3- Improvement procedure
The improvement procedure proposed for this research is based on Variable Neighborhood Search (VNS). Five Neighborhood Search Structures (NSS) were developed and combined with VNS. The neighborhood search structures that were used to make the VNS procedure are the same five (solution) neighborhood search structures that were described in the previous section that are combined together in the form of a VNS structure. After applying the neighborhood structure on the solution, an acceptance procedure is implemented on the obtained solution and the previous solution, and then one of the two is chosen as the solution of the next VNS repetition. The acceptance procedure specifies and choses the dominant solution using non-dominated relations.
4-4- Particle update
Genetic algorithm operators were used to update particles. Particles are updated according to the following equation (Mezher, 1998).
t i t g t i t i t i t
i x p x p x
x +1 =( − )+( − )+ (27)
1
+ t i
x
is the i-th particle in t-th iteration (generation)t i
x
is the i-th particle in t-th ierationt i
p
is the best solution that was attained by the i-th particle up to this point (up to this generation)t g
p
is the best solution found up to this pointt i
x
is a neighborhood of which was generated using the Jump operator '-' is the sign of cross-exchange operator'+' is the sign of choice
In fact, five solutions are generated in order to obtain the i-th solution in t + 1 - th iteration: two are resulted from implementing the cross-exchange operator between
x
it andt i
p
, two are resulted from implementing the cross-exchange operator betweenx
it andp
it and one is obtained from applying jump operator onx
it . Finally, the most diverse, best quality solution is chosen asthe
x
it+1. Indeed,p
gt andsolutions. next attain to guides as used arep
itCross-exchange operator: The cross-exchange operator designed for this research is a single-point cross-exchange operator.
Jump operator: The jump operator used in Eq. (28) is the same Variable Neighborhood Search (VNS) algorithm that was described in the previous section.
4
-5-
Updating
p
gtand
p
itFor every i-th particle, If a better neighborhood, compared to pi, is available among
neighborhoods found for the solution, then pi is replaced with that neighborhood; if not, no change
is done. If the best of the solutions found is better than pg then pg is replaced with it; otherwise no change is done.
4-6- Updating Pareto archive
The non-dominated solutions are updated by adding the solutions generated in the same iteration and the solutions available in the Pareto archive to a solution pool and then tiering them. The first tier, or the non-dominated solutions, is considered the new Pareto archive.
4-7- Choosing the solution
The algorithm needs a population of solutions for each iteration. In this study, the solutions of each iteration are added to a pool of solutions together with the new solutions generated by the algorithm in order to choose the population for the next iteration. After tiering and calculating crowding distance for each solution considering its tier, solutions with the best quality and diversity are chosen as the population of the next iteration using Deb's rule.
5-
Computational results
In this section, first, adjustments of the algorithm and model parameters are explained and then model solutions are presented.
5-1- Parameters of the solution algorithm
• Population size is assumed 200 and 5 parallel neighborhood search iterations are considered in Particle Swarm Optimization (PSO) algorithm.
• Population size is assumed 150, crossing rate is assumed to be 0.8 and jumping rate to be 0.1 in the NSGA-II.
5-2- Data of model
The data needed for running the model were gathered from Iranian Ministry of Petroleum, U.S. Energy Information Administration (EIA), Iranian Ministry of Energy, Bureau of Power and Energy Planning, national Iranian Oil Refining and Distribution Company, National Iranian Gas Co., Iran Fuel Conservation Company, Tehran Urban and Suburban Railway Operation Co., Iranian Center of Statistics, Institute for International Energy Studies, Iranian Hydrocarbon Balance Sheet, and Iranian Energy Balance Sheet (Asadi, 2007).
The following assumptions were made based on the information gathered from corresponding organizations:
• In order to put resistive economy policies into practice, promote social justice, increase water and energy consumption efficiency, reallocate subsidies to increase production and expand the role of people in economy, the price of water, energy carriers and other subsidized goods and services are gradually modified (in the time period until 2020), with regard to social and economic considerations and maintaining a relative advantage for industries and production. The resources obtained from the subsidy reform plan will be exploited to increase production, employment and efficiency, to reduce energy intensity and promote social justice by directly paying subsidies and supporting the underprivileged.
• All phases of South Pars oilfields will be operational before the end of 2017, and petrochemical product exports from this region will reach 20 million tons at the end of the sixth development plan.
• During reformation of subsidies, until the end of the sixth development plan, the prices of petroleum products and electric power are gradually increased to 60% of the global price, and the price of natural gas is increased to 200% of the global price. The prices of petroleum products and electric power in the span of 2016 to 2020 will increase to 50%, 70%, 80% and 90% of the global price respectively. At the same time the price of natural gas will reach 50%, 60%, 70%, and 75% of the global price.
• Carbon dioxide, methane, and nitrogen oxide are called greenhouse gases. Equivalent carbon dioxide was considered when calculating methane and nitrogen oxide emission, since the effective greenhouse gas index, being the Global Warming Potential, for methane and nitrogen oxide in a time horizon of 100 years, are respectively 21 and 310 times the GWP of carbon dioxide. What's
more, the greenhouse gas emission due to consumption of each petroleum product was calculated based on the share of that particular product in the average consumption of the last five years. • Subway lines are at most extended by 25 kilometers every year.
• The gasoline extraction coefficient is improved by 5% every year.
• The efficiency of Iranian power plants is increased by 5% every year up to 55%. • The efficiency of Iranian oil refineries is increased by 5% until 2031
• The efficiency of Iranian gas refineries is increased by 5% until 2031
• Every year, at least 20% of the energy required by thermal power stations is supplied by petroleum products. Moreover, until 2031, 30% of the electric power is generated by means of sustainable energy sources.
• Traditional fuel consumption in domestic/commercial sector is reduced by 8% every year. This is specified considering the available data suggesting the declination oftraditional fuel consumption in the domestic/commercial sector in recent years and also with regard to the expansion of gas and petroleum product distribution in villages.
• Every year the exported petroleum and petrochemical products and natural gas will not be less than that of the preceding year. In addition, in the years in which, based on the future plans of the Iranian Ministry of Petroleum, crude oil production is decreased, the minimum crude oil export is 10%.
The energy demand, including the total energy demand and demand for petroleum products, natural gas and electric power in different sectors were determined based on the data reported by Kazemi et al. (2013). The demand is considered probabilistic. M is assumed to be the median and R to be the amplitude of variation in normal distribution with upper and lower limits being assumed 10% of the median. Therefore R=0.2 M ،𝑅𝑅
4=σ ، and Zα is assumed 1.645.
5-3- Model solution results
The model is solved based on the gathered data, using multi- objective particle swarm algorithm. The results are presented in the diagrams 1 to 9.
Figure 1. Allocation of petroleum products to transportation sector (Equivalent million barrels of crude oil)
Figure 2. Allocation of petroleum products and natural gas to domestic/commercial sector (Equivalent million barrels of crude oil)
Figure 3. Allocation of petroleum products to agriculture (equivalent million barrels of crude oil)
Figure 4. Allocation of petroleum products and natural gas to industrial sector (Equivalent million barrels of crude oil)
Figure5. Allocation of natural gas to be injected into oil reservoirs (Equivalent million barrels of crude oil)
It is evident that the allocation of petroleum product to domestic/commercial sector is declining whilst more natural gas is being allocated to this sector, the reason is the development of gas distribution in Iran. Transportation sector is one of the main consumers of petroleum products. Due to the lack of required infrastructure, initially, the consumption of natural gas in this sector is limited; but it grows as infrastructure is expanded. The consumption of petroleum products and natural gas in the industrial sector shows an increasing trend. Also given the policies of resistive economy suggesting development of agriculture, the consumption of petroleum product in this sector is escalating. Consumption of petroleum products and natural gas is increasing in power plants too. A Large part of primary energy needs of power plants is supplied by natural gas, thus lowering greenhouse gas emission. Large quantities of gas are also needed for injection to oil reservoirs. This shows an increasing trend. Allocation of natural gas condensates to petrochemical industries and crude oil to refineries are rising sharply due to resistive economy policies implemented for limiting crude oil export and increasing petrochemical production. Therefore, crude oil exports show a declining trend which is resulted by both resistive economy policies and less extraction due to aging Iranian oil reservoirs. Petroleum product exports are also boosting, showing faster growth from 2020 on. Petrochemical product exports are also increasing.
Figure 6. Allocation of petroleum products and natural gas to power plants (Equivalent million barrels of crude oil)
Figure 7. Allocation of natural gas condensates to petrochemical industries (Equivalent million barrels of crude oil)
Figure 9. Exports (equivalent million barrels of crude oil)
6.4.
Comparative study on MPSO and NSGA-II
There are numerous indicators for evaluating the quality and diversity of multi-objective
metaheuristic algorithms. Three Metrics were considered in this study, which are readily
discussed.
Quality metric
: This metric compares the quality of Pareto solutions obtained from each
method. In fact, this metric tiers all Pareto solutions of both methods and determines
how much of the solutions in each tier belong to a method. The higher the share of a
method in Pareto solutions, the higher the quality of that method.
Spacing metric
: This indicator tests the distribution uniformity of Pareto solutions in
boundaries and is defined as follows:
Where
d
iis the Euclidean distance between two neighboring non-dominated solutions
and
d
meanis the average of
d
i.
Diversity metric
: This metric is used to determine the number of non-dominated
solutions found on the optimized boundary. Diversity metric is defined as follows:
)
max(
1
∑
=−
=
Ni
i t i
t
y
x
D
Where
it i t y
x −
shows the Euclidean distance between two neighboring solutions of
x
tiand
i t
y
on the optimized boundary.
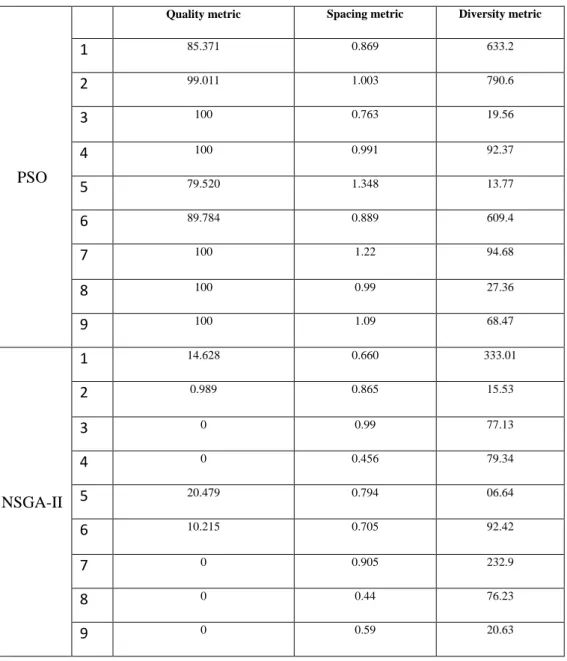
The presented model was also solved using NSGA-II algorithm, based on the same data.
The two algorithms were compared on the basis of the metrics described. It should be
noted that the studied problem was solved 10 times using both algorithms, and the metrics
were calculated for every run. The results are presented in Table 1.
(30) 1
1
(
1)
N
mean i
i
mean
d
d
s
N
d
−
=
−
=
− ×
Table 1.Comparing the performance of Particle Swarm and NSGA-II algorithms
Diversity metric Spacing metric
Quality metric
PSO
633.2 0.869
85.371
1
790.6 1.003
99.011
2
19.56 0.763
100
3
92.37 0.991
100
4
13.77 1.348
79.520
5
609.4 0.889
89.784
6
94.68 1.22
100
7
27.36 0.99
100
8
68.47 1.09
100
9
333.01 0.660
14.628
1
NSGA-II
15.53 0.865
0.989
2
77.13 0.99
0
3
79.34 0.456
0
4
06.64 0.794
20.479
5
92.42 0.705
10.215
6
232.9 0.905
0
7
76.23 0.44
0
8
20.63 0.59
0
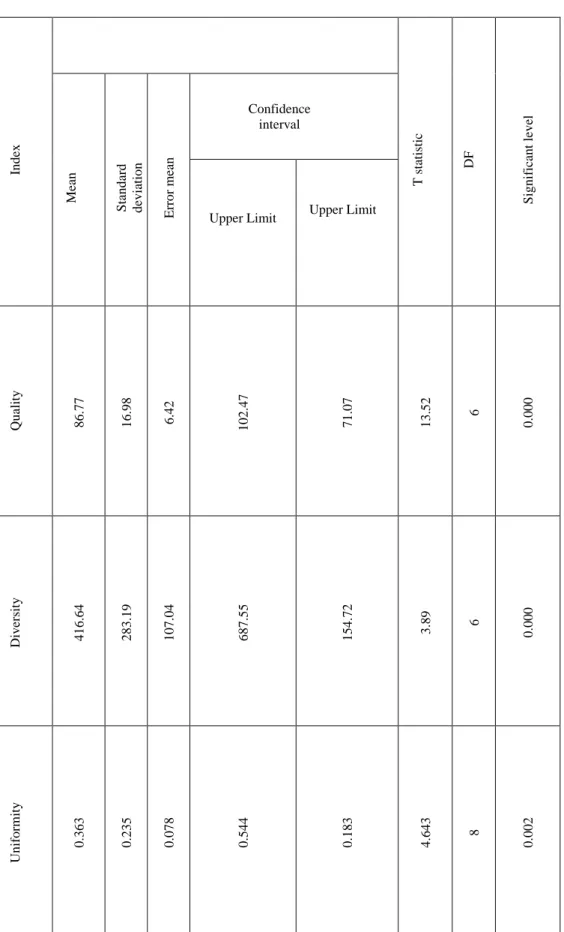
Table 2. The results of first hypothesis test
S
ig
n
if
ic
an
t le
v
el
DF
T s
ta
tis
ti
c
Inde
x
Confidence interval
E
rror m
ea
n
S
ta
nda
rd
de
vi
at
ion
M
ean
0.
000
6
13.
52
71.
07
102.
47
6.
42
16.
98
86.
77
Q
u
ality
0.
000
6
3.
89
154.
72
687.
55
107.
04
283.
19
416.
64
D
iv
er
sity
0.
002
8
4.
643
0.
183
0.
544
0.
078
0.
235
0.
363
U
ni
form
it
y
The results presented in Table 1, show MPSO algorithm to be more capable in generating high quality solutions, for every run (a total of 10 runs). MPSO offers more diverse solutions; in other words, MPSO is more capable for discovering and extracting solutions from possible solution regions compared to NSGA-II. As it is evident from the table above, NSGA-II offers more uniform solutions.
Furthermore, in order to compare the performance of MPSO and NSGA-II, t-test with two independent samples was employed. The results of the two algorithms are compared by establishing adequate hypotheses based on statistical analysis. T-student test was exploited in order to examine the differences between comparative indicators, which is discussed in the following.
Hypothesis zero: There is no significant difference between quality, diversity, and uniformity metrics of PSO and NSGA- II algorithms.
Hypothesis 1: There is a significant difference between quality, diversity, and uniformity metrics of PSO and NSGA- II algorithms.
The results of examining the significance level of the difference between quality, diversity and uniformity metrics of PSO and NSGA-II algorithms is presented in Table 2 for 10 solution runs. It is evident from the table that the t-statistic calculated for neither of the three metrics lies within 95% confidence interval. Therefore, hypothesis zero, suggesting no significant difference between the metrics, is false; validating hypothesis 1. So it can be said that there is a significant difference between quality, diversity and uniformity indicators of the two algorithms.
7- Conclusion
Many energy models have been proposed for developing countries to satisfy different needs in
energy planning. This research presents a model for optimal allocation of Iranian oil and gas resources in sanction condition. A new stochastic linear multi-objective programming is proposed to tackle uncertainty and imprecision data with considering the general policies of resistive economy, aimed at providing decision support to decision makers in the study of the interactions between the energy system and the economy on a national level. A Pareto-archive-based particle swarm algorithm was used to solve the model. The comparison showed the proposed algorithm is more accurate than NSGA-II. Results of the study are summarized as follows:• Allocation of petroleum products to domestic/commercial sector shows a declining trend whilst more natural gas is being allocated to this sector due to expansion of gas distribution network in Iran.
• The results show transportation sector to be one of the main consumers of petroleum products. Consumption of natural gas is limited in this section due to lack of the required infrastructure. But it will gradually grow as the adequate infrastructure is expanded.
• Consumption of petroleum products and natural gas is increasing in industrial sector. • Consumption of petroleum products is slightly increasing in agriculture.
• Consumption of petroleum products and natural gas by power plants is increasing with a large portion of their primary energy needs being supplied by natural gas, which reduces greenhouse gas emission.
• Gas injection to oil reservoirs requires large quantities of gas and shows to be growing. • Natural gas condensates are being increasingly allocated to petrochemical industries.
• Crude oil is being increasingly allocated to refineries.
• Due to resistive economy policies, suggesting reduction of crude oil exports while expanding the exports of natural gas, petroleum products and petrochemicals, and also Iranian aging oil reservoirs, crude oil exports are declining.
• Petroleum product exports are expanding • Petrochemical product exports are expanding • Natural gas exports are expanding
• The comparison between MPSO and NSGA-II algorithms shows the better performance of the proposed algorithm in order to be used as the energy resource allocation model in the span of 2016-31.