Georgia State University
ScholarWorks @ Georgia State University
Sociology Theses Department of Sociology
1-6-2017
Red Show, Blue Show: A Content Analysis of
Liberals’ and Conservatives’ Respective Television
Favorites
Nicholas Rogers
Follow this and additional works at:https://scholarworks.gsu.edu/sociology_theses
This Thesis is brought to you for free and open access by the Department of Sociology at ScholarWorks @ Georgia State University. It has been accepted for inclusion in Sociology Theses by an authorized administrator of ScholarWorks @ Georgia State University. For more information, please [email protected].
Recommended Citation
Rogers, Nicholas, "Red Show, Blue Show: A Content Analysis of Liberals’ and Conservatives’ Respective Television Favorites." Thesis, Georgia State University, 2017.
RED SHOW, BLUE SHOW: A CONTENT ANALYSIS OF LIBERALS’ AND
CONSERVATIVES’ RESPECTIVE TELEVISION FAVORITES
by
NICK ROGERS
Under the Direction of Ben L. Kail, PhD
ABSTRACT
Ideological partisans in the United States are increasingly “sorting” themselves along
cultural lines, from the cable news stations they watch to the chain restaurants they prefer. How
do partisans seem to “know” how to sort themselves along ideological lines in cultural realms
that offer no obvious political cues?
To investigate this question, I look to the realm of narrative television, where
conservatives and liberals have certain unique favorite programs despite the programs lacking
any overt political content. I employ a quantitative content analysis to demonstrate that the
substance of these polarizing shows relate to the social traits of curiosity, conformity, relativism,
dogmatism, tribalism, vigilance, and chastity, which have previously been demonstrated to
correspond to political ideology.
RED SHOW, BLUE SHOW: A CONTENT ANALYSIS OF LIBERALS’ AND
CONSERVATIVES’ RESPECTIVE TELEVISION FAVORITES
by
NICK ROGERS
A Thesis Submitted in Partial Fulfillment of the Requirements for the Degree of
Master of Arts
in the College of Arts and Sciences
Georgia State University
Copyright by Nicholas Lincoln Rogers
RED SHOW, BLUE SHOW: A CONTENT ANALYSIS OF LIBERALS’ AND
CONSERVATIVES’ RESPECTIVE TELEVISION FAVORITES
by
NICK ROGERS
Committee Chair: Ben L. Kail
Committee: Wendy Simonds
Eric R. Wright
Electronic Version Approved:
Office of Graduate Studies
College of Arts and Sciences
Georgia State University
viii
TABLE OF CONTENTS
LIST OF TABLES ... x
LIST OF FIGURES ... xi
1 INTRODUCTION ... 1
2 LITERATURE REVIEW ... 2
2.1 Ideology ... 2
2.2 Sorting ... 3
2.3 Social Traits ... 7
2.4 Polarization ... 8
2.5 Television ... 10
3 METHODOLOGY ... 11
3.1 The Shows ... 12
3.2 Scoring Rubric ... 17
3.3 The Reviewers ... 22
4 FINDINGS ... 25
5 DISCUSSION ... 31
6 CONCLUSION ... 33
REFERENCES ... 36
ix
Appendix A : List Of Episodes Evaluated ... 40
x LIST OF TABLES
Table 1: Social Traits and Corresponding Story Features ... 19
Table 2: Results of Inter-Rater Reliability Test by Story Feature ... 24
Table 3: Shows Listed From Most Liberal to Most Conservative ... 26
Table 4: Mean Ratings for Individual Story Traits Across Audience Ideology ... 28
Table 5: Composite Ratings versus Adjusted Composite Ratings ... 30
Table 6: Composite Ratings versus Adjusted Composite Ratings (Aggregate) ... 30
xi
LIST OF FIGURES
Figure 1: Scatterplot of Shows by Index Differential and Composite Rating ... 27
1
1 INTRODUCTION
The idea of ideological “sorting” is that people tend to “segregate themselves into their own
political worlds, blocking out discordant voices and surrounding themselves with reassuring
news and companions.” (Bishop 2009). In realms with overt ideological messages – like political
parties, media outlets, and religious denominations – it is easy to see how political partisans
select the particular options that match their viewpoints. But it is much more difficult to
understand the mechanisms of partisan sorting in other realms in which it has been observed, like
college majors, restaurant preferences, and taste in fine art. How do partisans seem to “know”
how to sort themselves along ideological lines in cultural realms that offer no obvious political
cues?
To investigate this question, I look to the realm of narrative television, where conservatives
and liberals have certain unique favorite programs despite the programs lacking any overt
political content. I employ a quantitative content analysis to test the idea that the substance of
these polarizing shows relate to the social traits of curiosity, conformity, relativism, dogmatism,
tribalism, vigilance, and chastity, which have previously been demonstrated to correspond to
political ideology.
Understanding the dynamics of cultural sorting along lines of ideology is important, because
such sorting may well be a driving a force behind the documented increase in political
polarization, a phenomenon that if left unchecked could destabilize American society. Existing
research is clear: when like-minded people gather in insular groups, their shared views tend to
2
behavior operates in contexts that have no obvious ideological content, because such
understanding can help identify the cultural worldviews undergirding specific political beliefs.
2 LITERATURE REVIEW
In my synopsis of the most relevant existing scholarship, I begin by defining some of my
key terms. Next I identify some of the cultural realms in which scholars have identified partisan
sorting. I describe applicable research into the social traits of ideological partisans, and suggest
that what might appear to be ideological sorting in society is actually sorting along lines of social
traits. Last, I link political sorting to the related phenomenon of political polarization, and
explore its potential practical ramifications.
2.1 Ideology
The term “ideology” may have many meanings depending upon context. For my
purposes I use the word to mean an individual’s coherent set of beliefs about how the world does
and/or should operate, which act to organize that individual’s cognitive interpretation of the
situations he/she observes, and serve to inform his/her specific political opinions. This definition
borrows from Mullins’s (1972) conception of ideology as having four central components: 1. It
must have power over cognition (“cognitive power”); 2. It must be capable of guiding one’s own
evaluations (“evaluative power”); 3. It must provide guidance towards action
(“action-orientation”); and 4. It must be logically coherent (“logical coherence”). My definition is also
informed by Steger and James (2013) who characterize ideology as the “conceptual maps that
3
An individual’s political ideology is most often characterized in terms of a single
spectrum known as “left/right” or “liberal/conservative.” In this framework, liberals are
characterized by a desire for social change that addresses inequality, and an embrace of cultural
diversity. Conservatives, by contrast, are identified by a general resistance to alterations of the
status quo, and a belief that inherent differences among cultural/ethnic groups justifies societal
inequality. (See e.g. Jost 2009).
2.2 Sorting
It is important to define and distinguish two related concepts that will be discussed
throughout this paper: polarization and sorting.
As discussed by Baldassarri and Gelman (2008), in the context of ideology, polarization
refers to the dynamics within belief systems. As will be explored in more detail later in this
review, political opinions in the United States are becoming more coherent, consistent, and
oppositional on each end of the conservative-liberal ideological spectrum. Each pole of the
spectrum is also attracting a growing proportion of people who might formerly have been
somewhere in the middle. In other words, political polarization in the United States is such that,
compared to previous generations, relatively fewer people hold a mix of conservative and liberal
views and relatively more people have worldviews that are consistently liberal or consistently
conservative (“issue alignment”). The poles have also moved further apart, such that opposing
positions on individual issues are often more irreconcilable and animus between partisans at
opposite poles is increasing.
Sorting, on the other hand, is a sociological phenomenon wherein individuals whose
ideologies are already somewhat coherent are separating into like-minded groups across different
4
with explicit ideological identities, such as political parties, news outlets, and church
denominations (Baldassarri and Gelman 2008; Pew Research Center 2014; Pew Research Center
2008). I’ll discuss each in turn.
American political parties have only recently developed internally homogenous identities
as either liberal or conservative (Baldassarri and Gelman 2008; Pew Research Center 2014). For
generations, there had been a robust number of conservatives who identified as Democrats and
liberals who identified as Republicans. Now, there are relatively few such people, and the
number of people within each party whose views are either universally liberal or universally
conservative has more than doubled in the past two decades, from 10% to 21% (Baldassarri and
Gelman 2008; Pew Research Center 2014). Ideological partisans no longer face ambiguity in
identifying the major political party that corresponds to their worldview.
Americans’ ideological sorting is also stark in partisans’ choice of news outlets. Before
the dawn of 24-hour cable news networks, television news was confined to the major broadcast
networks, which were restrained by the FCC in terms of content balance and which tended to
compete with each other by seeking the broadest general appeal. This landscape has changed.
Today, cable news networks actively cater to specific ideological demographics, with Fox News
playing to conservatives, MSNBC targeting liberals, and CNN courting moderates (Shanto and
Hahn 2009). This targeting tactic is working. Conservatives avoid news stories attributed to NPR
or CNN while seeking out stories originating with Fox. Liberals show the exact opposite
tendency. In fact, 73% of consistent liberals expressed an unfavorable view of Fox News,
compared with only 5% of consistent conservatives. The numbers reversed in regards to
MSNBC, where 71% of consistent conservatives reported an unfavorable view, compared with
5
detail later), of the ten most-watched television programs among liberals, five are news shows;
their network homes are CBS, NBC, ABC, CNN, and MSNBC. Of the ten most-watched
programs among conservatives, two are news programs and both are on Fox News Channel (a
third Fox News program occupies the #11 spot on the list).
Ideological sorting has been documented in a variety of social contexts. For instance,
religious preference tends to sort along ideological lines. When liberals and conservatives go to
church, they seem to favor religions and denominations that reinforce their political worldview.
In a study sampling about 35,000 adults, conservatives outnumbered liberals in evangelical
churches by 41%, Mormon churches by 50%, and Catholic churches by 18%. Liberals
outnumbered conservatives by 19% among Muslims, 17% among Jews, and by overwhelming
margins among Buddhists, Hindus, and “other faiths” (Pew 2008). Although the Pew study did
not break down Protestant Christianity into denominations beyond simply “evangelical,”
“mainline,” and “other,” anecdotal observation suggests that there are denominations that cater
largely to liberals – such as the Episcopal church – and denominations which are made up largely
of conservatives – such as Baptist congregations.
It is fairly clear why ideological partisans identify a political party, news station, or
church that fits their worldviews, since all three realms feature explicit and prevalent ideologies
in the substance of their identities. But ideological sorting is not confined merely to such realms.
Rather, it extends to realms that have no obvious political identity, like neighborhood, choice of
college degree, and preferences for food and art (Gainsborough 2005; McKee 2007; Porter and
6
For instance, liberals and conservatives tend to live in different places from one
another. Dense cities have become demographically dominated by liberals, with outer suburbs,
small towns, and rural areas disproportionately populated by conservatives (Gainsborough 2005;
McKee 2007). These trends correspond with the stated living preferences of liberals and
conservatives. Forty six percent of consistent liberals wish to live in an urban environment, as
opposed to only 4% of consistent conservatives. The numbers are practically reversed when it
comes to an expressed desire to live in a rural area – 41% of consistent conservatives versus only
11% of consistent liberals. Seventy-five percent of consistent conservatives reported wanting to
live in an area where “houses are larger and further apart, [and] schools, stores, and restaurants
are several miles away.” Seventy-seven percent of consistent liberals felt the opposite; they
prefer an environment where “houses are smaller and closer together, [and] schools, stores, and
restaurants are within walking distance” (Pew 2014; see also Walks 2010).
The ideological divide extends to the sorts of educations people seek. For instance,
political preference (along with, importantly, social traits) is a better predictor of college major
than any other demographic factor. Liberals are more likely to pursue majors in social sciences
and humanities, with conservatives more drawn towards hard science and business-related
coursework (Porter and Umbach 2006). To the extent that college major relates to one’s eventual
career choice, it may be reasonable to assume that liberals and conservatives may occupy very
different sorts of workplaces.
Partisan sorting pervades entertainment and leisure preferences. Wilson et al. (1973)
found that liberals and conservatives are drawn toward different types of visual art, with
conservatives expressing preference for paintings that are simple and concrete, and liberals
7
a general discomfort with the unknown (essentially the social trait that I refer to herein as
“curiosity”). Testing the link between conservatism and the social traits of need for cognitive
closure and intolerance for ambiguity (the traits I refer to as “dogmatism” and “relativism”),
Wilson also determined that in terms of humor, conservatives disliked jokes that lacked
resolution or featured incongruous elements (1990). To some extent, liberals and conservative
are not even eating at the same types of chain restaurants, with liberals favoring non-American
offerings like Romano’s Macaroni Grill or P.F. Chang’s, and conservatives preferring
American-style fare like Cracker Barrel and Longhorn Steakhouse (Epstein 2014, citing Experian-Simmons
data).
2.3 Social Traits
What is behind the partisan sorting in these apparently ideology-neutral realms? The
answer might be found in underlying social traits.
The idea of “social traits” are sometimes used interchangeably with the idea of
“personality.” (See e.g. Smith & Williams 2016). Throughout this project, I use the term “social
traits” rather than “personality,” to indicate my assumption that such person-level behaviors tend
to be more influenced by context and environment than deterministic biology. The exact balance
of that “nature versus nurture” debate, however, is not substantively addressed here nor is it
directly germane to my methods or analysis. To define “social traits,” I take the description used
by Specht et al. (2014): “Individual differences in thoughts, feelings, and behaviors that are
relatively stable across situations and over time.” Individual social traits are usually analyzed as
being located on a spectrum between opposite poles. (See e.g. Kandler et al. 2014).
Although I will not endeavor to analyze the merits of such a framework in this thesis
8
environmental effects, while ideology (known as “surface characteristics” or “characteristic
adaptations”) are more malleable and subject to social forces. (Specht et al. 2014 and Kandler et
al. 2014). Arlie Hochschild (1979) has theorized that ideology serves as the mediator between a
person’s internal life and their exterior circumstances, providing a coherence and unity for the
Self by regulating feelings and interpreting environmental events.
Studies have shown that numerous social traits relate closely with political ideology. For
example: Openness to new experience vs. need for predictability (Caprera et al. 2009); deference
to authority and/or tradition (Jost et al. 2008); tolerance for ambiguity (Rock and Janoff-Bulman
2010); desire for cognitive closure (Rock and Janoff-Bulman 2010); and preference for ingroup
vs. tolerance for outgroups (Dambrum et al. 2003); are all associated with political ideology. The
most important such predictor of ideology may be “negativity bias” – the tendency to notice
and/or fixate on situations that are perceived to be unpleasant or threatening (Hibbing et al. 2014). Such traits might also relate to the ways in which we can observe liberal and
conservatives polarizing in their daily environments. Comparatively little scholarship exists
which attempts to accord the social differences of those on the political poles with the myriad
ways in which they are demonstrably sorting.
2.4 Polarization
With partisans sorting into pervasive and non-overlapping bubbles of experience, those
bubbles serve as echo chambers for a partisans’ political opinions. These echo chambers ensure
that partisans are less and less likely to encounter viewpoints that contrast with their own. In
such homogenous realms, opinions among a group become even more similar, and more
extreme. This is known as “group polarization,” a phenomenon that has been analyzed in
9
Partisans may not realize they chose their surroundings and consumption unconsciously
based on social traits rather than on political ideology. Indeed, they are probably not aware that
they are “sorting” at all! Nevertheless, research shows that those who are already inclined toward
a particular pole along the ideological/social spectrum are likely to become more firmly and
more radically entrenched as the dynamics of group polarization take hold.
Social stability depends on the assumption that, while there is widespread disagreement
among the population on a variety of issues, there is substantial overlapping agreement as well
(Baldassarri and Gelman 2008). Stability is therefore imperiled when the opinions of the
populace are crystalized into two coherent and directly conflicting ideologies. When
conservatives and liberals unconsciously sort themselves into non-overlapping physical,
intellectual, and spiritual realms, and those realms serve to further polarize existing ideological
differences, then the very stability of the country’s identity and government may be at stake.
Recent research illustrates the extent to which these echo-chambers and ideological
feedback loops may be leading to further polarization. In the past twenty years, the number of
Americans who held a roughly equal number of liberal and conservative views and who were
unaffiliated with a political party has shrunk from 49% to 39% (Pew 2014). The degree of
overlapping opinions among Republicans and Democrats is also dwindling. The number of
people within each of the two major political parties whose views are either universally liberal or
universally conservative has more than doubled in the past two decades, from 10% to 21%
(Baldassarri and Gelman 2008, and Pew 2014).
The ramifications of this polarization are not trivial. Animosity between the parties is
10
view of people in the opposing party; today those numbers are 38% and 43%, respectively.
Among consistent conservatives, 73% report a “very unfavorable” opinion of liberals, with 53%
of consistent liberals reporting the same feeling for conservatives. Fifty percent of consistent
liberals and two-thirds of across-the-board conservatives go so far as to say that the other side is
a threat to the nation. Although a majority of Americans do not hold universally liberal or
conservative views, the political process is increasingly dominated by those who do. Thirty-eight
percent of Democrats who identify themselves as politically active hold universally liberal views
on major issues, compared with only 8% twenty years ago. Thirty-three percent of politically
active Republicans show universal issue alignment, up from 10% in 2004 (Pew 2014).
Although this project involves subject matters traditionally associated with the fields of
psychology and political science, my ultimate interest is in the ramifications of those subjects on
a sociological scale. Indeed, issues of stratification and sorting, and the effects such processes
impose upon individuals, are among the most foundational themes of the sociology discipline.
The logical first step to addressing this rapid polarization is to identify the mechanisms that are
contributing to the sorting that is behind it. To explore the dynamic, I will analyze certain
partisan television programs for content that corresponds to social traits that are known to predict
ideology.
2.5 Television
Having established the purpose behind this project, one might well wonder, “But why
television?” Fictional television programs are well suited for a comparison between social traits
and political partisan sorting. Because they consist of relatively lengthy narratives, they lend
11
of them are available on the common basic cable package. And what, ultimately, is an ideology
but a constructed story about the way the world operates?
Further, television viewing dominates the modern American leisure landscape. Robinson
& Godbey (2008) call television “the 800-pound gorilla of leisure time.” Putnam (2000) has
reported that the average American household watches a collective 7+ hours of television per
day, noting: “Watching TV … has become one of the few universals of contemporary American
life.” Social critic James Howard Kunstler (1993) opines:
[T]elevision is the family’s chief connection with the outside world. The physical envelope of the house itself no longer connects their lives to the outside in any active way; rather, it seals them off from it. The outside world has become an abstraction filtered through television, just as the weather is an abstraction filtered through air conditioning.
In terms of cultural impact and sheer time use, television is therefore an ideal proxy for
the broader phenomenon of ideology-based cultural sorting.
3 METHODOLOGY
Based on the social factors identified by existing research, I have conducted a
quantitative content analysis of certain television programs which have audiences that are
disproportionately liberal or conservative. I measured the following attributes: presence of
protagonists and antagonists with clear moral polarity; narrative closure within episodes;
predictable/conventional style and story structure; diversity of cast members in positive roles;
stories centered around physical danger or crime; and explicit elements of sex/vulgarity. I
predicted that programs favored by liberals would tend to feature more diverse casts, less
12
its major characters. In contrast, I expected that the programs favored by conservatives would
tend to feature storylines involving physical violence or crime with clearly delineated “good
guys” and “bad guys,” and conventional or consistent structures with story arcs neatly contained
within each episode.
I will discuss three elements of my study design: the selection of the shows; the rubric by
which they are analyzed; and the identities of the reviewers.
3.1 The Shows
My selection of programs was informed by private data from the National
Consumer Survey (“NCS”) provided to me by The Experian-Simmons Company – a large
data-collection-and-analysis corporation perhaps best known as being one of the major credit
reporting agencies in the United States. The annual NCS is a representative sample of
approximately 25,000 Americans in which respondents complete a lengthy written questionnaire
booklet exploring each respondent’s demographic attributes as well as his or her habits and
opinions on a number of products and services. Relevant to my project, the NCS asks
respondents to self-identify their place along a political spectrum ranging from “Liberal
Democrat” to “Conservative Republican.” It also asks respondents to select each television
program that they recently watched, from an exhaustive list of network, basic-cable, and
pay-cable shows. Experian made available to me a spreadsheet which, for each television program,
identified the following: (1) How many respondents in each ideological category report watching
that program; (2) The percentage of that ideological category’s respondents who watch that
13
percentage of that program’s viewing audience within the sample which is comprised of people
in that ideological category (e.g. The audience for Community in the sample is 40.2% Liberal
Democrats); and (4) The probability that a given viewer of that program will be of one certain
ideological category compared to the sample as a whole (e.g. A Liberal Democrat in the sample
is 361% as likely to watch Community as the sample as a whole).
While this data allowed me to determine which television programs are most often
watched by people of what ideological persuasion, my next step was to choose what kinds of
programs to use for my research question. Since I am interested in determining whether a
partisan’s preference for certain kinds of narratives is related to the social structure associated
with such a partisan’s ideology, I confined the programs I analyzed to those of a fictional
narrative quality – this excluded programs like news, sports, variety, documentary, and reality.
Because I am interested in traits of recurring characters, and also storylines that extend beyond a
single episode (as explained later), I required programs that have continuity of character and
story. This excluded “anthology” programs like “Black Mirror,” and sketch-based shows like
“Saturday Night Live” or “Portlandia.” In the interest of uniformity, I also excluded animated
programs. So my sample of relevant shows was pulled from American live-action fictional
programs with continuity of character and setting.
The NCS data revealed that, generally, Liberal Democrats prefer comedies while
Conservative Republicans prefer dramas. Since comedies and dramas can have very different
narrative “rules” from each other, in an effort to make a more accurate apples-to-apples
comparison between the programs favored by viewers within each ideology, my sample of
14
My next question, then, was how many programs should constitute my sample, and how
many episodes of each. Existing content analysis of television programs has been inconsistent in
the size of sampling frames, but a general range emerges. In an analysis of sexual content on
television, Collins et al. (2004) analyzed between two and thirteen episodes of twenty-three
different programs. In a study analyzing gender portrayals within health-related storylines on
television, Hether & Murphy (2010) examined the nineteen most popular narrative programs and
looked at a total of 392 episodes of those programs. In analyzing representations of police
misconduct in fictional television, Dirikx et al. (2012) examined twenty episodes from each of
four law enforcement procedural programs. Analyzing portrayals of police violence in
reality-based law enforcement shows, Oliver (1994) examined a total of seventy-six episodes from five
such programs. Tallying the genders of major characters on network television, Glascock (2001)
viewed one episode from each of the ninety-four narrative fiction shows then on the air. Bond
(2015) took two randomly-selected episodes each from twelve programs when analyzing gay and
lesbian characters on television. Three episodes apiece from the twenty-seven most-watched
religious programs were analyzed by Abelman & Neuendorf (1987) in a study of themes used by
televangelists. Manganello et al. (2008) concluded that, prior to their study, there was “no ‘gold
standard’ or tested set of practices that has been established to guide researchers” on the question
of how many programs/episodes to select for an adequate content analysis. However, in testing
various sample sizes against each other in estimating the number of sexual encounters per
season, the researchers found that “randomly selecting just three episodes will provide a
reasonable assessment of a series’ content if researchers do not expect wide variation.” In
selecting which specific episodes to use, the researchers’ data led them to recommend excluding
15
gimmicky and therefore unrepresentative of the season as a whole. Following the advice of
Manganello et al. and the example of the other referenced studies, my sample of programs
consisted of three random episodes (excluding the first and last episode of a season) from a total
of sixteen shows, organized in the following categories:
1. Top Liberal Comedies (4 programs)
2. Top Liberal Dramas (4 programs)
3. Top Conservative Comedies (4 programs)
4. Top Conservative Dramas (4 programs)
With three episodes from each program, this was a total of forty-eight individual
episodes.
My next issue was in defining what constitutes the “top” four programs within each
category. I wanted to analyze the content of programs that tend to disproportionately attract
audiences of one ideological pole or the other, to the exclusion of those on the opposite end of
the spectrum. In other words, I looked for shows that have audiences that are heavily skewed
toward either liberals or conservatives. The NCS data identified the ideological “Index” value for
each program it tracks, which is the likelihood that a particular partisan will watch a given
program in comparison to the sample as a whole. For example, for Liberal Democrats and the
HBO program The Newsroom, the Index value is 190, meaning that Liberal Democrats in the
sample are 190% more likely than the sample as a whole to watch the show. But in determining
which programs have audiences that skew liberal or conservative, it was insufficient to merely
look at the Index value because there were a few puzzling instances where audiences on both
ends of the ideological spectrum were more likely to watch a given program than were viewers
in the middle of the spectrum. The Fox comedy New Girl, for example, had an Index value of
16
determine which programs had an audience that skewed to one end of the ideological spectrum
and only one end of the spectrum, I subtracted the Liberal Democrat Index value from the Conservative Republican, to arrive at what I call an “Index Differential” value. The Index
Differential identifies which programs have an audience with a one-directional ideological skew.
Index Differentials less than zero indicate a liberal audience, and positive values indicate a
conservative audience. The further a value is from zero, the stronger the partisan makeup of its
audience.
With that in mind, I then used Index Differential to identify the specific programs to
populate the categories I listed above. They are as follows, with corresponding Index
Differentials in parentheses.:1
A. Top Liberal Comedies
1. Community (-301)
2. Shameless (-107)
3. Glee (-84)
4. Modern Family (-73)
B. Top Liberal Dramas
1. The Newsroom (-134)
2. Scandal (-109)
3. The Borgias (-66)
4. Homeland (-65)
C. Top Conservative Comedies
1. Rules of Engagement (+65)
2. Last Man Standing (+47)
3. Mike & Molly (+22)
4. The Goldbergs (+14)
D. Top Conservative Dramas
1. Being Human (+61)
2. Longmire (+60)
3. Revolution (+42)
4. Bates Motel (+40)
1 Note that the “Top Liberal” programs have Index Differentials that are much higher in absolute value than those
17
One series, the comedy The Neighbors, made the initial list of programs with an Index
Differential of -90, but had to be replaced because at the time of this project it was not available
via DVD or any streaming video service and therefore could not be easily evaluated. It was
replaced with the next highest Index Differential among liberal comedies, Glee. A complete list
of the specific episodes, along with narrative descriptions for each from the Internet Movie
Database, is included in the Appendix.
With the sample frame of programs being therefore established, I can now move on to
discuss how those programs were analyzed.
3.2 Scoring Rubric
As discussed in the literature review, there are a number of social traits that have
been demonstrated to vary based on one’s political ideology. Different researchers have used
different conceptualizations and terms for such traits, such that a cursory review of the literature
initially indicates a plethora of diverse measures. However, after more careful study and
comparison, I concluded that the most compelling of the various measures may be fairly
combined and sorted into six separate (though still somewhat overlapping) traits. I classified
them as follows, each trait being a spectrum with its poles in parentheses, the liberal pole listed
first:
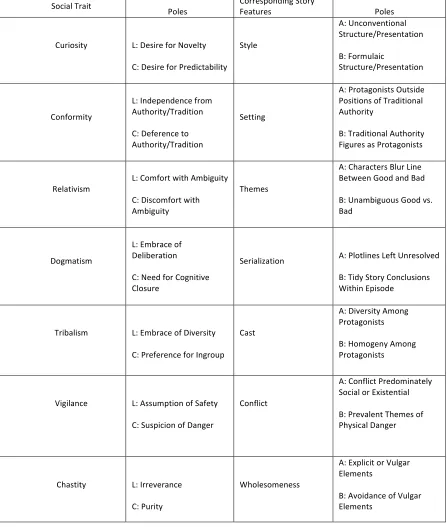
1. Curiosity (Desire for novelty vs. Desire for predictability);
2. Conformity (Independence from tradition/authority vs. Deference to authority/tradition);
3. Relativism (Comfort with ambiguity vs. Discomfort with ambiguity); 4. Dogmatism (Embrace of deliberation vs. Need for cognitive closure); 5. Tribalism (Embrace of diversity vs. Preference for ingroup);
18
I hypothesized that the substance of the “Top Liberal” and “Top Conservative” programs
would correspond with the social traits associated with each partisan group. My next task, then,
was to translate each trait into a “Story Feature” with poles that might logically be expected to
correspond to the poles of the Social Traits. I made such translations as follows (with each Story
Feature and its poles corresponding to the list of Social Traits above):
1. Style (Unconventional structure/presentation vs. Formulaic structure/presentation);
2. Setting (Protagonists outside positions of traditional authority vs. Traditional authority figures as protagonists);
3. Themes (Characters blur line between good and bad vs. Unambiguous good and bad);
4. Serialization (Major plotlines extend beyond individual episodes vs. Tidy story conclusions within individual episodes);
5. Cast (Diversity among protagonists vs. Homogeny among protagonists);
6. Conflict (Conflict predominately social or existential vs. Prevalent themes of physical danger); and
7. Wholesomeness (Explicit vulgarity vs. Avoidance of explicit elements).
19
Table 1: Social Traits and Corresponding Story Features
Social Trait Poles Corresponding Story Features Poles
Curiosity
L: Desire for Novelty
C: Desire for Predictability Style
A: Unconventional Structure/Presentation
B: Formulaic
Structure/Presentation
Conformity
L: Independence from Authority/Tradition
C: Deference to Authority/Tradition
Setting
A: Protagonists Outside Positions of Traditional Authority
B: Traditional Authority Figures as Protagonists
Relativism
L: Comfort with Ambiguity
C: Discomfort with Ambiguity
Themes
A: Characters Blur Line Between Good and Bad
B: Unambiguous Good vs. Bad
Dogmatism
L: Embrace of Deliberation
C: Need for Cognitive Closure
Serialization A: Plotlines Left Unresolved
B: Tidy Story Conclusions Within Episode
Tribalism L: Embrace of Diversity
C: Preference for Ingroup Cast
A: Diversity Among Protagonists
B: Homogeny Among Protagonists
Vigilance
L: Assumption of Safety
C: Suspicion of Danger
Conflict
A: Conflict Predominately Social or Existential
B: Prevalent Themes of Physical Danger
Chastity L: Irreverance C: Purity
Wholesomeness
A: Explicit or Vulgar Elements
B: Avoidance of Vulgar Elements
[image:28.612.19.466.141.668.2]20
Reviewers were assigned three episodes of each program, and, for each episode, scored
each Story Feature on a scale. There was a question of how many points should be used on this
scale. There is little consistency among published quantitative content analyses in the size of
reviewers’ scales; common options include a simple binary and a ten-point spectrum. (See
generally Neuendorf & Kane 2010). A number of scholars have visited the issue of the optimal
number of points on a survey/questionnaire scale (See e.g. Cox 1980; Dawes 2008; Lee & Paek
2014). Consensus among the scholarship seems to be that a scale’s validity increases with each
additional point, until the increase in validity begins to quickly flatten at around 7 points. It is
important to note that, in content analysis, inter-rater reliability can become more difficult as a
scale increases in size (Cox 1980). Perhaps the most common of the survey scales, the Likert
Scale, commonly has 5 points, with a neutral midpoint. I adopted a similar scale here. To
correspond to the dichotomous poles of political ideology and match the negative/positive Index
Differentials associated with the television programs, my five points ran from -2 to +2, with
values corresponding to the following evaluation (with poles identified as “A” and “B” rather
than “L” and “C,” so as to disguise from the Reviewers any cue towards the ideological
associations of the Story Features, as will be discussed later):
Value Evaluation
-‐2 Strongly Tends Towards Pole A -‐1 Somewhat Tends Toward Pole A
0 Tends Toward Neither Pole A nor B 1 Somewhat Tends Toward Pole B 2 Strongly Tends Toward Pole B
To guide the Reviewers, I provided each with a scoresheet that briefly elaborated on the
Story Features they were to evaluate. The scoresheet provided specific questions to look for in
21 Reviewer:
Program (Series) Title:
Episode Name and/or Number:
Circle the appropriate number for each element. STYLE
A. Unconventional Structure/Presentation B. Conventional Structure/Presentation
-2 -1 0 +1 +2
SETTING
A. Protagonists In Positions of B. Outcast/Marginalized Conventional Authority Protagonists
-2 -1 0 +1 +2
THEMES
A. Characters Blur the Line B. Unambiguous Morality
Between Good and Bad
-2 -1 0 +1 +2
SERIALIZATION
A. Plotlines Left Unresolved for Later B. Tidy Story Conclusions
-2 -1 0 +1 +2
CAST
A. Diverse Protagonists B. Protags. Not Diverse
-2 -1 0 +1 +2
CONFLICT
A. Prevalent Themes of Physical Danger B. Risks are Non-Physical
-2 -1 0 +1 +2
WHOLESOMENESS
A. Explicit or Vulgar Elements B. “Family Friendly”
22
In addition to scoresheets, the Reviewers were also given a Guidebook (included in the
Appendix) that detailed their evaluation process and elaborated on the Story Features that they
would be analyzing.
3.3 The Reviewers
I chose six total reviewers for the project, each of whom was randomly assigned
eight episodes from the sample. General theory on the methods of content analysis holds that
virtually anyone is competent to be a reviewer, as long as reliability is established among them
(Neuendorf 2010). However, when appropriate, some studies have used reviewers with certain
expertise or familiarity with the content being analyzed. For example, in using an fMRI machine
to study the brain patterns of people observing images of products with varying degrees of
“cool,” Quartz & Asp (2015) opted to recruit design students as subjects because they were
expected to have a heightened sense of style. In another example, Bond (2015) employed the use
of reviewers who identified as gay, lesbian, or bisexual when analyzing media for LGB content,
reasoning: “Because terminology exists among LGB individuals that is specific to those
identifying as LGB, having coders involved with the project who identified as LGB increased the
likelihood that coders would be able to decipher the context of LGB talk.” Similarly, my project
presented reviewers with certain concepts (e.g. “conventional” story structure) and terminology
(e.g. “protagonist” and “antagonist”) that may be unfamiliar to people outside of media studies
and production. So rather than employ students or social scientists, I chose professional film/
23
and are employed by a variety of prestigious publications.2 As I have spent many years involved
in independent film projects, the reviewers were selected from my own social network. (I
therefore cannot make claims about the generalizability of these particular reviewers to all
reviewers – but fortunately, that is not the goal of this scholarship.).
It is a common practice to help ensure objectivity from reviewers by withholding
from them the true nature of a project’s research question (Neuendorf 2010). To increase the
likelihood that the programs would be evaluated without bias, I did not disclose the thesis and
hypothesis to the reviewers until after evaluations were complete. In other words, the reviewers
did not know that they were evaluating the programs for traits that I deemed “conservative” or
“liberal,” or that the shows they were evaluating have been selected because they are favorites of
one or another ideological group.
Before the reviewers began analyzing their subsample of shows, I needed to
establish their inter-rater reliability. Typically this is done by having all reviewers code an
identical subsample of the programs that are to be watched for the actual project, but not any
specific episodes that are part of the experimental sample (Neuendorf 2010). This initial
subsample (which I call the “IRR Subsample”) is generally about 10% of the duration of the
experimental sample as a whole (Id.). For ordinal-level variables, as I used here, reliability is measured by covariance, of which there are a number of methods that are debated in the
literature (Id.). My IRR Subsample (identified in the Appendix) consisted of one episode apiece
of two comedy programs and two drama programs, for a total duration of approximately four
hours (approximately 11% of the experimental sample’s duration). Agreement among the
Reviewers for that IRR Subsample was measured by Cronbach’s Alpha, for which scores above
2 As of this writing, the “home outlets” for the reviewers were: Thrillist; Screen Junkies; The Arkansas
24
.6 are generally considered good, and scores above .8 are considered excellent. (Hallgren 2012).
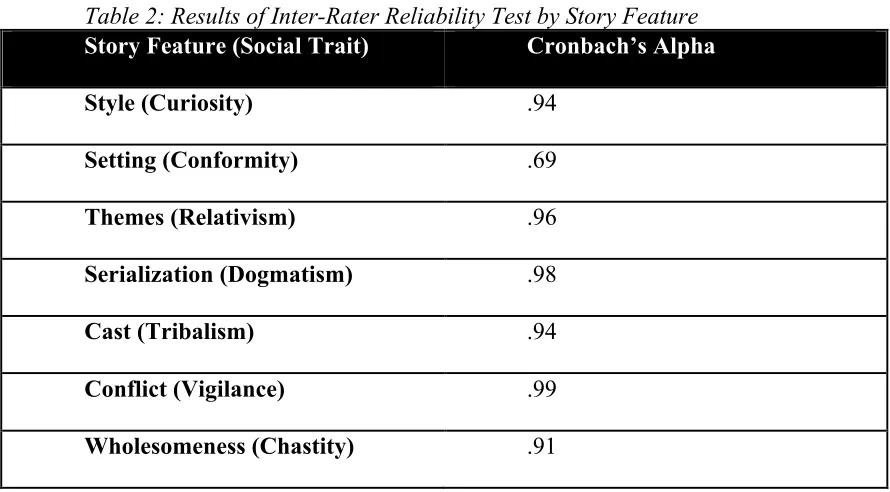
[image:33.612.66.511.127.373.2]Results are detailed in Table 2 below.
Table 2: Results of Inter-Rater Reliability Test by Story Feature
Story Feature (Social Trait) Cronbach’s Alpha
Style (Curiosity) .94
Setting (Conformity) .69
Themes (Relativism) .96
Serialization (Dogmatism) .98
Cast (Tribalism) .94
Conflict (Vigilance) .99
Wholesomeness (Chastity) .91
As Table 2 indicates, agreement was very high among the six reviewers, and I
was therefore able to confidently assign the reviewers non-overlapping sub-samples for their
analysis.
As discussed previously, each reviewer evaluated each of their assigned episodes
along the seven Story Features, according to the scoresheet reproduced above. The scores for
each such Feature were averaged among the three episodes for each show, and those scores were
in turn averaged to give each show a “Composite Rating.” Scores for both the individual Story
Features and the Composite Rating had a scale from -2 (“liberal” values) to +2 (“conservative”
values).3
3 Although the scores were initially randomized to either pole, they were rescaled such that all “liberal” values
25
I hypothesized that programs with liberal-skewing audiences would score
negative (“liberal”) values on each of the 7 Story Features, as well as the Composite Rating. I
hypothesized that programs with conservative-skewing audiences, by contrast, would score
positive (“conservative”) values on those same measures.
4 FINDINGS
My index of Story Features serves as a good indicator of the audience ideology of the
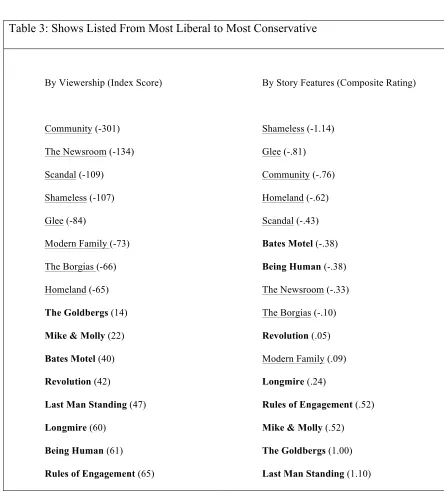
shows in my sample. The Composite Rating correctly predicted the viewership of seven of eight
“liberal” shows (87.5%), and six out of eight “conservative” shows (75%) (81.3% total). The
mean Reviewer Rating for the eight “liberal” shows was -.51, and the mean Reviewer Rating for
the eight “conservative” shows was .33, for a mean difference of .85. A t-test of means reveals
that difference to be significant at the .004 level, meaning that in only 4 times out of 1,000 would
26
Table 3: Shows Listed From Most Liberal to Most Conservative
By Viewership (Index Score) By Story Features (Composite Rating)
Community (-301) Shameless (-1.14)
The Newsroom (-134) Glee (-.81)
Scandal (-109) Community (-.76)
Shameless (-107) Homeland (-.62)
Glee (-84)
Scandal (-.43) Modern Family (-73) Bates Motel (-.38)
The Borgias (-66) Being Human (-.38)
Homeland (-65) The Newsroom (-.33)
The Goldbergs (14) The Borgias (-.10)
Mike & Molly (22) Revolution (.05)
Bates Motel (40) Modern Family (.09)
Revolution (42) Longmire (.24)
Last Man Standing (47) Rules of Engagement (.52)
Longmire (60) Mike & Molly (.52)
Being Human (61) The Goldbergs (1.00)
Rules of Engagement (65) Last Man Standing (1.10)
Underlined titles are those with a net liberal audience. Bolded titles have a net conservative audience.
In addition to relating to whether a given show has an overall liberal or conservative
audience, the Composite Ratings also relate to the degree to which those audiences are liberal or
conservative. In other words, the Composite Ratings from my reviewers have high correlations
27
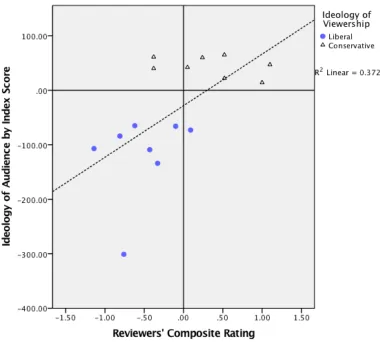
Figure 1: Scatterplot of Shows by Index Differential and Composite Rating
In Figure 1 above, the regression line indicates a general trend: As my Composite
Ratings move further negative, the corresponding shows have an increasingly liberal audience.
As the Composite Ratings increase further above zero, the corresponding shows have audiences
that are more conservative. The regression line barely misses the dead-center intersection of the
zero-value axes; this indicates that the Composite Ratings were slightly biased towards
predicting liberal audiences.
So the Composite Ratings are significantly associated with the ideological tilt of
28
Table 4 below illustrates. However, six of the seven Story Features show the trend that I
[image:37.612.67.547.131.575.2]expected, with five of those seven trends being statistically significant.
Table 4: Mean Ratings for Individual Story Traits Across Audience Ideology
“Liberal” Shows
“Conservative” Shows
Difference
Composite -.51
(.40)
.33 (.56)
.85 **
Style/Curiosity -.46
(1.02)
1.13 (1.23)
1.58 **
Setting/ Conformity .21 (1.32)
.50 (1.25)
.29
Themes/ Relativism -.79 (1.19)
.17 (1.34)
.96 *
Serialization/ Dogmatism -1.04 (1.33)
.25 (1.82)
1.29 **
Cast/ Tribalism -.96
(1.30)
.63 (1.17)
1.58 **
Conflict/ Vigilance .08 (1.78)
-.46 (1.74)
.54
Wholesomeness/ Chastity -.63 (1.41)
.12 (1.12)
.75 *
N = 24 N= 24
** = p < .01, * = p < .05 using two-tailed t-test of means. Parentheticals indicate standard deviations.
So indeed, the data shows that when it comes to style, liberals prefer novelty while
conservatives prefer familiarity and predictability. Liberals are, in fact, drawn to shows with
29
programs that have tidy endings, whereas liberals like more open-ended storytelling. In general
liberals prefer diverse casts, while conservatives are attracted to more homogenous ones. And
indeed, statistically conservatives keep their distance from programs with explicit content, while
liberals do the opposite.
Although my measure for Setting/Conformity exhibits the general trend that I
hypothesized, small sample size and large standard deviations may have prevented it from
achieving statistical significance among the other Story Traits. The surprise of the group, though,
is the measure for Conflict/Vigilance; contrary to my expectations, among the shows in my
sample, the ones with liberal audiences were actually more violent than the ones favored by
conservatives. Future research might explore the dynamics behind this finding.
When confining the analysis to the five story traits that have a statistically
significant effect (i.e. dropping “Setting/Conformity” and “Conflict/Vigilance”), the new score
(“Adjusted Composite Rating”) relates even more strongly to the programs’ audience ideology.
30
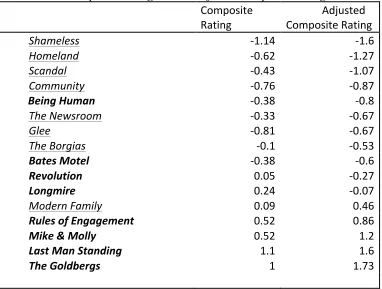
Table 5: Composite Ratings versus Adjusted Composite Ratings
Composite Rating Composite Rating Adjusted
Shameless -‐1.14 -‐1.6
Homeland -‐0.62 -‐1.27
Scandal -‐0.43 -‐1.07
Community -‐0.76 -‐0.87
Being Human -‐0.38 -‐0.8
The Newsroom -‐0.33 -‐0.67
Glee -‐0.81 -‐0.67
The Borgias -‐0.1 -‐0.53
Bates Motel -‐0.38 -‐0.6
Revolution 0.05 -‐0.27
Longmire 0.24 -‐0.07
Modern Family 0.09 0.46
Rules of Engagement 0.52 0.86
Mike & Molly 0.52 1.2
Last Man Standing 1.1 1.6
The Goldbergs 1 1.73
Underlined titled are those with a net liberal audience. Bolded titles have a net conservative audience.
When analyzed according to the Adjusted Composite Rating, 13 of the 16 programs
moved even further in the direction indicated by the initial Composite Rating. That is to say,
generally the “liberal” shows were scored as even more liberal, and the “conservative” shows
were scored as even more conservative. This is true in the aggregate as well.
Table 6: Composite Ratings versus Adjusted Composite Ratings (Aggregate)
Mean Composite Rating Mean Adjusted Composite
Rating
Liberal Shows -.51 -.78
Conservative Shows .33 .46
Mean Difference .85** 1.23**
[image:39.612.64.514.543.673.2]31
As Table 6 illustrates, when Setting/Conformity and Conflict/Vigilance are removed
from the composite measure, the difference between the content of the “liberal” and
“conservative” programs is even more evident.
5 DISCUSSION
Overall, my Composite Ratings (and to a greater degree my Adjusted Composite Ratings)
do vary by whether a given show’s audience will skew liberal or conservative. In all but three of
a possible sixteen shows, a negative Composite Rating corresponded with a “liberal” favorite,
and a positive Rating corresponded with a “conservative” favorite. Of the “misses,” my Ratings
predicted that two shows – Being Human and Bates Motel – would have slightly liberal
audiences when in fact their audiences are conservative. The other “miss,” Modern Family, has a
predominately liberal audience, but my Composite Rating characterized it as very slightly
conservative.
Modern Family might be an example of a show being so polarized on one particular Story Trait that it widely turns off an audience that might otherwise enjoy the remaining
elements. Specifically, Modern Family is an ensemble comedy centering around very diverse
family dynamics, prominently including a same-sex couple. It is possible that the very premise of
the show is “liberal” enough to discourage a conservative audience, even though my Ratings
score the show as being very wholesome, self-contained, and unambiguous – aspects that
typically attract conservatives. Additionally, unlike the three comedies most popular with
conservative audiences in my sample (Rules of Engagement, Last Man Standing, and Mike &
Molly), Modern Family does not have a “laugh track.”4 Laugh tracks can be used to help
audiences deal with ambiguity by “cuing” them as to what is supposed to be interpreted as
4 Shows with a “laugh track” have their jokes accompanied by recorded laughter, either from a live audience at the
32
comical. (Messerli 2016; Bore 2011). This cuing mechanism may be very important in making
television comedies attractive to conservative audiences.5
According to my Composite Ratings, the show in my sample that ought to be the most
appealing to liberals (or unappealing to conservatives) is Shameless. Shameless airs on pay cable
network Showtime. There is an apparent pattern to this: Half of the “liberal” shows in the sample
air on pay cable (Showtime or HBO), while none of the “conservative” shows do. The meaning
of this pattern is unclear to me. Shameless is also noteworthy for this study in that it is very difficult to classify on the comedy/drama spectrum. Because it is frequently funny and vulgar, I
classified it as a comedy. But it is just as often bleak and tragic, following a poverty-stricken,
substance-abusing family struggling with myriad and serious issues. The fact that Shameless has
ambiguity that permeates even its fundamental classification of comedy-versus-drama surely
contributes to its liberal-heavy audience.
The show with the most conservative Composite Rating in my sample is Last Man
Standing. A brief perusal of the titles of the specific episodes my reviewers analyzed (listed in the Appendix) leaves little doubt as to why the show is so polarizing. Of the plots of the three
episodes, one is a defense of spanking children, one is about a teenager doing whatever she can
to be admitted to a military academy, and one lampoons the scenario of an elementary school
renaming itself merely because its historical namesake is revealed to have owned slaves. The
5 It has been argued that the very concept of humor depends on some degree of both ambiguity and surprise. (See
e.g. Deckers & Kizer 1975). Others have argued that humor depends on a concept called “benign violation” – essentially, a joke providing a pleasant sensation by violating, in a non-threatening manner, some norm within the listener. (Warren & McGraw 2016). These elements – ambiguity; surprise; norm violation; muted response to threat stimuli – are of course traits negatively correlated with ideological conservatism.
33
entire premise of the series is a traditionally masculine father living in a household with all
females, and struggling to adapt to a modern world that increasingly challenges his hegemonic
manliness. The anxiety that the father (Tim Allen in a typecast role) feels is surely quite familiar
to the conservative men watching each episode.
6 CONCLUSION
I have argued that the content of certain television shows with ideologically polarized
audiences is related to certain social traits, namely: curiosity; conformity; relativism; dogmatism;
tribalism; vigilance; and chastity. To explore this idea, I created a scale to measure those traits
(which I call “Story Features”) within the narratives of the TV programs. A panel of professional
television critics employed my scale in a content analysis of a sample of ideologically polarizing
programs. I hypothesized that the programs with liberal-skewing audiences would score towards
the liberal end of the scale for each Story Feature, and programs with conservative-skewing
audiences would have Story Features that scored towards the conservative end. For 5 of the 7
Story Features, my hypothesis was confirmed. I also hypothesized that an overall Composite
Rating of all 7 combined Story Features would correspond to the ideological tilt of each
program’s audience. For 14 of the 16 programs in my sample, this hypothesis was confirmed.
Because a person’s general worldview and/or set of social traits probably predates
their exposure to any of these television shows, my results seem to indicate that political
partisans are drawn to cultural environments that reflect their general ideology about the world.
To the extent that a typical conservative views the world as a dangerous place where one must
venture with extreme vigilance into situations of novelty and ambiguity, while being guided by
traditional wisdom, it makes sense that such a conservative would find pleasure or comfort in
34
opportunities in the novel and unknown, and believes that security and prosperity come from
cooperation among diverse peoples, it is unsurprising that such a philosophy would be found in
the stories they find most appealing.
While this sorting is therefore understandable and predictable, it is not without
danger. When groups form based on pre-existing ideological inclinations, the dynamics of
“group polarization” dictate that those inclinations become more homogenous, deeply-held, and
radical. Although it is beyond the ability of my data to prove, I suspect that cultural sorting in
apolitical realms like narrative television contributes substantially to group polarization and, in
turn, deeper fractures in social solidarity.
The results of this study may be important to our understanding of what motivates
liberals and conservatives in their self-sorting behavior across different realms of culture. While
ideological sorting may be easy to explain in cultural domains with explicit moral perspectives –
political parties and church denominations, for example – the phenomenon is more difficult to
understand in realms like narrative television in which there is no obvious such slant. The results
of this study lead me to suspect that apolitical sorting along ideological lines – not only in media
selection but also in neighborhood, choice of vocation, and more – is not a product of conscious,
ideology-based choice, but rather of underlying social traits that happen to also sort us into
opposing political camps. Future research may explore those additional cultural realms and
determine whether the same sorts of dynamics are at play. To the extent that the findings from
this study are reproduced in other cultural realms, we may have an improved ability to predict
the future trajectory of partisan sorting and, should it become desirable, design interventions to
36 REFERENCES
Abelman, Robert and Kimberly Neuendorf, 1987. “Themes and Topics in Religious Television
Programming.” Review of Religious Research 29(2):152-174.
Abramowitz, Alan and Kyle Saunders. 2005. “Why Can’t We All Just Get Along? The Reality of
Polarized America.” The Forum, 3(2).
Baldassarri, Delia and Andrew Gelman. 2008. “Partisans Without Constraint: Political
Polarization and Trends in American Public Opinion.” American Journal of Sociology 114(2):
408—446.
Bishop, Bill 2009. The Big Sort: Why the Clustering of Like-Minded America is Tearing Us
Apart.” Mariner Books.
Bond, Bradley, 2015. “Portrayals of Sex and Sexuality in Gay- and Lesbian-Oriented Media: A
Quantitative Content Analysis.” Sexuality & Culture 19(1):37-56.
Bore, Inger-Lise Kalvinkes, 2011. “Laughing Together? TV Comedy Audiences and the Laugh
Track.” Velvet Light Trap: A Critical Journal of Film & Television 68:24-34.
Caprera, G.V., C. Barbaranelli, and P.G. Zimbardo 2009. “Personality Profiles and Political
Parties.” Political Psychology 20(1): 175-97.
Collins, R., Elliott, M., Berry, S., Kanouse, D., Kunkel, D., Hunter, S. B., & Miu, A. (2004).
“Watching sex on television predicts adolescent initiation of sexual behavior.” Pediatrics, 114,
280–289.
Cox, E. P. III, 1980. “The Optimal Number of Response Alternatives for a Scale: A Review.”
Journal Of Marketing Research 17(4):407-422.
Dambrum, M., G. Despres G., and S. Guimond 2003. “On the Multifacted Nature of Prejudice:
Psychophysiological Responses to Ingroup and Outgroup Ethnic Stimuli.” Current Research in
Social Psychology 8: 187-206.
Dawes, John, 2008. “Do data characteristics change according to the number of scale points
used?” International Journal of Market Research, 1:61-77.
Deckers, Lambert and Philip Kizer, 1975. “Humor and the Incongruity Hypothesis. The Journal
of Psychology: Interdisciplinary and Applied 90:215–218.
Dirikx, Astrid, Van den Bulck, Jan, and Parmentier, Stephan, 2012. “The Police as Societal
Moral Agents: ‘Procedural Justice’ and the Analysis of Police Fiction.” Journal of Broadcasting