Survival and Sodium Hypochlorite Disinfection of Potential Ebola Virus
Surrogates MS2, PhiX-174, and Phi6 in a Conservative Matrix of Raw
Hospital Sewage and Human Fecal Waste
Joseph Hale Strasser
A technical report submitted to the faculty of the University of North Carolina at Chapel Hill in partial fulfillment of the requirements for the degree of Master of Science in Public Health in the Environmental Sciences and Engineering Department at Gillings School of Global Public Health
Chapel Hill
2017
Approved by:
Mark D. Sobsey, PhD
Jill R. Stewart, PhD
ABSTRACT
Joseph Hale Strasser: Survival and Sodium Hypochlorite Disinfection of Potential Ebola Virus Surrogates MS2, PhiX-174, and Phi6 in a Conservative Matrix of Raw Hospital Sewage and
Human Fecal Waste
(Under the direction of Dr. Mark Sobsey)
Between March 2014 and January 2016, West Africa experienced the largest Ebola virus disease (EVD) outbreak in history. For the duration of the epidemic, a number of instances occurred where infected individuals were transported outside of West Africa to be treated in hospitals in more developed nations (i.e. United States). Fecal wastes produced from Ebola cases in health care facilities in the United States can be discharged directly into local sewage systems without pre-treatment in accordance to guidance from the US Centers for Disease Control and Prevention (CDC). There is a need for understanding how Ebola virus may persist in these wastes and to develop protocols for appropriate in situdisinfection pre-treatment of Ebola fecal wastes. Potential Ebola virus surrogates, MS2 coliphage, PhiX-174 coliphage, and Phi6 bacteriophage, were tested for survival at 22 and 37 OC and disinfection with sodium hypochlorite in a
conservative matrix of raw hospital sewage amended with human fecal waste. Phi6 required approximately nine days for a 5 log10 (99.999%) target reduction at the ambient condition (22 O
C) and, due to the presence of an outer lipid envelope layer, may conservatively represent the survivability of Ebola virus in a comparable fecal waste matrix. Target 5 log10 reductions of MS2 and PhiX-174 at 22
O-C required a predicted six and twelve weeks, respectively. All surrogate viruses were inactivated more rapidly at 37 O
C than at 22 O
C. Surrogates Phi6 and PhiX-174 were disinfected with sodium hypochlorite to a target 5 log10 (99.999%) reduction in 10 minutes at initial free chlorine concentrations of 2,800 and 3,500 mg/L, respectively. Free chlorine was rapidly consumed in the organic rich matrix, and therefore, high initial sodium hypochlorite concentrations were required to achieve significant reductions in viral titer.MS2 was extremely resistant to free chlorine disinfection and target reductions were not achieved with even the highest tested initial free chlorine concentrations. Disinfection kinetics were adequately
described using the Selleck model, accounting for a first-order disinfectant decay rate. Enveloped surrogate persistence in raw sewage and fecal waste indicates precautionary pre-treatment with a high concentration of free chlorine may greatly reduce risk. Due to its nearly universal
TABLE OF CONTENTS
ABSTRACT 2
LIST OF TABLES 5
LIST OF FIGURES 6
INTRODUCTION 8
OBJECTIVE 10
BACKGROUND AND REVIEW OF THE LITERATURE 11
EBOLA VIRUS 11
VIRUS SURVIVAL AND PERSISTENCE 12
EBOLA VIRUS PERSISTENCE IN BIOLOGICAL FLUIDS AND WASTE MATRICES 15
SURROGATE VIRUSES 16
CANDIDATE DISINFECTANT: FREE CHLORINE 18
FREE CHLORINE AND EBOLA VIRUS 20
RATIONALE FOR THIS STUDY 22
METHODS 23
SURROGATE VIRUSES 23
FECAL WASTE MATRIX COLLECTION AND PREPARATION 23
MATRIX ANALYSIS 24
CANDIDATE DISINFECTANT 25
BREAKPOINT CHLORINATION 26
CHLORINE NEUTRALIZATION 27
BATCH DISINFECTION EXPERIMENTS 28
SURVIVAL EXPERIMENTS 29
QUANTIFICATION OF RESULTS 30
DISINFECTION KINETICS MODELING 33
RESULTS 36
SURVIVAL 36
DISINFECTION 42
DISINFECTION KINETICS 47
DISCUSSION 54
SURVIVAL 54
DISINFECTION 57
LIMITATIONS 59
FUTURE WORK 60
REFERENCES 64
APPENDIX 70
ACKNOWLEDGEMENTS
I would like to thank the members of the UNC Environmental Virology lab for their support
throughout my graduate education. Thank you to Emily Bailey for her consistent help, training,
and patience. Thank you to the undergraduate members of our research team: Juan Camacho,
Noor Baloch, Nadia Mishal, Sam Elmes, Grace Allen, Greg Gadai, and Lexi Valenti. Thank you
to Dr. Emanuele Sozzi for his work, guidance, and leadership in completing the research found
in this report. I would like to give a special thanks to Dr. Mark Sobsey, the principal investigator
of this study, for his advice, wisdom, and belief in me. Thank you to the NSF for providing
funding for this research.
Also, thank you to my family for providing me with every opportunity to succeed and always
LIST OF TABLES
Table 1: Measured constituent values from matrix analysis. All constituents except pH were measured at Microbac Laboratories, Marietta, OH... 25
Table 2: Predicted times (in days) based on linear regression modeling for decimal reductions of MS2, PhiX-174, and Phi6 in a matrix of hospital sewage and fecal waste at 22 OC and 37 OC... 41
Table 3: Comparison of initial free chlorine concentrations (mg/L) required for 1 and 5 log10 reductions of each surrogate and the volume of bleach required to achieve a 5 log10 reduction in actual-scale conditions. *Actual amount (L) of 7.85% bleach needed for 5 log10 inactivation of surrogate virus in a 7.5 L toilet bowl... 46
Table 4: Selleck model of disinfection kinetics predicted reductions and parameter values for free chlorine disinfection of MS2 coliphage in a matrix of raw hospital sewage and human fecal waste. Mean squared error (MSE) values included... 49
Table 5: Selleck model of disinfection kinetics predicted reductions and parameter values for free chlorine disinfection of PhiX-174 coliphage in a matrix of raw hospital sewage and human fecal waste. Mean squared error (MSE) values included... 51
LIST OF FIGURES
Figure 1: Survival of surrogate MS2 coliphage (average t0 titer: 8.2 log10 PFU/mL) expressed as log10 (Nt/N0) over time (days) in a matrix of raw hospital sewage and human fecal waste at 22
O C (ambient) (blue circles) and 37 O
C (mesophilic) (red squares). Bars show the standard error for each time point (n ≥ 2 for each point). Linear trendlines are shown with corresponding R2
values. The dashed line represents a target 99.999% reduction in viral titer... 37
Figure 2: Survival of surrogate PhiX-174 coliphage (average t0 titer: 7.0 log10 PFU/mL) expressed as log10 (Nt/N0) over time (days) in a matrix of raw hospital sewage and human fecal waste at 22 O
C (ambient) (blue circles) and 37 O
C (mesophilic) (red squares). Bars show the standard error for each time point (n ≥ 2 for each point). Linear trendlines are shown with corresponding R2
values. The dashed line represents a target 99.999% reduction in viral titer... 38
Figure 3: Survival of surrogate Phi6 bacteriophage (average t0 titer: 7.8 log10 PFU/mL)
expressed as log10 (Nt/N0) over time (days) in a matrix of raw hospital sewage and human fecal waste at 22 O
C (ambient) (blue circles) and 37 O
C (mesophilic) (red squares). Bars show the standard error for each time point (n ≥ 2 for each point). Linear trendlines are shown with corresponding R2
values. The dashed line represents a target 99.999% reduction in viral titer... 40
Figure 4: Free chlorine disinfection of surrogate MS2 coliphage after 10-minutes contact time (average t0 titer: 8.3 log10 PFU/mL) expressed as log10 (Nt/N0) vs. varying initial free chlorine concentrations (mg/L) in a matrix of raw hospital sewage and human fecal waste. Bars show the standard error for each time point (n ≥ 2 for each point except 4000 mg/L). Linear trendline is shown with corresponding R2
value. The dashed line represents a target 99.999% reduction in viral titer... 43
Figure 5: Free chlorine disinfection of surrogate PhiX-174 coliphage after 10-minutes contact time (average t0 titer: 7.2 log10 PFU/mL) expressed as log10 (Nt/N0) vs. varying initial free chlorine concentrations (mg/L) in a matrix of raw hospital sewage and human fecal waste. Bars show the standard error for each time point (n ≥ 2 for each point except 4000 mg/L). Linear trendline is shown with corresponding R2
value. The dashed line represents a target 99.999% reduction in viral titer... 44
Figure 6: Free chlorine disinfection of surrogate Phi6 bacteriophage after 10-minutes contact time (average t0 titer: 7.9 log10 PFU/mL) expressed as log10 (Nt/N0) vs. varying initial free chlorine concentrations (mg/L) in a matrix of raw hospital sewage and human fecal waste. Bars show the standard error for each time point (n ≥ 2 for each point except 4000 mg/L). Linear trendline is shown with corresponding R2
Figure 7: Free chlorine disinfection of surrogate MS2 coliphage (average t0 titer: 8.3 log10 PFU/mL) expressed as log10 (Nt/N0) at 1, 3, 10, and 30-minute time points with varying initial free chlorine concentrations of (A) 500, 1500, 2000 mg/L and (B) 2500, 3000, 4000 mg/L in a matrix of raw hospital sewage and human fecal waste. Disinfection kinetics predicted using Selleck Model under disinfectant demand conditions are shown for each initial free chlorine concentration (smooth curves). Bars show the standard error for each time point (n ≥ 2 for each data series except 4000 mg/L)... 48
Figure 8: Free chlorine disinfection of surrogate PhiX-174 coliphage (average t0 titer: 7.2 log10 PFU/mL) expressed as log10 (Nt/N0) at 1, 3, 10, and 30-minute time points with varying initial free chlorine concentrations of 500, 1000, 1500,2000, 2500, 3000, and 4000 mg/L in a matrix of raw hospital sewage and human fecal waste. Disinfection kinetics predicted using Selleck Model under disinfectant demand conditions are shown for each initial free chlorine concentration (smooth curves). Bars show the standard error for each time point (n ≥ 2 for each data series except 4000 mg/L)... 50
INTRODUCTION
Between March 2014 and January 2016, West Africa experienced the largest Ebola virus disease
(EVD) outbreak in history. EVD causes severe viral hemorrhagic fever in infected individuals.
The epidemic resulted in 28,646 cases of EVD and 11,323 deaths, with most of these deaths
occurring in Guinea, Liberia, and Sierra Leone {WHO 2016}. As the epidemic became a health
crisis and difficult to control during the second half of 2014, the World Health Organization
declared a public health emergency of international concern. This significant outbreak was
caused by the species Zaire ebolavirus, a virus belonging to the Filoviridae family, a group of
enveloped, filamentous viruses containing a negative-sense single-stranded RNA genome {CDC
2014}. The infectious dose of Ebola virus is believed to be <10 infectious virus particles {Jelden
et al. 2015}.
For the duration of the epidemic, a number of instances occurred where unknowingly infected
individuals left West Africa and then became ill or infected individuals were transported outside
of West Africa to be treated in hospitals in more developed nations (i.e. United States). These
individuals posed a great risk of spreading the virus to others and were treated in health care
facilities under quarantine conditions, making it possible to contain the viruses they shed from
bodily fluids.
The exact concentration of infective Ebola virus in different bodily fluids is unknown, but
non-human primate Ebola virus organ infectivity titers have exhibited high viral concentrations
approaching 107
and 108
PFU mL-1
and viral loads in human blood, stool, and urine have shown
genome copy concentrations up to 108 mL-1
, 107 mL-1
, and 105.5 mL-1
Hensley et al. 2003; Wolf et al. 2015}.Infected individuals may produce up to nine liters of
liquid waste in a single day, mostly in the form of watery diarrhea {Lowe et al. 2014}.
Currently, fecal wastes produced from Ebola cases in health care facilities in the United States
can be discharged directly into local sewage systems without pre-treatment in accordance to
guidance from the US Centers for Disease Control and Prevention (CDC) {CDC US 2014}. It is
assumed, but not well documented, that dilution and conventional wastewater treatment will
result in removal and inactivation of infectious Ebola virus, resulting in negligible risk. However,
there is concern that Ebola may persist in these wastes. Bibby et al. (2015) found recoverable
infectious Ebola virus for a period of at least 8 days in virus-seeded, irradiated sewage and a
study by Cook et al. (2015) showed 15 days were required for a 4 log10 reduction of Ebola virus
in a dried organic load {Bibby et al. 2015; Cook et al. 2015}. Given this possible persistence,
there is concern that Ebola virus in local sewage systems could pose EVD risk to sewer workers
and others (during sewer overflow or servicing events) who might become exposed to feces and
sewage that contains shed Ebola virus. Thus, there is a need to determine the survivability of
infectious Ebola virus in fecal wastes and sewage and the effectiveness of chemical disinfection
pre-treatment to inactivate it in fecal wastes and sewage.
A number of disinfectants are recommended to inactivate Ebola in healthcare settings, including
sodium hypochlorite (liquid bleach) {CDC US 2014}. However, disinfectants have only recently
been studied for their ability to inactivate Ebola virus in sewage, and have not been studied at all
in raw sewage or raw human fecal waste. Appropriate in situ disinfectionpre-treatment of
sewage and fecal waste produced by Ebola patients will reduce risks associated with direct
OBJECTIVE
The purpose of this research was to quantify the survival and inactivation by sodium
hypochlorite disinfection (and model the inactivation kinetics) of Ebola virus surrogates MS2,
PhiX-174, and Phi6 in a conservative matrix consisting of raw hospital sewage amended with
human fecal waste. Ultimately, this research will contribute to the development of a protocol for
the in situ disinfection pre-treatment of Ebola virus to achieve a target 5 log10 (99.999%) virus
reduction within 10 minutes in the fecal waste of infected individuals being treated in hospitals
BACKGROUND AND REVIEW OF THE LITERATURE
Ebola Virus
The 2014 West African Ebola virus disease (EVD) outbreak was caused by the genera
Ebolavirus (EBOV), and more specifically viruses belonging to the species Zaire ebolavirus.
The epidemic resulted in 28,646 cases of EVD and 11,323 deaths. Most of these deaths occurred
in Guinea, Liberia, and Sierra Leone {WHO 2016}.As of January 14th
, 2016, the outbreak was
considered to be over but with further flare-ups possible.
Ebola virusbelongs to the family Filoviridae, a group of enveloped, filamentous viruses
containing a negative-sense single-stranded RNA genome {CDC 2014}. Marburgvirus and Ebolavirus are the only two members of this family and are known to cause severe hemorrhagic
fever in humans and non-human primates {CDC 2014}.Infections during periods of outbreak
are typically a result of direct contact with bodily fluids of infected individuals or cadavers
{WHO 1978}.Probable routes of exposure to Ebola virus include host mucosal surfaces, skin
abrasions, and parenteral introduction {Feldmann and Geisbert 2011}. The infectious dose of
Ebola virus is believed to be <10 infectious viral particles {Jelden et al. 2015}.
Studies of non-human primates indicate that, upon entering the host, the preferred replication
sites of Ebola virus are likely monocytes, macrophages, and dendritic cells, which facilitate
dissemination of the virus to the lymph nodes, liver, and spleen {Geisbert et al. 2003}.The exact
concentration of infective Ebola virus in different bodily fluids is unknown, but non-human
primate Ebola virus organ infectivity titers have exhibited high infectious virus concentrations
approaching 107
and 108 mL-1
genome copy concentrations up to 108 mL-1
, 107 mL-1
, and 105.5 mL-1
, respectively {Geisbert,
Hensley et al. 2003; Wolf et al. 2015}.Infected individuals may produce up to nine liters of
liquid waste in a single day, mostly in the form of watery diarrhea which may contain blood
{Lowe et al. 2014}. It is this diarrhea, water, and various other body fluid mixture deposited into
hospital toilets that is the matrix of concern to this report, and in which surrogate virus survival
and disinfection tests will occur to ensure safe disposal to wastewater conveyances and treatment
facilities.
Virus Survival and Persistence
A number of possible physical, chemical, and biological factors may influence the fate and
persistence of viruses in sewage and fecal waste. Important physical factors are heat or thermal
effects, aggregation, and adsorption or embedding {Sobsey 2005}.
Elevated temperatures are known to inactivate virus infectivity by inducing protein denaturation
and possibly by disrupting enzymatic activity required for infection of host cells {Melnick and
Gerba 1980}.In a survival study of a highly persistent enveloped animal virus, Aujeszky’s
disease virus (pseudorabies virus), in swine fecal waste under anaerobic storage conditions, virus
inactivation rates increased with increasing temperature. Aujeszky’s disease virus required two
weeks for 4 log10 inactivation at 20 O
C (near ambient) but required only 5 hours for 4 log10
inactivation at 35 O
C (mesophilic conditions) and 10 minutes for 4 log10 inactivation at 55 O
C
Aggregation or clumping of viral particles protects them from inactivation by chemical or
biological agents {Sobsey 2005}. It is very unlikely that all virions will be single particles and
aggregates can consist of several hundred particles {Melnick and Gerba 1980}.In a study of
poliovirus aggregate halogen disinfection in water, Young and Sharp (1977) observed a
continuously decreasing reaction rate of bromine inactivation for aggregated viral particles
{Young and Sharp 1977}. Viral particles can also readily adsorb to or embed themselves in
particulate material. Studies have shown that a virus that is adsorbed generally has a better
chance of survival than one that is freely suspended {Gerba 1975}. A small batch virus survival
study by Sobsey et al. (1980) showed that reovirus persisted longer in solutions containing soil
loads than control solutions that were soil-free, due to adsorption effects {Sobsey et al. 1980}. A
recent study of Ebola virus persistence in irradiated wastewater by Bibby et al. (2015) displayed
an apparent rapid viral decrease (4 log10 reduction within the first day), followed by a slight
recovery and subsequent steady inactivation. This initial rapid decrease was attributed to possible
viral particle aggregation or adsorption to wastewater particles {Bibby et al. 2015}.
Chemical properties of a sewage or fecal waste matrix of particular interest to virus survival and
persistence are pH and ammonia content {Sobsey 2005}.
Viruses tend to survive best near neutral pH and worst at pH extremes. Ajariyakhajorn et al.
(1997) found that both pseudorabies virus (PRV) and porcine reproductive and respiratory
syndrome virus (PRRSV) survived in swine slurry longest at pH 7.0, compared to pH 4.0 and
10.0, with PRV and PRRSV persisting for 8 and 14 days, respectively {Ajariyakhajorn et al.
Ammonia (NH3) has virucidal activity and, when present in higher concentrations at a pH > 8,
can inactivate viruses in a fecal waste matrix {Sobsey 2005}. A study by Vinnerås et al.
concerning chemical disinfection of separated fecal matter showed that 30 g of ammonia per
kilogram of feces at pH 9.3 displayed a slow initial reduction but had significant effects on S.
typhimurium 28b phage survival over a period of 21 days (1 log10 greater reduction than control)
and 50 days (7 log10 greater reduction than control) {Vinnerås et al. 2003}.
Microbial activity (production of proteolytic enzymes) and predation (engulfment, ingestion) are
noteworthy biological components affecting persistence of viruses in sewage and feces. Antiviral
bacterial activity was demonstrated in poliovirus persistence studies performed by Deng and
Cliver (1992). These field experiments were conducted in raw mixed septic tank effluent and
swine manure slurry compared to an autoclaved mixed waste. At 25 O
C in raw mixed waste,
poliovirus experienced a 90% reduction in virus titer in 6.8 days compared to 11.2 days for the
autoclaved mixed waste, which was a statistically significant difference. At 37 O
C, the 90%
reductions were 1.3 and 3.9 days in raw mixed waste and autoclaved mixed waste, respectively
{Deng and Cliver 1992}.
Pathogenic virus survival often exhibits first-order inactivation kinetics and is typically modeled
using linear regression analysis. Stallknecht et al. (1990) modeled viral decay rates of four avian
influenza viruses in water using linear regression analysis and trendlines adequately explained
results in all cases. Casanova et al. (2009) found that inactivation of swine transmissible
gastroenteritis virus (TGEV) and mouse hepatitis virus (MHV) in water and pasteurized sewage
followed first-order kinetics and was appropriately modeled using regression analysis.
(exponential decay) linear regression. Fischer et al. (2015), used linear regression modeling to
describe virus inactivation over time when Ebola virus persistence was tested in a number of dry
and liquid conditions in simulated outbreak environments. Bibby et al. (2015) tested the
persistence of Ebola virus in sterilized wastewater and used linear regression analysis to model
persistence over a period of 8 days. Sagripanti et al. (2010) also found that linear regression
modeling adequately described the inactivation kinetics of Ebola virus in solutions dried on
different surfaces.
Ebola Virus Persistence in Biological Fluids and Waste Matrices
Recent studies on the persistence of Ebola virus in biological fluids and environmental media
have indicated a noteworthy survivability of the enveloped virus. In a study by Chughtai et al.
(2016) of particular human body fluids, Ebola virus was isolated from semen, aqueous humor,
urine, and breast milk 82, 63, 26, and 15 days after onset of illness, respectively. Viral RNA was
isolated from these fluids for an even longer period {Chughtai et al. 2016}.
In media of distinct importance to the research conducted in this report (water, feces, sewage),
Ebola virus persists similarly. In a study by Cook et al., Ebola virus (Makona variant) was
suspended in a simulated organic load (meant to mimic residual bodily fluids) and then dried on
a number of surfaces to quantify persistence. Based on a model projection, roughly fifteen-days
would be required to achieve a 4 log10 reduction (99.99%) {Cook et al. 2015}. In another study
by Bibby et al, Ebola virus spiked into gamma-irradiated wastewater matrix showed persistence
(recoverable active viruses) for at least 8 days {Bibby et al. 2015}. In a related study of filovirus
et al, Ebola virus required twenty-six days for a 4 log10 reduction in virus titer {Piercy et al.
2010}.These few studies give apparently different quantitative results but indicate a minimum of
8 days are required for an appropriate reduction and maximum survival periods could be on the
order of several weeks. It is important to consider the physical, chemical, and microbiological
differences between a simulated organic load matrix, a biologically inert sewage matrix
(pasteurized by high-energy irradiation), a tissue culture medium matrix, and a non-pasteurized
fecal waste and hospital sewage matrix utilized in the experiments of this report.
Surrogate Viruses
Due to the designation of Ebola virus as a biosafety level-4 pathogen (BSL-4), experimentation
with the virus is exceedingly difficult. In order to perform representative tests concerning the
survival and disinfection of Ebola virus, surrogate viruses were used instead. An ideal surrogate
would be at least as persistent as Ebola virus, more (but not exceptionally more) resistant to
disinfection processes, and relatively simple to work with and recover/enumerate. MS2
coliphage, PhiX-174 coliphage, and Phi6 bacteriophage were the surrogates considered and used
to test survival and disinfection in this report.
MS2 bacteriophage (Leviviridae) is a single-stranded RNA virus that infects Escherichia coli,
making the virus a ‘coliphage’ {Abedon and Calendar 2005}. MS2 only infects E. coli carrying
an F (fertility) plasmid that produces a pilus used in bacterial conjugation. The bacteriophage
attaches to this pilus before entering the host cells {Davis et al. 1961}. An MS2 virion is
non-enveloped and has an icosahedral protein capsid {Golmohammadi et al. 1993}. MS2 has been
disinfection studies and has shown resistance to chlorine disinfection {Sobsey et al. 1988; Shin
and Sobsey 1998; Gray et al. 1993; Dawson et al. 2005}.
PhiX-174 bacteriophage (Microviridae) is a non-enveloped virus that also infects E. coli and has
a circular single-stranded DNA genome, which was the first DNA-based genome sequenced
{Sanger et al. 1977}.PhiX-174 infects by binding to lipopolysaccharides on the bacterial host
cell surface (somatic coliphage) then injecting the viral genome through the membrane
{Jazwinski and Kornberg 1975}. The virus has commonly been used as a blood-borne pathogen
surrogate for Hepatitis B and C (HBV, HCV) and Human Immunodeficiency Virus (HIV) in
barrier penetration studies based on its size, morphology, and environmental stability similarities
{Ball et al. 2012}. PhiX-174 has also been reported to survive longer than other bacteriophages
and human enteric viruses in groundwater (Charles et al, 2009).
Phi6 bacteriophage (Cystoviridae) is a double-stranded RNA virus that infects the plant
bacterium Pseudomonas syringae {Vidaver et al. 1973}.The virus has been suggested and tested
as a surrogate for pathogenic enveloped viruses, like Ebola virus and avian influenza, and
survival studies have been conducted in water, on PPE, and in pasteurized human sewage
{Casanova and Weaver 2015}. Phi6 bacteriophage may more accurately represent Ebola virus
survival and disinfection compared to the previously mentioned coliphages (MS2 and PhiX-174)
due to the presence of an outer lipid envelope layer. Phi6 and also Phi8, of the same
bacteriophage family, were reported to at survive at least as long as avian influenza virus H5N1
in fresh water and were somewhat persistent when subjected to chlorine disinfection (Adcock et
Candidate Disinfectant: Free Chlorine
Free chlorine, typically used in the form of sodium hypochlorite (liquid bleach), has long been
used in water and wastewater treatment to inactivate harmful pathogens due to its availability,
ease-of-use, affordability, acceptability, and high disinfection efficacy. Despite the extensive use
of chlorine, the exact mechanism by which the compound inactivates bacteria and viruses is not
clearly understood. Possible modes of action include oxidation of sulfhydryl groups on certain
amino acids in structural proteins and enzymes, loss of intracellular contents from cells,
decreased adenosine triphosphate (ATP) production, breaks in DNA and RNA, depressed DNA
and RNA synthesis and function, and several others {Rutala and Weber 2008}. Most vegetative
bacteria have a low tolerance to chlorine and are inactivated relatively easily. Viruses, however,
are moderately resistant to the disinfection actions of chlorine {CDC 2012}. Additionally,
non-enveloped (naked protein coat) viruses (ex: norovirus) tend to be more resistant than
lipid-surrounded enveloped viruses (ex: influenza) {Maillard 2001}. Electron microscopy has shown
that chlorine can cause complete degeneration of enveloped viral particles and destruction of
nucleic acids {Shirai et al. 1999}.
Several parameters influence the virucidal activity of free chlorine. Classic factors such as
concentration, contact time, temperature, and pH all affect the efficacy of free chlorine
disinfection. Ideal conditions for disinfection are slightly acidic pH (approximately pH 6)
combined with elevated temperature {Northern Territory Government 2013}. The chemical
speciation of chorine is pH dependent, with hypochlorous acid as the major species and
Hypochlorous acid is the stronger disinfectant of the two species and greater log10 reductions are
realized in lower pH experimental conditions {LeChevallier and Au 2004}.
Composition of the disinfection matrix is another particularly important factor. Although free
chlorine is effective at treating low-turbidity drinking water, raw wastewater and fecal waste are
rich in oxidizable organics and requires significantly higher concentrations of free chlorine in
order to reach acceptable pathogen reductions {Maillard 2001}. A disinfection matrix rich in
organics will rapidly consume free chlorine (formation of organochlorides/chloramines) so
excess amounts must be added to maintain a desired free chlorine residual. The free chlorine
concentration at which the residual is achieved is known as a chlorination breakpoint. Upon
reaching ‘breakpoint chlorination,’ the free chlorine residual will increase predictably as more
chlorine is added {Bowman and Mealy 2007}. In addition to consuming free chlorine, suspended
organic material may also facilitate the aggregation and protection of viral particles from
inactivation {Maillard 2001}.
Typically, Ct (the product of disinfection concentration, C, and contact time, t) values are the
standard for determining the efficacy of a candidate disinfectant against a target organism.
However, these values are not always transferable across organisms or test conditions {Haas et
al. 1996}. The majority of disinfection kinetic models, including the classic Chick-Watson linear
model (Ct), do not consider the decay of the disinfectant over time and may not predict Ct values
for organisms that are not disinfected according to a first-order decay rate {Haas and Joffe
1994}. A study by Venczel et al., showed significantly higher Ct 99.99% values for MS2
bacteriophage reduction were required when free chlorine disinfection experiments were
(consumption of free chlorine residual) compared to disinfection experiments in demand-free test
water {Venczel et al. 2004}.
Under circumstances when inactivation kinetics does not conform well to first-order models due
to disinfectant demand conditions, models that include a term for the first-order decay of
disinfectant concentration over time should be considered. According to Haas (1979), assuming
that the disappearance of a disinfectant is governed by irreversible first-order kinetics, which
must be independent from the rate of organism inactivation, the Selleck rate law can include such
a term {Haas 1979}. The model was initially derived to describe the inactivation of bacteria in
wastewater with chlorine disinfectant, which is directly applicable to the disinfection
experiments in this report. The Selleck model is an empirical model and is therefore applicable to
any chemical disinfectant, organism, and test matrix {Gyürék and Finch 1998}.
Free Chlorine and Ebola Virus
According to the US CDC, Ebola virus will be inactivated relatively easily using many common
chemical agents including household bleach solution when used according to the label
instructions. In a figure published on the CDC ‘Ebola virus in medical waste’ webpage,
enveloped viruses are presented as the most susceptible microorganisms to disinfection and
sterilization (even more susceptible than vegetative bacteria like S. aureus) {CDC 2015}.
Current literature depicts differing results of the performance of chlorine against Ebola virus.
In a 2015 systematic review of the efficacy of chlorine solution for hand hygiene and glove
the ability of chlorine to inactivate Ebola virus {Hopman et al. 2015}. However, in a recently
published study by Cook et al, 0.5% and 1% sodium hypochlorite solutions sufficiently
inactivated the Ebola virus (Makona variant) in a dry, simulated organic soil load within a
five-minute contact time. This simulated organic load composition was based on the ASTM
International Quantitative Carrier Testing 2 international standard and included 106.25 μL of
Ebola virus stock, 12.5 μL 5% BSA (bovine serum albumin), 17.5 μL 5% tryptone, and 50 μL
0.4% mucin. Ten microliters of this virus-soil load mixture was deposited on a stainless steel
carrier disk and was then treated with 50 μL of 0.01%, 0.1%, 0.5%, and 1% sodium hypochlorite
solution. No significant reduction in viral titer occurred for 0.01% and only a partial reduction
occurred for 0.1% (about 3 log10 reduction after 10-minute contact time) {Cook et al. 2015}. It
must be noted that these experiments required a significant volume of disinfectant (5:1
disinfectant solution to virus matrix (v/v)) to achieve desired reductions of Ebola virus. Another
recent study by Bibby et al. (2017) studied the disinfection of Ebola virus using sodium
hypochlorite in sterilized municipal wastewater. Their research showed that 5 and 10 mg/L of
initial free chlorine resulted in free chlorine residuals of 0.52 and 1.11 mg/L respectively and
was sufficient to disinfect Ebola virus to the detection limit (4.2 log10) within 20 seconds of
contact time. For a lower initial free chlorine concentration, 1 mg/L, a 3.5 log10 reduction was
recorded at 20 seconds, but further inactivation was not evident due to the rapid decay of the free
chlorine residual. The municipal sewage matrix used for this disinfection study had a COD
concentration of 54.7 mg/L, TOC concentration of 31.6 mg/L, TSS concentration of 129 mg/L,
and ammonia concentration of 32.5 mg/L. Such sewage may not be adequately representative of
Rationale for this Study
While a number of studies have investigated the survival and disinfection of viruses in various
sewage and organic matrices, there is little or no research concerning survival of viral pathogens
and surrogates in raw hospital sewage amended with human fecal waste. Researchers have
attempted to determine what the persistence of Ebola virus might be in sewage, but these
matrices are either heat pasteurized or irradiated prior to introducing Ebola or surrogate viruses
and do not represent the biologically active conditions of raw sewage and feces. Additionally,
despite free chlorine being a suggested disinfectant for inactivation of Ebola virus in health care
settings, there have been no studies concerning sodium hypochlorite disinfection in a matrix that
conservatively reflects fecal wastes associated with patients suffering from EVD. These voids in
METHODS
Surrogate Viruses
The potential Ebola surrogate viruses used in survival and disinfection experiments in this report
were Phi6 bacteriophage (capable of infecting Pseudomonas syringae), MS2 coliphage (capable
of infecting FampE. coli), and PhiX-174 coliphage (capable of infecting CN13 E. coli). These
surrogate viruses were chosen because of their previous use as surrogates for human viral
pathogens like norovirus, hepatitis B and C, HIV, avian influenza, etc. Surrogates were also
chosen based on their acceptance in BSL-2 laboratories and their ease of recovery and
enumeration. MS2 coliphage stock was prepared from American Type Culture Collection
(ATCC) seed stock (coliphage propagation protocol included in appendix). PhiX-174 coliphage
stock was also prepared from ATCC seed stock (coliphage propagation protocol included in
appendix). Phi6 bacteriophage stock was prepared from Georgia State University seed stock and
was propagated with the sloppy agar method described by Casanova and Waka (2013). Viral
stocks were stored at -80 OC in small aliquots to reduce freeze-thaw inactivation. Aliquots were
removed from frozen storage approximately 0.5 hours before beginning experiments and viruses
were spiked directly from thawed stock.
Fecal Waste Matrix Collection and Preparation
The representative matrix utilized in survival and disinfection experiments consisted of 25%
human fecal matter from bowel movements of humans and 75% raw hospital sewage (w/w).
Fresh fecal samples were collected in sealable plastic collection containers from anonymous
Hospital sewage was collected from manhole access points to the sewage system at three
sampling sites at UNC Hospitals. Three equal volumes from each site were combined to form a
representative hospital sample (75% of the total matrix weight, i.e. one quarter of the final matrix
from each hospital sewage collection site). At each collection site, sewage was collected directly
as grab samples in sterile 500 mL polypropylene bottles and kept chilled in a cooler with ice
during transport back to the laboratory. The sewage in the sewer pipeline was not treated, and
came directly from one of the following hospital departments:
1. Gastroenterology + Medical Intensive Care Unit
2. Burn + Labs + Intensive Care Unit
3. Emergency Room + Neurology
On the day of collection, fecal and hospital samples were mixed vigorously and the resulting
matrix was stored in a walk-in refrigerator at 4 OC (± 1 OC) in 20 or 35 mL aliquots. Disinfection
experiments were performed in 20 mL sample volumes of the matrix and survival experiments
were performed in 35 mL sample volumes of the matrix. The matrix aliquots were not
pasteurized prior to survival or disinfection experiments to most appropriately represent actual
waste conditions. The initial pH of this matrix was tested using an electronic glass pH electrode
(matrix pH 6.7 ± 0.2). New matrices were produced with the same procedures approximately
every 2 weeks to ensure “freshness” by avoiding changes in composition or biological activity
that could occur during prolonged storage.
Matrix Analysis
A sample of raw hospital sewage and human fecal waste matrix was analyzed at an
OH). The report parameters included biochemical oxygen demand (BOD), total suspended solids
(TSS), total organic carbon (TOC), chemical oxygen demand (COD), and ammonia content. The
pH was measured at the UNC Environmental Virology Lab using an electronic glass pH
electrode. Constituent measurements are summarized in Table 1.
Constituent Measured Value
pH 6.7 ± 0.2
BOD (mg/L) 19,600
COD (mg/L) 63,500
TSS (mg/L) 73,200
TOC (mg/L) 13,600
Ammonia (mg/L) 216
Table 1: Measured constituent values from matrix analysis. All constituents except pH were measured at Microbac Laboratories,
Marietta, OH.
Candidate Disinfectant
Sodium hypochlorite (free chlorine) used in the following experiments was a 7.85% (78,500 mg
free Cl/L) household-bleach (commercially available as ‘Harris Teeter – Your Home’ brand
sodium hypochlorite solution). Approximate concentrations of 0 mg/L, 500 mg/L (0.05%), 1000
mg/L (0.1%), 1500 mg/L (0.15%), 2000 mg/L (0.2%), 2500 mg/L (0.25%), 3000 mg/L (0.3%),
or 4000 mg/L (0.4%) free chlorine were delivered to 20 mL volumes of fecal waste matrix
containing surrogate viruses. Initial concentration of stock bleach disinfectant was confirmed
prior to use with a Hach Pocket Colorimeter II apparatus using a standard N,N-diethyl-p
-phenylenediamine (DPD) colorimetric method according to the instructions of the colorimeter
Breakpoint Chlorination
Breakpoint chlorination experiments were performed in the same matrix as batch disinfection
experiments. A total residual chlorine test was conducted in 30 mL of undiluted matrix. Liquid
bleach was added step-wise from 250 mg/L to 10,000 mg/L initial free chlorine. After each
chlorine addition, the matrix was shaken vigorously for 35 seconds to ensure sufficient contact
between the chemical disinfectant and the matrix. The matrix was then diluted 1,000 fold (in
distilled water) to reduce turbidity and to get the concentration into the detectable range of the
instrument when testing using a Hach Pocket Colorimeter II. The measured total Cl was recorded
and adjusted for dilution (Table A1). Adjusted residual total chlorine concentrations were plotted
versus initial free chlorine concentrations to determine a likely breakpoint (Figure A1). Linear
regression analysis was performed from where residual total chlorine values began to
significantly increase (R2
= 0.99). The predicted breakpoint for this test was approximately 2,300
mg/L.
In another experiment to determine breakpoint chlorination, a residual free chlorine test was
conducted. A 1:100 dilution of the fecal waste matrix was dosed with stepwise additions of free
Cl from about 2 mg/L to over 100 mg/L. After dosing, the matrix was shaken vigorously for 35
seconds to ensure sufficient contact between the chemical disinfectant and the matrix. The
mixture was then allowed to sit for a total contact time of 10 minutes. An additional 10-fold
dilution was required to reduce turbidity when testing with a Hach Pocket Colorimeter II
apparatus. The measured free Cl was recorded and adjusted for dilution (Table A2). The initial
free Cl values were also adjusted to reflect the initial values required in an undiluted matrix.
concentrations to determine a likely breakpoint (Figure A2). Linear regression analysis was
performed from where residual free chlorine values began to significantly increase (R2
= 0.997).
The predicted breakpoint for this test was approximately 2,500 mg/L.
Chlorine Neutralization
Appropriate volumes of stock 1000 mg/L sodium thiosulfate were used to neutralize chlorine for
all neutralization and disinfection experiments. A chlorine neutralization experiment was
performed for an initial chlorine concentration of 500 mg/L in 20 mL of distilled water. Tests
were run in a sterile 50-mL polypropylene, conical bottom, screw-capped tube (Falcon). Distilled
water has little or no chlorine demand, therefore if neutralization was achieved, no subsequent
microbial inactivation was assumed. Neutralization tests were confirmed with a Hach Pocket
Colorimeter II apparatus utilizing free chlorine DPD test packets. Four separate neutralization
concentrations were tested for their neutralization ability: 0.5x (250 mg/L sodium thiosulfate),
1.0x (500 mg/L), 1.5x (750 mg/L), and 2.0x (1000 mg/L). The appropriate volume of household
bleach solution was added to 20 mL of distilled water and shaken thoroughly. The mixture was
allowed to sit for two minutes prior to adding the sodium thiosulfate test concentration. After
adding the neutralizer, the mixture was shaken vigorously to ensure contact between sodium
thiosulfate and free chlorine prior to determining free chlorine concentration. The 0.5x and 1.0x
tests did not adequately neutralize the available free chlorine. Subsequent tests with 1.5x and
2.0x neutralizer concentrations provided positive neutralization results. Seemingly, a minimum
of 1.5x (750 mg/L) concentration of neutralizer compared to free chlorine concentration was
required to neutralize the distilled water matrix used in these test experiments. Using this
6X concentration) to ensure complete free chlorine neutralization during disinfection
experiments. Neutralization volumes were based on residual chlorine concentration values
obtained in breakpoint experiments. Control experiments where only excess sodium thiosulfate
was added were conducted to ensure there were no quantifiable effects of sodium thiosulfate on
the inactivation of the surrogate organisms of interest.
Batch Disinfection Experiments
At the start of disinfection experiments, viral stocks were spiked into a 20 mL matrix aliquot in a
sterile 50-mL polypropylene, conical bottom, screw-capped tube (Falcon) to a target
concentration of approximately 107 to 108 PFU/mL. A baseline sample of 2 mL was taken
following spiking to assess the initial concentration to determine log10 reductions at subsequent
time points. This sample was filtered using a 0.22-μm filter (Millipore EX) and a 3 mL
disposable syringe (BD).
Following baseline, the matrix was dosed with sodium hypochlorite disinfectant to a desired
initial free chlorine concentration, a timer was started, and the matrix was shaken well for
approximately 35 seconds to mix the disinfectant evenly throughout the matrix.
Small 8 mL polypropylene screw-cap tubes (Sarstedt) were prepared before disinfectant dosing
for each time point and were filled with an appropriate amount of neutralizer (1000 mg/L stock
sodium thiosulfate) to cease disinfection at the time of sampling. The neutralization volumes
required were determined by the methods described previously. Control tests were conducted to
ensure that the shaking technique used had no quantifiable effect on the inactivation of surrogate
Time points were taken at 1, 3, 10, and 30 minutes following disinfectant dosing (5-minute time
points were taken for a few initial trials). At each time point, 5 mL of matrix was poured into the
neutralization vials (pre-filled with the appropriate neutralizer) and the vials were shaken
vigorously for approximately 1-minute to ensure neutralization. After the 30-minute period, each
of these neutralized samples was filtered using the same method as the baseline sample. This
filtrate was then diluted (if necessary) to the appropriate dilution in 1.5 mL polypropylene
centrifuge tubes (Eppendorf) using stock 1X phosphate saline buffer (PBS) as the diluent. The
preparation of PBS stock is described in the appendix. The viral concentrations of these
neutralized and diluted samples were subsequently determined using a double agar layer plaque
assay enumeration method (DAL). The DAL method utilized was a modified version of the EPA
1602 method (Section 11.3).
Survival Experiments
Somewhat similar to previously described disinfection methodologies, at the beginning of
survival experiments, viral stocks were spiked into a 35 mL matrix aliquot in a sterile 50-mL
polypropylene, conical bottom, screw-capped tube (Falcon) to a target concentration of
approximately 107 to 108
PFU/mL. A baseline sample was taken following spiking to assess the
initial virus concentration in order to later determine log10 reductions based on remaining virus
concentrations at subsequent time points. All samples were collected and filtered using a
0.22-μm filter and a 3 mL disposable syringe (BD). Sealed 50 mL tubes were then placed in the dark
at either ambient temperature (22 o
C) or mesophilic temperature (37 o
C incubator room) for the
following baseline. After a period of several days, samples were taken intermittently at longer
time intervals until a maximum of 18 days. At least two replicate samples (n ≥ 2) were taken for
each sampling day of interest.
At each time point, samples were filtered as previously described and this filtrate was then
diluted (if necessary) to the appropriate dilution as previously described. The virus concentration
of these diluted samples was subsequently determined using a double agar layer enumeration
method (DAL) that was a modification the EPA 1602 method (Section 11.3).
Quantification of Results
Plates for DAL plaque assay (‘bottom agar’ plates) were prepared several days before the
experiments. Polystyrene, 100 mm diameter plates were filled with approximately 10-12 mL of
1.5 times (1.5X) standard concentration of tryptic soy agar (TSA) (60 g/L). TSA powder was
mixed with the appropriate amount of distilled water and then autoclaved. Plates for P. syringae
(Phi6 host) contained only 1.5X TSA and 4M MgCl2 stock was added as 0.25% of the total agar
volume. Plates for E. coli host were made the same way but appropriate antibiotic stocks
(Streptomycin and Ampicillin for E. coli Famp; Nalidixic acid for E. coli CN13) were added as 1%
of the total agar volume after agar cooled to approximately 50-60 O
C prior to plating the agar.
Streptomycin-ampicillin antibiotic stock was prepared by adding 0.15 g ampicillin sodium salt
and 0.15 g streptomycin sulfate to 100 mL of deionized water and this solution was filtered using
a 0.22 μm filter and stored frozen in small volumes. Nalidixic acid antibiotic stock was prepared
by adding 1.0 g nalidixic acid sodium salt to 100 mL of deionized water and this solution was
were allowed to cool, uncovered, to room temperature. Plates were then inverted and stored at 4
O
C up to six weeks in sealed bags to prevent contamination.
Top (semisolid) agar for DAL was made the day of the experiment. An appropriate number of 20
mL glass test tubes were covered with aluminum foil and autoclaved along with 0.7X TSA (28
g/L). Following autoclaving, the top agar and tubes were placed in a 45-50 O
C water bath. After
agar had reached the water bath temperature, 4M MgCl2 was added as 0.25% of the total agar
volume and appropriate antibiotic stock was added as 1% of the total agar volume to top agar
and 5 mL of the agar was dispensed into each test tube.
Host bacteria for DAL were prepared from stationary phase hosts produced from frozen stocks.
Log phase E. coli hosts were prepared from overnight cultures that were stored at 4 O
C following
exponential growth. Log phase hosts were grown in 50 mL of tryptic soy broth (TSB) growth
media with 1% of the total media volume as stationary phase host stock and 1% of the total
media volume as appropriate antibiotic stock. This mixture was then incubated for 1.5 to 2 hours
to reach logarithmic phase of growth. P. syringae host does not require a log phase for infection
and was prepared 18-24 hours prior to running experiments using 50 mL of TSB and 1 mL of
frozen host stock prepared previously by propagation in TSB. There was no antibiotic used for P.
syringae growth.
DAL was performed by adding approximately 850 μL of appropriate bacterial host to the top
agar test tube containing 5 mL of agar. Next, 100 μL of sample was added to the top agar. The
contents of the test tube were swirled to mix contents thoroughly and then the agar mixture was
plate. Plates were manipulated to spread agar uniformly across all parts of the plate and were
allowed to cool (uncovered) to room temperature. Dilutions were typically plated in duplicate.
Plates were then inverted. P. syringae host plates were placed in a 24 O
C incubator (P. syringae
host does not grow above 25 O
C) and E. coli host plates were placed in a 37 O
C incubator room.
The plates were incubated overnight to allow host bacteria lawn to form and for viral plaques to
develop. After 18-24 hours of incubation, the plaques were counted and plaque-forming units
(PFU) per milliliter concentration were determined by averaging countable plates, accounting for
sample volume and sample dilution. The lower detection limit for PFU was <1 per 100 μL (<10
per mL). For reporting purposes, undiluted counts lower than the detection limit were halved and
calculations were conducted using the value 5 PFU/mL for non-detectable counts. This
assumption was made to allow non-detectable counts to be included in average and standard
error calculations. DAL plates at the upper detection limit were marked as too numerous to count
(TNTC) and further dilutions were reviewed to determine viral concentration. Data was collected
in a lab notebook and then entered into Microsoft Excel spreadsheets.
Virus inactivation for survival and disinfection experiments was calculated by a log10 (Nt / N0)
method where Nt is the viral concentration at time t and N0 is the viral concentration at time 0.
Inactivation was displayed as negative log10 (Nt / N0) values over a period of minutes for
disinfection experiments and days for survival experiments. Virus inactivation values were
averaged for each time point and standard error was calculated and included on plots of
Disinfection Kinetics Modeling
Due to poor ‘goodness-of fit’ using conventional first-order disinfection kinetic models like
Chick-Watson, the kinetics of free chlorine disinfection for each surrogate virus was modeled
using the Selleck model of disinfection, which shows strong tailing-off of viral concentration
over time. This tailing off is most accurately represented by curve labeled ‘D’ in the following
figure from Gyürék and Finch (1998).
The Selleck model of disinfection, under disinfectant demand conditions, includes a parameter
(k’) that accounts for the decay in concentration of the disinfectant being utilized. The Selleck
rate law accounting for first order free chlorine decay and its integrated form are expressed
below:
𝑑𝑆 𝑑𝑡 = −
𝑛𝐶!exp −𝑘!𝑡
𝑘 𝑆(!!!)/!
𝑆= 1+ 𝐶!
𝑘𝑘!(1−𝑒!!
log 𝑁
𝑁! = −𝑛 𝑙𝑜𝑔 1+
𝐶!
𝑘𝑘′(1−𝑒!! !!)
A demand condition refers to conditions that lead to the irreversible consumption of the
disinfecting-ability of a chosen chemical disinfectant. The matrix used in the experiments
contained a considerable amount of oxidizable organic material, which led to the reduction of
free chlorine to organochlorides and assorted chloramines. These reduced chlorine compounds
maintain disinfecting capabilities, but are only minimally effective when compared to the
disinfecting ability of free chlorine. In this case, the k’ constant can be determined empirically by
measuring free chlorine concentration decay over time. Initial free chlorine values were chosen
(20,000; 25,000; and 30,000 mg/L) and appropriate volumes of liquid bleach were dosed into a
20 mL volume of matrix. Concentration of free chlorine was recorded in mg/L at 1.5, 4, 10, and
30-minute time points using a Hach Pocket Colorimeter II apparatus. Exceedingly high initial
free chlorine concentrations were needed to overcome a high upper detection limit (20 mg/L) of
the analytical method so the decrease in concentration could be measured over time. This
detection limit was a product of the dilution necessary to reduce the significant turbidity of the
matrix when measuring free chlorine concentration with the pocket colorimeter. This limitation
required an assumption that free chlorine consumption occurs proportionally in a similar manner
at initial free chlorine concentrations more relevant to the disinfection concentrations used in
batch disinfection experiments (500 mg/L (0.05%) to 4000 mg/L (0.4%)).
Three separate experiments with varying initial free chlorine values (2.0%; 2.5%; and 3.0%)
were combined on the same figure (Figure A3). To determine k’ in the context of the Selleck
chlorine concentration (C0) was plotted versus time. Linear regression analysis (y-intercept set at
0) provided assumed average k’ values (negative slope) for each initial free chlorine value.
Associated R2
values were low but using empirically derived k’ values proved to be highly
predictive of inactivation kinetics. To determine the k’ values for initial free chlorine
concentrations of relevance to this report, observed k' values were plotted versus initial free
chlorine concentration (Figure A4) and linear regression analysis was performed (R2
= 0.93).
Disinfectant decay constants were predicted via extrapolation to initial free chlorine values used
in disinfection experiments. These k’ values are summarized in Table A3. Using these
empirically derived k’ values in the Selleck equation in JMP statistical software produced low
RESULTS
Survival
Ebola virus surrogates MS2 (Figure 1), PhiX-174 (Figure 2), and Phi6 (Figure 3) were spiked
into a matrix of 75% hospital sewage and 25% human fecal waste and tested for persistence over
a maximum of 18 days. Survival experiments were performed at both 22 O
C (ambient conditions)
and 37 O
C (mesophilic conditions). These tests were conducted to determine baseline
survivability of each surrogate in a conservative matrix to indicate the possible persistence of the
Ebola virus in a similar matrix in health care facilities or sewage collection at different
Figure 1: Survival of surrogate MS2 coliphage (average t0 titer: 8.2 log10 PFU/mL) expressed as log10 (Nt/N0) over time (days) in a matrix of raw hospital sewage and human fecal waste at 22
O C (ambient) (blue circles) and 37 O
C (mesophilic) (red squares). Bars show the standard error for each time point (n ≥ 2 for each point). Linear trendlines are shown with corresponding R2 values. The dashed line represents a target 99.999% reduction in viral titer.
The reduction of MS2 titer in a matrix of raw hospital sewage and human fecal waste over 18
days at 22 O
C and 15 days at 37 O
C is summarized in Figure 1. Observed viral inactivation values
are expressed as data points with corresponding error bars. Predicted viral inactivation rates
obtained from regression analysis are shown as a solid line. There was increasing inactivation of
MS2 at both temperature conditions and reductions in viral titer followed first-order kinetics.
consistently more rapid decline in infectivity at 37 O
C than at 22 O
C. Linear regression analysis
predicted 5 log10 (99.999%) reductions of MS2 at approximately 42 and 25 days at 22 O
C (R2 =
0.95) and 37 O C (R2
= 0.86) respectively. Ninety percent (1 log10) inactivation of MS2 required
8.3 days at ambient (22 O
C) temperature and only 5.0 days at mesophilic (37 O
C) temperature.
Average daily inactivation was 0.12 log10 at 22 O
C and 0.20 log10 at 37 O
C.
Figure 2: Survival of surrogate PhiX-174 coliphage (average t0 titer: 7.0 log10 PFU/mL) expressed as log10 (Nt/N0) over time (days) in a matrix of raw hospital sewage and human fecal waste at 22 O
C (ambient) (blue circles) and 37 O
C (mesophilic) (red squares). Bars show the standard error for each time point (n ≥ 2 for each point). Linear trendlines are shown with corresponding R2
The reduction of PhiX-174 titer in a matrix of raw hospital sewage and human fecal waste over
18 days at 22 O
C and 15 days at 37 O
C is summarized in Figure 2. Observed viral inactivation
values are expressed as data points with corresponding error bars. Predicted viral inactivation
rates obtained from regression analysis are shown as a solid line. There was a progressive
inactivation of PhiX-174 over time at both temperature conditions and reduction in viral titer
followed first-order kinetics. Ninety percent (1 log10) inactivation of PhiX-174 required 17 days
at ambient (22 O
C) temperature and only 3.9 days at mesophilic (37 O
C) temperature. Linear
regression analysis predicted 5 log10 (99.999%) reductions at approximately 83 and 19 days for
22 O C (R2
= 0.81) and 37 O C (R2
= 0.91) respectively. Average daily inactivation was 0.06 log10
at 22 O
C and 0.26 log10 at 37 O
Figure 3: Survival of surrogate Phi6 bacteriophage (average t0 titer: 7.8 log10 PFU/mL) expressed as log10 (Nt/N0) over time (days) in a matrix of raw hospital sewage and human fecal waste at 22 O
C (ambient) (blue circles) and 37 O
C (mesophilic) (red squares). Bars show the standard error for each time point (n ≥ 2 for each point). Linear trendlines are shown with corresponding R2
values. The dashed line represents a target 99.999% reduction in viral titer.
The reduction of Phi6 titer in a matrix of raw hospital sewage and human fecal waste over 18
days at 22 O
C and 15 days at 37 O
C is summarized in Figure 3. Observed viral inactivation values
are expressed as data points with corresponding error bars. Predicted viral inactivation rates
obtained from regression analysis are shown as a solid line. There was a progressive inactivation
of Phi6 at both temperature conditions and reduction in viral titer followed first-order kinetics.
days for 22 O C (R2
= 0.89) and 37 O C (R2
= 0.89) respectively. Ninety percent inactivation of
Phi6 required only 1.82 days at ambient (22 o
C) temperature and a mere 0.31 days (about 7
hours) at mesophilic (37 o
C) temperature. Average daily inactivation was 0.55 log10 at 22 O
C and
3.2 log10 at 37 O
C. The limit of detection (<10 PFU/mL) was reached within one day 3 out of 4
trials for survival experiments at mesophilic (37 O
C) temperature. The limit of detection was 10
PFU/mL so maximum reductions were approximately 6 log10.
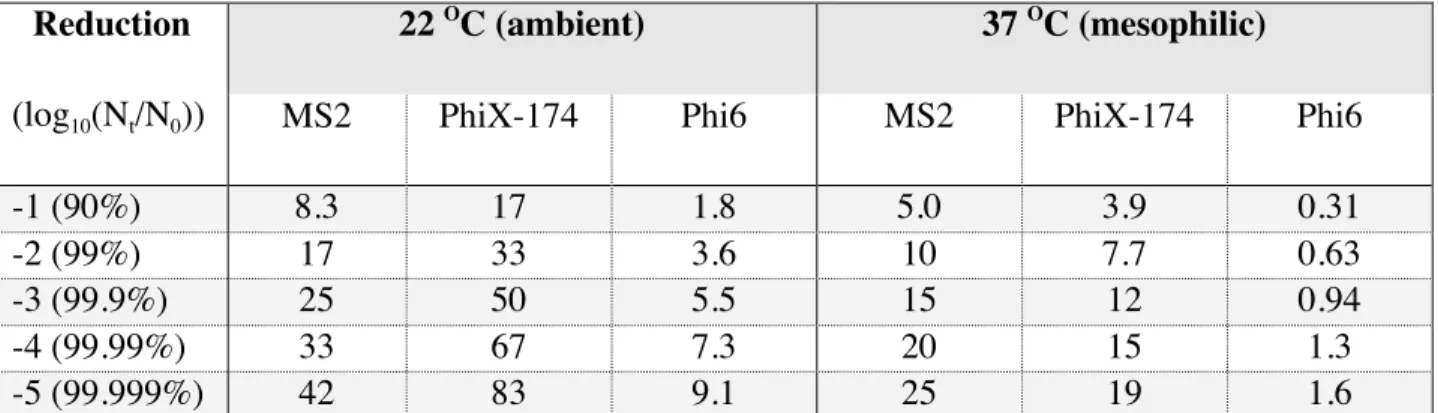
Results from regression analysis for the reduction of each surrogate virus at each temperature
condition is summarized in Table 2. Time in days to achieve 90%, 99%, 99.9%, 99.99%, and
99.999% (1, 2, 3, 4, and 5 log10) are shown below for MS2, PhiX-174, and Phi6 at both 22 O
C
and 37 O
C for comparison. Phi6 was inactivated most rapidly at both temperature conditions with
99.999% or 5 log10 reduction achieved in 9.1 and 1.6 days at 22 and 37 O
C, respectively. MS2
and PhiX-174 showed considerable persistence at the ambient temperature condition, with MS2
requiring a predicted 6 weeks and PhiX-174 requiring a predicted 12 weeks for achieving the
target 5 log10 reduction.
Reduction
(log10(Nt/N0))
22 O
C (ambient) 37 O
C (mesophilic)
MS2 PhiX-174 Phi6 MS2 PhiX-174 Phi6
-1 (90%) 8.3 17 1.8 5.0 3.9 0.31
-2 (99%) 17 33 3.6 10 7.7 0.63
-3 (99.9%) 25 50 5.5 15 12 0.94
-4 (99.99%) 33 67 7.3 20 15 1.3
-5 (99.999%) 42 83 9.1 25 19 1.6
Table 2: Predicted times (in days) based on linear regression modeling for decimal reductions of
MS2, PhiX-174, and Phi6 in a matrix of hospital sewage and fecal waste at 22 O
Disinfection
Ebola virus surrogates MS2, PhiX-174, and Phi6 were spiked into a matrix of 75% hospital
sewage and 25% human fecal waste and disinfected with free chlorine (liquid bleach – sodium
hypochlorite). Disinfection experiments tested varying initial free chlorine concentrations for
their ability to inactivate surrogate viruses at 1, 3, 10, and 30-minute time points. These tests
were performed to evaluate inactivation and resistance for each virus surrogate in a conservative
matrix to depict the possible inactivation of the Ebola virus in a similar high strength fecal waste
matrix in health care facilities or sewage collection systems. This conservative matrix made it
particularly difficult to achieve desired disinfection targets and is therefore a probable ‘worst
case scenario’ matrix to perform chemical disinfection. Double agar layer viral titer (plaque)
assays were conducted to determine the extent of virus inactivation at each time point. Figures 4,
5, and 6 show average reductions at the 10-minute time point (target in situ disinfectantcontact
Figure 4: Free chlorine disinfection of surrogate MS2 coliphage after 10 minutes contact time (average t0 titer: 8.3 log10 PFU/mL) expressed as log10 (Nt/N0) vs. varying initial free chlorine concentrations (mg/L) in a matrix of raw hospital sewage and human fecal waste. Bars show the standard error for each time point (n ≥ 2 for each point except 4000 mg/L). Linear trendline is
shown with corresponding R2
value. The dashed line represents a target 99.999% reduction in viral titer.
The free chlorine disinfection of MS2 coliphage in a matrix of raw hospital sewage and human
fecal waste after 10 minutes of contact time for varying initial free chlorine concentrations is
summarized in Figure 4. Observed viral inactivation values are expressed as data points with
corresponding standard error bars. Predicted viral inactivation obtained from regression analysis
is shown as a solid line. MS2 showed considerable resistance to disinfection and there was a
modest negative correlation between initial free chlorine concentration and log10 reductions (R 2
0.42). Regression analysis predicted approximately 24,000-mg/L (2.4%) initial free chlorine
concentration would be required to achieve a 5 log10 (99.999%) reduction within 10 minutes.
Figure 5: Free chlorine disinfection of surrogate PhiX-174 coliphage after 10 minutes contact time (average t0 titer: 7.2 log10 PFU/mL) expressed as log10 (Nt/N0) vs. varying initial free chlorine concentrations (mg/L) in a matrix of raw hospital sewage and human fecal waste. Bars show the standard error for each time point (n ≥ 2 for each point except 4000 mg/L). Linear trendline is shown with corresponding R2 value. The dashed line represents a target 99.999% reduction in viral titer.
The free chlorine disinfection of PhiX-174 coliphage in the high strength matrix of raw hospital
sewage and human fecal waste after 10 minutes of contact time for varying initial free chlorine
data points with corresponding standard error bars. The predicted viral inactivation rate obtained
from regression analysis is shown as a solid line. PhiX-174 disinfection displayed a strong
negative correlation between initial free chlorine concentration and log10 reductions (R 2
= 0.96).
Regression analysis predicted approximately 3,500 mg/L (0.35%) initial free chlorine
concentration would be required to achieve a 5 log10 (99.999%) reduction within 10 minutes.
Figure 6: Free chlorine disinfection of surrogate Phi6 bacteriophage after 10 minutes contact time (average t0 titer: 7.9 log10 PFU/mL) expressed as log10 (Nt/N0) vs. varying initial free chlorine concentrations (mg/L) in a matrix of raw hospital sewage and human fecal waste. Bars show the standard error for each time point (n ≥ 2 for each point except 4000 mg/L). Linear trendline is shown with corresponding R2
The free chlorine disinfection of Phi6 bacteriophage in the high strength matrix of raw hospital
sewage and human fecal waste after 10 minutes of contact time for varying initial free chlorine
concentrations is summarized in Figure 6. Observed viral inactivation values are expressed as
data points with corresponding standard error bars. The predicted viral inactivation rate obtained
from regression analysis is shown as a solid line. Phi6 disinfection displayed a strong negative
correlation between initial free chlorine concentration and log10 reductions (R 2
= 0.94).
Regression analysis predicted approximately 2,800 mg/L (0.28%) initial free chlorine would be
required to achieve a 5 log10 (99.999%) reduction within 10 minutes.
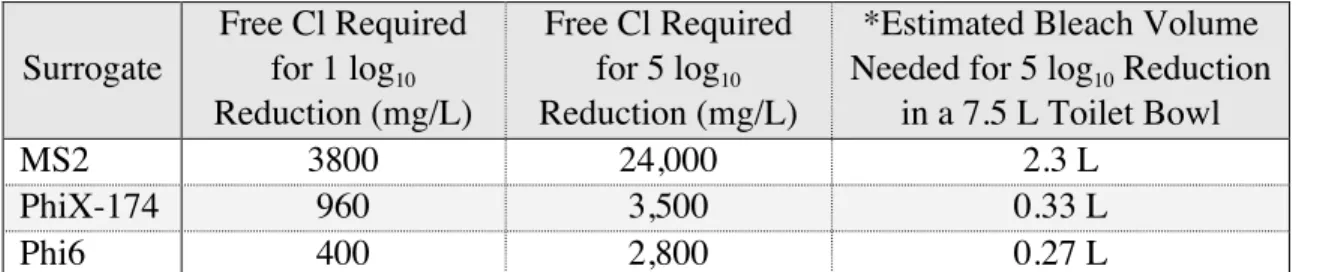
Surrogate
Free Cl Required for 1 log10 Reduction (mg/L)
Free Cl Required for 5 log10 Reduction (mg/L)
*Estimated Bleach Volume Needed for 5 log10 Reduction
in a 7.5 L Toilet Bowl
MS2 3800 24,000 2.3 L
PhiX-174 960 3,500 0.33 L
Phi6 400 2,800 0.27 L
Table 3: Comparison of initial free chlorine concentrations (mg/L) required for 1 and 5 log10 reductions of each surrogate virus and the volume of bleach required to achieve a 5 log10
reduction in 10 minutes in actual-scale conditions. *Actual amount (L) of 7.85% bleach needed for 5 log10 inactivation of surrogate virus in a 7.5 L toilet bowl.
Results from regression analysis for the disinfection of each surrogate virus is summarized in
Table 3. Initial free chlorine concentrations required to achieve 90% and 99.999% are shown
above for MS2, PhiX-174, and Phi6 for comparison. An additional column is included to provide
a volume of 7.85% bleach that would be required to achieve a 5 log10 reduction of each surrogate
virus in a comparable matrix in a 7.5 L toilet bowl. Phi6 was most readily disinfected by free
chlorine and PhiX-174 was slightly more resistant, with 5 log10 reductions of each estimated to